
Implied volatility (IV) is a forward-looking metric that measures the market's expectation of how much an asset's price will move over a given period, expressed as an annualised percentage. In options markets, IV is derived mathematically from the current price of an options contract, it tells you what level of future volatility the market has 'priced in.' High implied volatility means traders expect large price swings ahead. Low implied volatility means the market expects relative calm. In crypto, implied volatility is one of the most powerful signals available, not just for options traders, but for anyone trading Bitcoin, Ethereum, or altcoins on spot or perpetual futures markets.
In this guide, you will learn exactly what implied volatility is, how it differs from historical volatility, how to read IV signals like IV Rank and IV Percentile, what high and low IV environments mean for your trading strategy, and how to apply all of this on BingX.
What Is Implied Volatility in Crypto Trading?
Implied volatility is the market's collective forecast of future price movement not what has happened, but what traders expect to happen. The word "implied" is key: IV is not directly observed. It is reverse-engineered from the market price of options contracts using mathematical models like Black-Scholes.
Here is the core logic: when traders expect large price swings in the future, they are willing to pay more for options contracts, which protect against or profit from those swings. The higher the option price, the higher the implied volatility extracted from that price.
Think of IV as the market's fear and greed gauge for a specific asset over a specific timeframe. When fear is high during market crashes, regulatory news, or macro shocks, IV spikes. When markets are calm and trending, IV compresses.
Read more: What Is Crypto Fear and Greed Index and How to Use It in Crypto Trading?
How Implied Volatility Works: An Example
Imagine insurance premiums. When a hurricane is approaching, home insurance premiums spike because insurers expect claims are coming. When skies are clear and calm, premiums drop. Implied volatility works the same way, options premiums spike when the 'storm' of a major price move seems imminent, and compress when conditions look stable.
Implied Volatility vs. Historical Volatility: Key Differences
These two metrics are frequently confused but measure completely different things:
|
Implied Volatility (IV) |
Historical Volatility (HV) |
|
|
What it measures |
Expected future price movement |
Actual past price movement |
|
Based on |
Current options market prices |
Past price data (standard deviation) |
|
Timeframe |
Forward-looking |
Backward-looking |
|
How it's calculated |
Reverse-engineered from options pricing models |
Statistical calculation of past returns |
|
What it tells you |
What the market expects to happen |
What actually happened |
|
Use case |
Timing options entries, gauging market fear |
Comparing current expectations to past reality |
How Implied Volatility and Historical Volatility Are Related
When implied volatility is significantly higher than historical volatility, options are expensive, the market is pricing in more fear than the asset's actual historical movement justifies. This is often an opportunity to sell premium (sell options) rather than buy it. When implied volatility is lower than historical volatility, options are relatively cheap, the market may be underestimating coming volatility. This can be an opportunity to buy options ahead of a major move.
In crypto, this gap between IV and HV is often called the Volatility Risk Premium (VRP) and in Bitcoin, the VRP has historically averaged around +13%, meaning crypto options sellers have a structural edge over time.
How Is Implied Volatility Calculated?
IV is not calculated directly, it is derived by plugging the current option price into a pricing model and solving backwards for the volatility input that would produce that price.
The most common model is Black-Scholes:
Option Price = f(Underlying Price, Strike Price, Time to Expiry, Risk-Free Rate, Implied Volatility)
All other inputs are known. IV is the single unknown variable, you solve for the volatility that, when plugged into the formula, produces the observed option price.
In practice, as a crypto trader, you never need to calculate implied volatility (IV) manually. Modern platforms deliver real-time IV data at your fingertips, so you can focus on interpretation rather than complex math.
Here are the best tools:
1. Deribit’s DVOL Index — The benchmark Bitcoin volatility index, widely considered the 'VIX for crypto.' It aggregates 30-day at-the-money implied volatility from Deribit’s large options market and updates live.
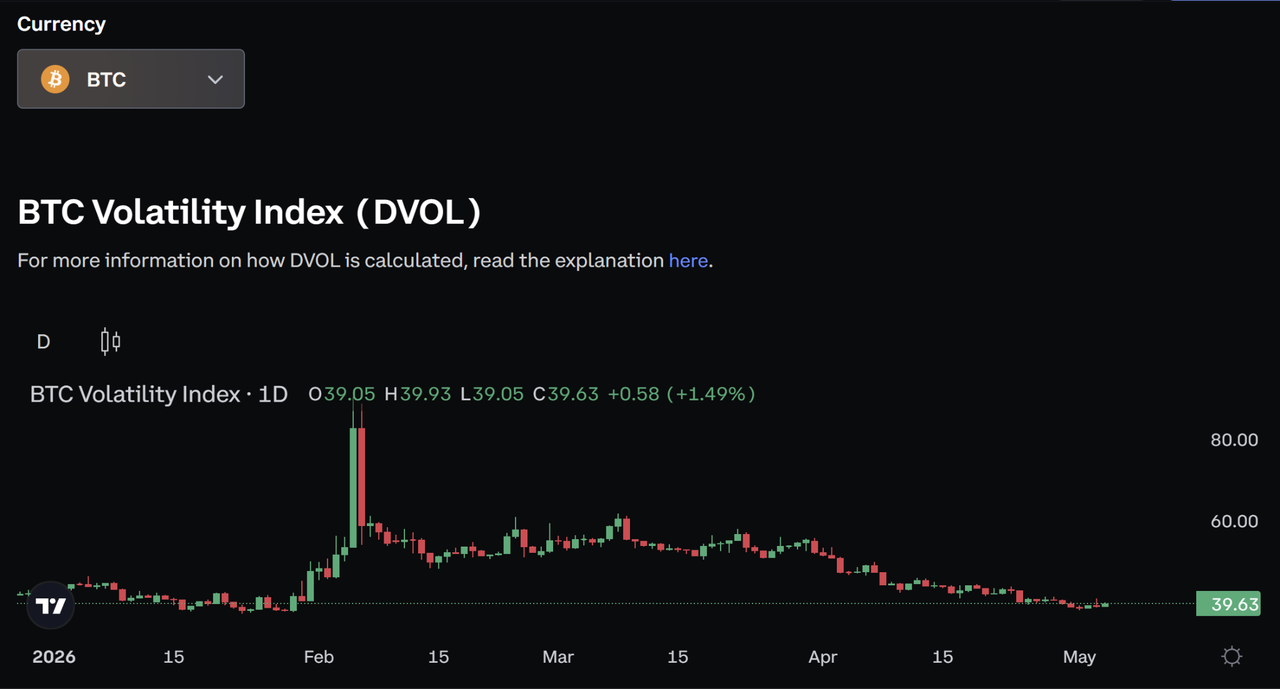
Source: Deribit's DVOL index: The benchmark Bitcoin IV index, equivalent to the VIX for crypto
2. TradingView — Search for “Implied Volatility” in the indicators menu to access powerful community scripts showing IV for crypto options, historical comparisons, and percentiles.
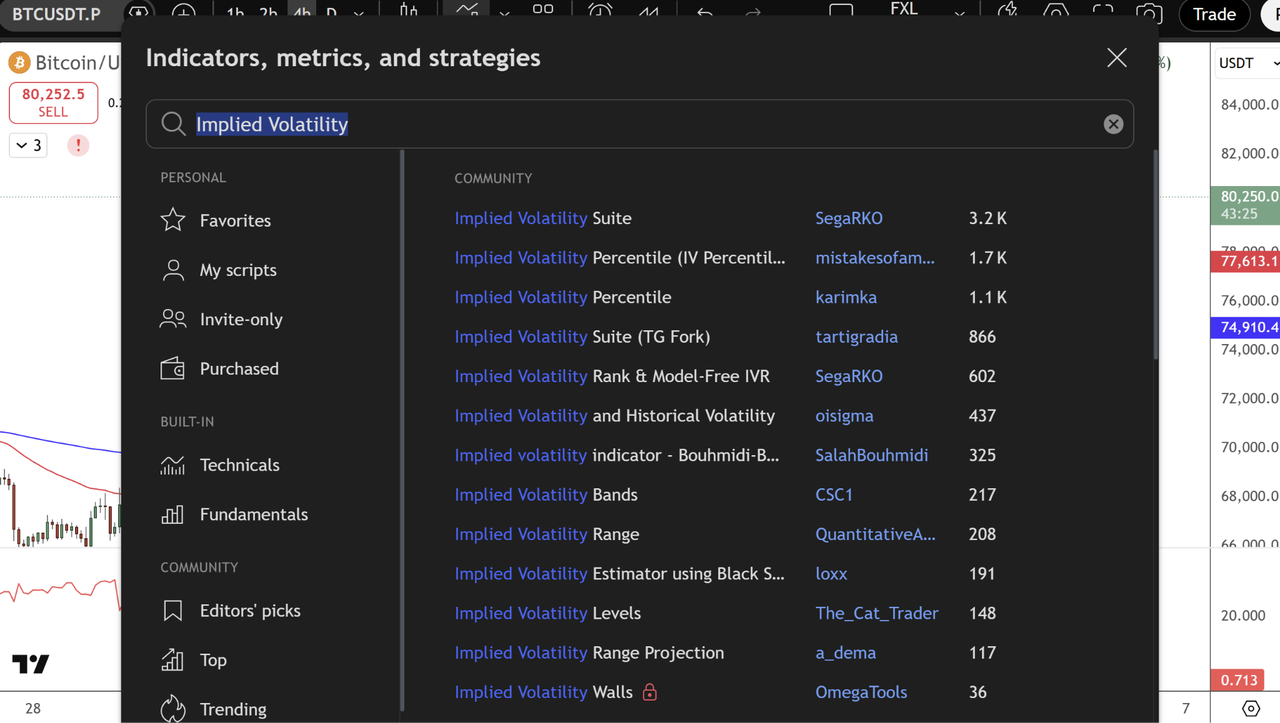
Source: TradingView
3. Laevitas.ch & The Block — Laevitas provides detailed model volatility tables, skew, and term structure data. The Block offers clean historical charts of ATM implied volatility across different timeframes like 7D, 30D, 90D, etc..
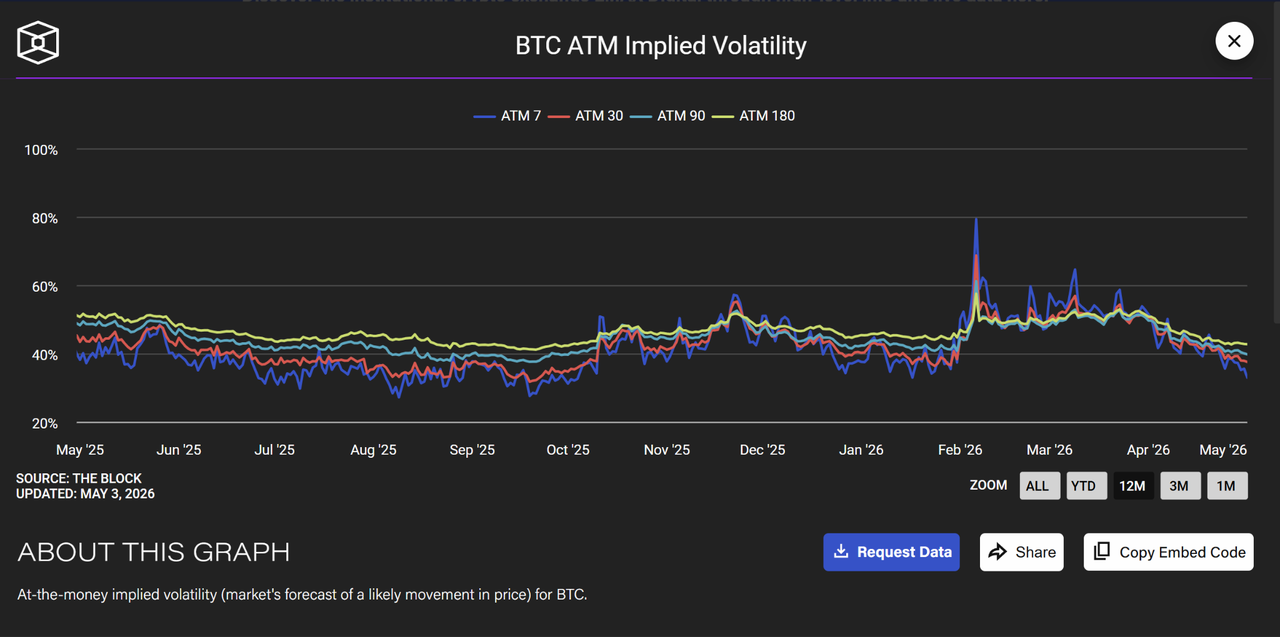
Source: The Block
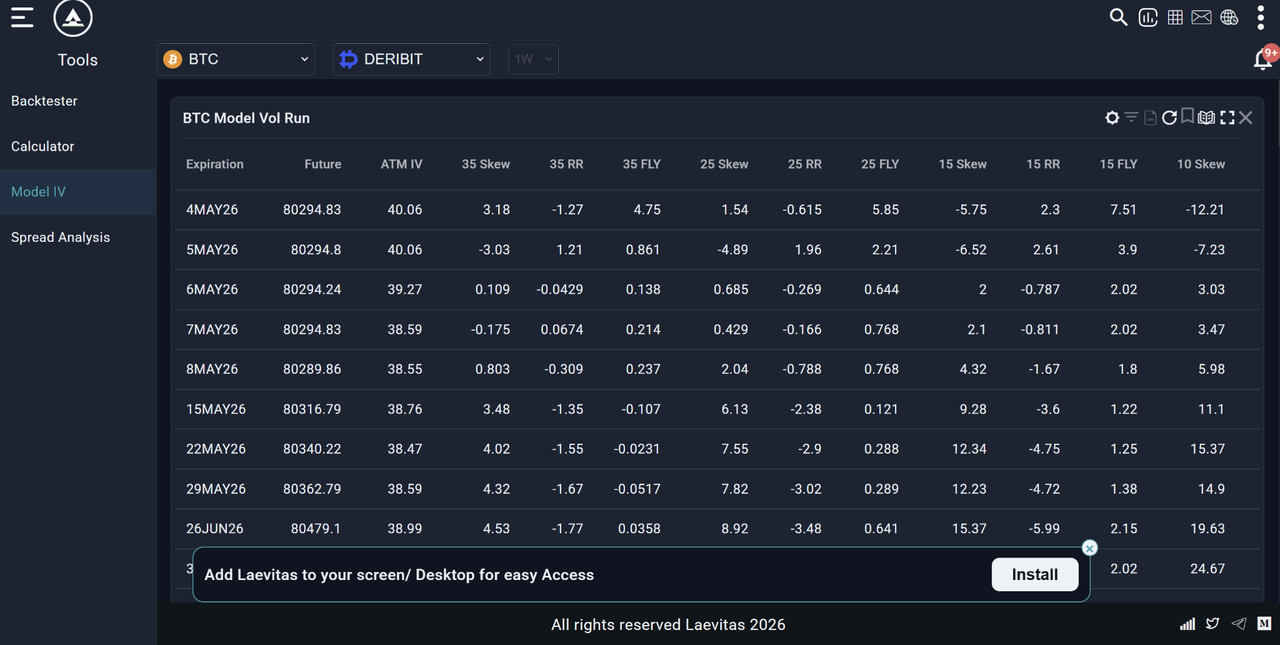
Source: Laevitas.ch
All these platforms show IV in real time. The real skill is learning how to read the number: high IV signals expensive options and expected large moves; low IV suggests calm markets and cheaper premium. Focus on context, trends, and how IV compares to historical volatility that’s what separates good traders from the rest.
What Does the IV Number Actually Mean?
IV is expressed as an annualised percentage. An IV of 70% means the market expects Bitcoin to move roughly ±70% on an annualised basis.
To convert to a daily expected move:
- Daily Expected Move = IV / √365
- For BTC at IV = 70%:
- Daily Expected Move = 70% / √365 = 70% / 19.1 ≈ 3.7%
This means the options market expects Bitcoin to move approximately ±3.7% on any given day. This is not a prediction of direction, only of magnitude.
|
BTC IV Level |
Implied Daily Move |
Market Regime |
|
40% |
±2.1% |
Calm / low fear |
|
60% |
±3.1% |
Moderate volatility |
|
80% |
±4.2% |
Elevated fear |
|
100%+ |
±5.2%+ |
Extreme stress / crisis |
What Are IV Rank and IV Percentile: The Tools That Actually Matter for Trading
Raw IV numbers are difficult to interpret in isolation because each asset has its own "normal" volatility range. A 70% IV for Bitcoin could be extreme or moderate depending on Bitcoin's recent IV history. This is why traders use IV Rank and IV Percentile, two normalised measures that tell you whether current IV is high or low relative to its own recent history.
IV Rank (IVR)
IV Rank measures where current IV sits relative to the 52-week high and low of IV for that asset:
IV Rank = (Current IV − 52-Week IV Low) / (52-Week IV High − 52-Week IV Low) × 100
Example:
- BTC's 52-week IV high: 110%
- BTC's 52-week IV low: 35%
- Current IV: 70%
- IV Rank = (70 − 35) / (110 − 35) × 100 = 46.7
An IV Rank of 46.7 means current IV sits roughly in the middle of its 52-week range, neither extreme.
|
IV Rank |
Interpretation |
Trading implication |
|
0–20 |
IV very low relative to history |
Options relatively cheap — consider buying |
|
20–40 |
IV below average |
Neutral — no strong options signal |
|
40–60 |
IV around average |
Neutral |
|
60–80 |
IV above average |
Options getting expensive — consider selling |
|
80–100 |
IV very high relative to history |
Options expensive — strong sell premium signal |
IV Percentile (IVP)
IV Percentile measures the percentage of days in the past year where IV was lower than today's reading:
Example: An IV Percentile of 75 means current IV is higher than 75% of all daily IV readings over the past year.
IV Rank vs IV Percentile - which to use? IV Percentile is generally more reliable because it is not distorted by a single extreme spike. If Bitcoin had one day where IV hit 200%, that day would skew the IV Rank calculation significantly. IV Percentile is less affected by outliers. Use both — but if they conflict, lean toward IV Percentile.
What Is IV Crush And Why Does It Matter for Crypto Traders?
IV crush is one of the most important concepts for crypto options traders and one of the most frequently misunderstood. IV crush happens when implied volatility drops sharply after a major expected event (like a Fed decision, Bitcoin halving, ETF approval, or major earnings release). Here's how it works:
- Before the event: Options premiums are elevated because IV is high, the market is pricing in the uncertainty of the event
- The event occurs: The uncertainty resolves regardless of whether the outcome is positive or negative
- After the event: IV drops sharply (crushes) because the uncertainty is gone, even if the price moved significantly
Why this kills options buyers:
Imagine you buy a Bitcoin call option for $5,000 in premium the week before a major regulatory decision. Bitcoin rallies 10% on the announcement, which sounds like a win. But if IV drops from 90% to 40% simultaneously, the value of your option may have barely changed or even fallen, because the IV crush counteracted the price move. This is why experienced options traders often sell options into high-IV events rather than buy them, they profit from the IV crush even when the direction is uncertain.
Common IV Crush Triggers in Crypto
|
Event type |
Typical IV behaviour |
|
Fed interest rate decisions |
IV spikes before, crushes after |
|
Bitcoin halving |
IV elevates in weeks before, compresses post-event |
|
Major regulatory rulings (ETF approvals, bans) |
Sharp IV spike before, immediate crush |
|
Major exchange collapses or hacks |
IV spikes sharply — may stay elevated |
|
Protocol upgrades (Ethereum Merge type events) |
IV builds weeks before, crushes on completion |
|
Quarterly options expiry (Deribit) |
IV often elevated then drops at expiry |
Implied Volatility and Bitcoin's DVOL: The Crypto VIX
For Bitcoin specifically, the benchmark IV index is DVOL, Deribit's Bitcoin Volatility Index. DVOL is crypto's equivalent of the VIX (Wall Street's fear gauge) and measures the 30-day implied volatility of Bitcoin options on Deribit.
How to Read DVOL
|
DVOL Reading |
Interpretation |
|
Below 40 |
Low fear — market calm, complacency risk |
|
40–60 |
Moderate volatility — normal crypto conditions |
|
60–80 |
Elevated fear — increased uncertainty |
|
80–100 |
High fear — potential for large moves |
|
Above 100 |
Extreme stress — crisis conditions |
Key DVOL Signals in 2026
In January 2026, DVOL jumped from approximately 37 to above 44 as Bitcoin sold off sharply, with over $1.7 billion in long positions liquidated. This spike confirmed what the chart alone couldn't: the market was bracing for more volatility, not just experiencing a routine pullback. Traders who monitored DVOL alongside price had an earlier warning signal than those watching price action alone.
Top Platforms to Track DVOL
- Deribit.com options platform
- The Block's data section
- Laevitas.ch (DVOL charts)
- TradingView (search DVOL)
On BingX, users can access options trading with real-time implied volatility insights alongside spot and derivatives markets.
What Is Volatility Skew and What Does It Reveal About Market Sentiment?
Volatility skew describes the difference in implied volatility between options at different strike prices. In a perfectly symmetrical market, IV would be the same for calls and puts at equal distances from the current price. In practice, it almost never is.
Put Skew (Negative Skew) - Most Common in Crypto
When put options (downside protection) trade at higher IV than equivalent call options, it indicates:
- Traders are paying a premium for downside protection
- Market participants are more fearful of a crash than they are hopeful of a rally
- Institutions are hedging their long crypto positions
The 25-Delta Risk Reversal measures this: it is calculated as Call IV minus Put IV. When this number is negative (puts are more expensive than calls), the market has a put skew, a signal of fear or bearish bias.
In February 2026, the 25-Delta Risk Reversal for Bitcoin reached -19.34, its lowest level since 2022, signalling the strongest preference for downside protection in more than three years. Traders monitoring this metric had early warning of heightened institutional hedging activity.
Call Skew (Positive Skew) - Rare but Significant
When calls trade at higher IV than puts, it signals:
- Strong expectation of a rally
- FOMO buying of upside exposure
- Often precedes or accompanies bull market phases
A shift from put skew to call skew in crypto is frequently a leading indicator of a bullish regime change.
How High vs. Low IV Changes Your Crypto Trading Strategy
This is the practical heart of the article, what to actually do with IV signals.
High IV Environment: IVR Above 60, DVOL Above 70
High IV means options are expensive. The market is pricing in significant fear or uncertainty.
What This Means for Different Trader Types
1. Options Traders
- Selling options (collecting premium) is statistically more profitable — you are selling expensive insurance
- Strategies: short strangles, short straddles, covered calls, cash-secured puts
- Risk: selling options in a crisis carries unlimited downside — always define your risk with spreads
2. Spot Traders
- High IV often accompanies sharp sell-offs, may signal a capitulation bottom approaching
- Do not chase short positions when IV is already extreme, the move may be nearly done
- Consider scaling into spot positions at high IV lows rather than waiting for "confirmation"
3. Perpetuals/Futures Traders
- High IV = high liquidation risk, reduce leverage significantly
- Widen your stop-losses to account for larger-than-normal price swings
- Consider reducing position size, volatility can trigger stops that would normally hold
4. Copy Traders on BingX
- During high IV periods, review the strategy's drawdown history
- Strategies that perform well in calm markets may have catastrophic drawdowns in high IV
- Consider pausing copy trading during extreme IV spikes (DVOL above 90)
Low IV Environment: IVR Below 20, DVOL Below 45
Low IV means options are cheap. The market expects calm. This is often, paradoxically, a higher-risk environment than high IV because complacency has set in.
What This Means for Different Trader Types
1. Options Traders
- Buying options is statistically more attractive, you are buying cheap insurance before a potential storm
- Strategies: long calls, long puts, long straddles, long strangles
- Risk: time decay (theta) erodes option value quickly if the move doesn't materialise
2. Spot Traders
- Low IV often precedes large moves, markets tend to go from calm to chaos, not the reverse
- Be cautious of excessive complacency, low IV environments can end abruptly
- A good time to quietly accumulate if price action and fundamentals support it
3. Perpetuals/Futures Traders
- Low IV = tighter price ranges, good for range-bound strategies
- Do not over-leverage assuming the calm will last,IV can spike violently without warning
- Set tighter take-profits in range conditions; do not hold positions expecting a big move
How to Read IV as a Non-Options Crypto Trader
Most BingX traders do not actively trade options but IV still provides valuable signals for spot and futures trading. Here is how to use it without ever touching an options contract:
Signal 1: IV Spike + Price Drop = Potential Capitulation
When Bitcoin's price drops sharply AND DVOL spikes simultaneously, it often marks a fear-driven capitulation bottom. Retail traders are panic-selling and institutions are hedging aggressively. Historically, buying Bitcoin when DVOL is above 80 and price has already dropped 20%+ has been one of the highest-probability long-term entry signals.
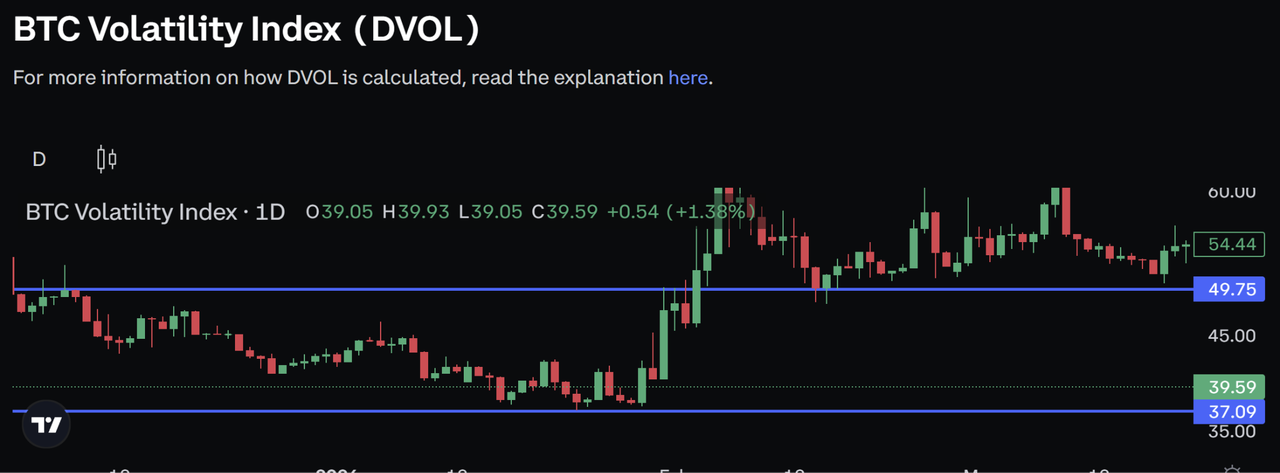
Source: Deribit BTC Volatility Index
Example: In January 2026, DVOL spiked from 37 to 45+ as BTC sold off. Traders who used this as a signal to scale into spot rather than panic-sell benefited from the subsequent recovery.
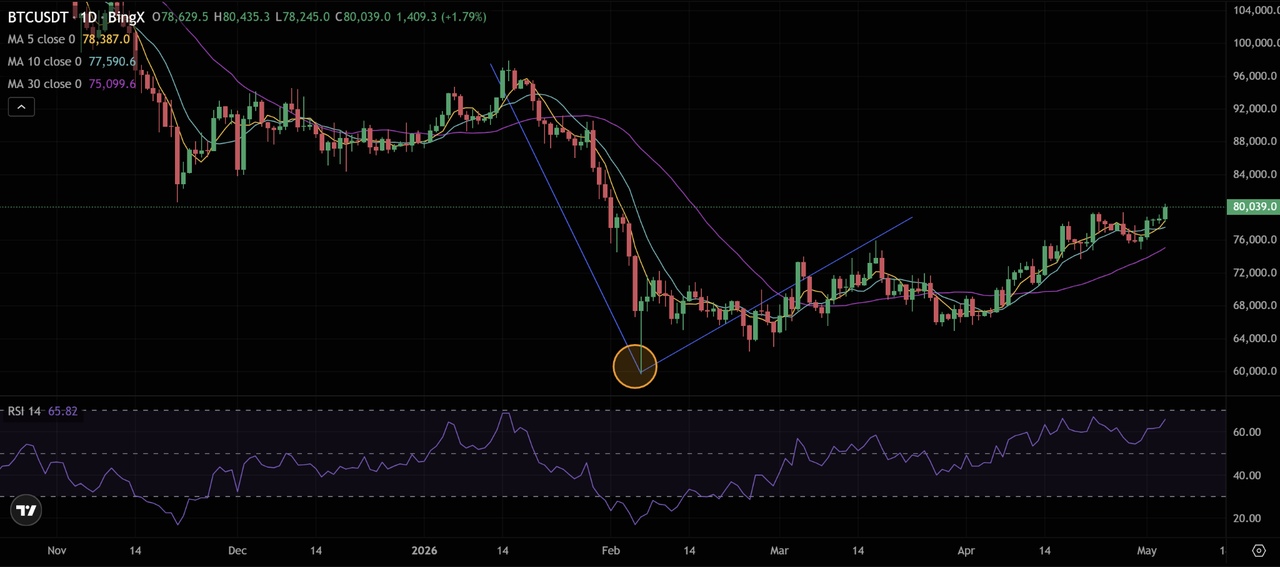
Bitcoin (BTC/USD) Price Chart - Source: BingX
Signal 2: IV Compression + Sideways Price = Expansion Coming
When DVOL is below 45 and Bitcoin has been moving sideways for an extended period, a major move is typically building. IV compression followed by IV expansion (a sudden spike in DVOL) usually precedes a breakout or breakdown.
How to trade it: Rather than guessing direction, wait for the DVOL spike to begin, then trade the confirmed direction of the breakout.
Signal 3: IV Rank Above 80 = Reduce Leverage
When IV Rank is above 80, meaning current IV is in the top 20% of its 52-week range, the market is in a high-stress state. This is the wrong time to run high leverage on BingX Perpetuals. Daily price swings can be 4–6%+ on a routine basis in these environments, and leveraged positions face an elevated liquidation risk. Scale down to 2–3× or lower during high IV periods.
Signal 4: Persistent Put Skew = Institutional Bearish Hedging
When the 25-Delta Risk Reversal stays deeply negative for weeks, it signals sustained institutional demand for downside protection. This does not necessarily mean a crash is imminent, but it does mean large players are paying to hedge against one. In a market where institutions are cautious, running aggressive long positions without protective stops is high risk.
How to Use Implied Volatility for Trading on BingX: Practical Application
While BingX Spot and Perpetual Futures do not display IV directly in the trading interface, you can use IV as an external signal to inform your trading on BingX:
- Check DVOL daily - Open Laevitas.ch or The Block's data section. Note whether DVOL is rising, falling, or stable.
- Check IV Rank: is current IV in the top 20% of its 52-week range (high) or bottom 20% (low)?
- Map to your BingX position:
- High IV + recent price drop → reduce leverage, consider scaling into spot
- Low IV + sideways price → expect expansion; wait for breakout before entry
- IV spiking → tighten risk management, widen stops, reduce position size
- High IV + recent price drop → reduce leverage, consider scaling into spot
- Use IV context for perpetual sizing - in a high IV environment (DVOL above 70), cap your leverage at 3× maximum. In a low IV environment (DVOL below 45), standard position sizing is appropriate.
- For copy trading decisions - check whether the strategy's best performance periods coincide with low IV or high IV regimes. A strategy that only works in calm markets will underperform in the next volatility spike.
What Are the 5 Common Mistakes to Avoid When Using Implied Volatility?
When using implied volatility in crypto trading, understanding its limitations is key to avoiding costly errors.
- Treating IV as a directional signal IV tells you how much the market expects price to move, not which direction. A high IV reading does not mean the market is going down. It means large moves are expected. Always combine IV analysis with price action and trend analysis for directional bias.
- Ignoring IV when buying options Buying options when IV is high (IVR above 70) is one of the most common and expensive mistakes in options trading. You are paying a premium for volatility that may already be priced in. IV crush after a high-IV event can destroy an options position even when the underlying price moves in your favour.
- Confusing DVOL with a price prediction DVOL rising does not mean Bitcoin is about to crash. It means the options market expects larger moves than usual — which could be up or down. Many traders see DVOL spike and immediately short Bitcoin, which is the wrong conclusion.
- Using a single IV reading without context A raw IV of 70% means nothing without knowing whether that is high or low for Bitcoin. Always contextualise IV using IV Rank or IV Percentile. Use these tools every time.
- Ignoring IV in perpetuals trading Most perpetuals traders never look at IV — and this is a significant blind spot. IV is one of the best signals for when to reduce leverage and widen stops, regardless of whether you trade options. Incorporate DVOL into your daily market check.
Conclusion
Implied volatility is one of the most sophisticated and underused tools available to crypto traders and you do not need to trade options to benefit from it. As a pure signal, IV tells you when the market is fearful or complacent, when options are expensive or cheap, when to reduce leverage or increase caution, and when potential for a large move is building under the surface.
For BingX traders, the practical takeaways are straightforward: monitor DVOL daily as your market sentiment gauge, use IV Rank to contextualise current volatility levels, reduce leverage during high IV periods, and treat persistent IV compression as a warning that the next large move may be approaching, even when the chart looks calm.
The traders who incorporate IV into their decision-making alongside price action, RSI, and volume are working with a more complete picture of market conditions than those who rely on chart patterns alone.
Related Articles
- What Is the Sharpe Ratio in Crypto? How to Use It to Evaluate Your Trading Strategy
- Risk Management in Crypto Trading: 7 Rules Every Trader Must Know
- How to Keep a Trading Journal: A Complete 2026 Guide for Crypto Traders
- What Is a Liquidity Sweep in Crypto Trading?
- Crypto Candlestick Patterns: A Complete Guide for Traders
- What Is Crypto Day Trading? A Beginner's Guide
- Copy Trading on BingX: How to Get Started
FAQs on Using Implied Volatility for Crypto Trading
1. What is implied volatility in crypto?
Implied volatility (IV) is a forward-looking metric that measures the market's expectation of how much a cryptocurrency's price will move over a given period, expressed as an annualised percentage. It is derived from the current prices of options contracts using mathematical models like Black-Scholes. High IV means the market expects large price swings; low IV means the market expects relative calm.
2. What is a good implied volatility (IV) for Bitcoin?
Bitcoin's implied volatility is significantly higher than traditional assets because of its inherent price volatility. Bitcoin's DVOL index has historically ranged from approximately 35% (calm periods) to above 100% (crisis events). An IV of 50–65% is roughly "normal" for Bitcoin in 2025–2026. IV above 80% indicates elevated fear; IV below 40% suggests unusual calm that often precedes a larger move.
3. What is IV Rank in crypto trading?
IV Rank (IVR) measures where current implied volatility sits relative to the 52-week high and low of IV for that asset. A reading of 0 means IV is at its lowest point of the past year; 100 means it is at its highest. An IV Rank above 60 suggests options are expensive (consider selling premium); below 20 suggests options are cheap (consider buying). IV Rank is more useful than raw IV because it contextualises the number relative to the asset's own history.
4. What is IV crush?
IV crush is a sharp drop in implied volatility that occurs after a major anticipated event resolves — such as a Fed decision, Bitcoin halving, or regulatory ruling. Before the event, uncertainty drives IV higher. When the event occurs and uncertainty resolves, IV drops suddenly even if the price moved significantly. IV crush can destroy the value of options bought before an event, because the collapse in IV offsets the gain from the price move.
5. What is the difference between implied volatility and historical volatility?
Implied volatility is forward-looking — it reflects what the market expects to happen, derived from options prices. Historical volatility is backward-looking — it measures the actual standard deviation of past price returns. When IV is significantly higher than HV, options are expensive relative to past reality. When IV is lower than HV, options are relatively cheap. The gap between the two is called the Volatility Risk Premium.
6. What is Bitcoin's DVOL?
DVOL is Deribit's Bitcoin Volatility Index, crypto's equivalent of the VIX fear gauge for stocks. It measures the 30-day implied volatility of Bitcoin options traded on Deribit, expressed as an annualised percentage. A rising DVOL signals growing fear and larger expected price swings; a falling DVOL signals calmer conditions. DVOL is the standard benchmark for Bitcoin IV and is freely available on Deribit.com, The Block, and Laevitas.ch.
7. How does implied volatility affect perpetuals trading on BingX?
While BingX Perpetual Futures do not display IV directly, IV is a critical risk management signal for futures traders. During high IV periods (DVOL above 70, IV Rank above 70), daily price swings increase dramatically — meaning leveraged positions face much higher liquidation risk. BingX perpetuals traders should reduce leverage to 2–3× maximum during high IV environments, widen stop-losses to account for larger swings, and reduce overall position size until volatility normalises.
8. Should I buy or sell options when IV is high?
When IV is high (above 60), options premiums are elevated; this is generally a better environment for selling options and collecting premium, not buying. When IV is low (below 20), options are relatively cheap, making buying more attractive. The core principle: buy low IV, sell high IV, applied to volatility itself, not to the underlying asset's price.
