
Crypto markets move fast, but one pattern keeps showing up across Bitcoin, altcoins, and even low-cap charts: the ABCD pattern. Traders rely on it not because it’s popular, but because it exposes real price-action logic, the three consecutive price swings, the symmetry between the AB and CD legs, and the psychology that drives trend exhaustion or continuation.
When volatility spikes or trends stretch too far, the ABCD structure often forms before indicators react, giving traders an early look at potential reversals or breakout areas. Whether it’s a bullish ABCD signaling a recovery or a bearish ABCD warning of a reversal, the pattern helps identify high-probability entry and exit zones with precision.
In this guide, you’ll see how the ABCD pattern works in crypto, how to draw it correctly, how to trade it, and how to avoid common mistakes while managing risk effectively.
What Is the ABCD Pattern in Crypto Trading?
The ABCD pattern is a straightforward price-action structure used in crypto, forex, and stock markets to spot potential reversals or continuation setups. It comes from the family of harmonic patterns, but unlike more complex designs, it relies on clean geometric movement and Fibonacci alignment, making it easy to identify fast-moving assets like BTC, ETH, and volatile altcoins.
At its core, the pattern reflects how markets move in measured swings. When these swings show symmetry, especially when the final move mirrors the first, it signals that momentum is shifting. That symmetry creates ABCD formation.
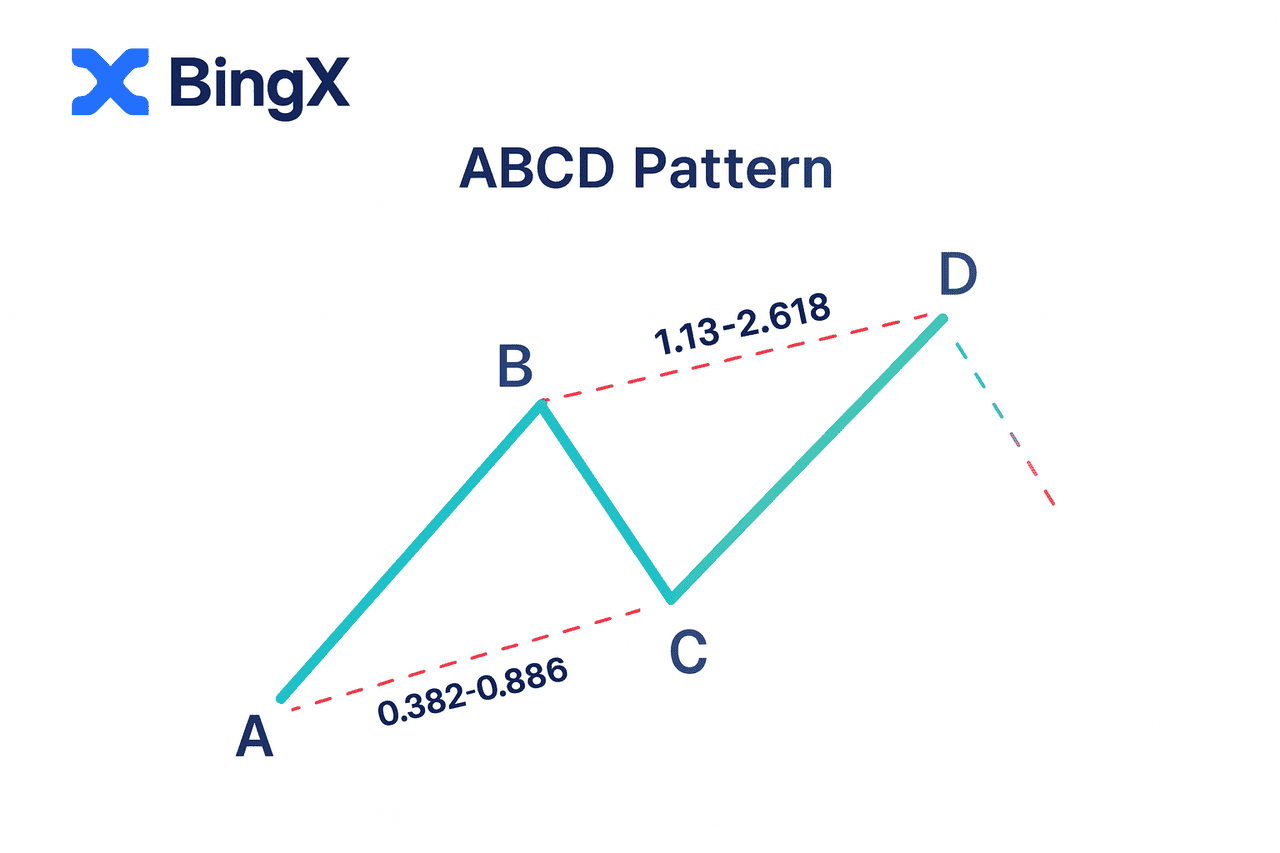
A valid pattern contains four points (A, B, C, D) and three consecutive price swings (AB, BC, CD).
• AB is the initial impulse.
• BC is the corrective pullback, often retracing 38.2%, 50%, or 61.8% of AB.
• CD is the final extension, typically matching the distance of AB and aligning with a 1.0–1.272 Fibonacci extension.
Point D is where the structure completes and the market often reacts sharply, making it the key area traders watch for bullish or bearish opportunities. The pattern works best when AB and CD show similar length and momentum, a sign that price is reaching exhaustion and preparing to turn.
This blend of structure, symmetry, and Fibonacci confluence is what makes the ABCD pattern one of the most reliable tools for crypto traders across all timeframes.
Bullish vs. Bearish ABCD Patterns
Now let's have a look at both bullish and bearish ABCD patterns in a little more detail.
Bullish ABCD Pattern
A bullish ABCD pattern develops after a downtrend or a deep correction and highlights where sellers start to lose control. The structure becomes significant when each leg respects key Fibonacci ratios:
• BC retraces about 61.8% of AB, a common pullback level in a falling market.
• CD extends to around 127.2% of BC, forming a proportional move that mirrors the AB leg.
These measurements help pinpoint Point D, the zone where bearish momentum typically exhausts.
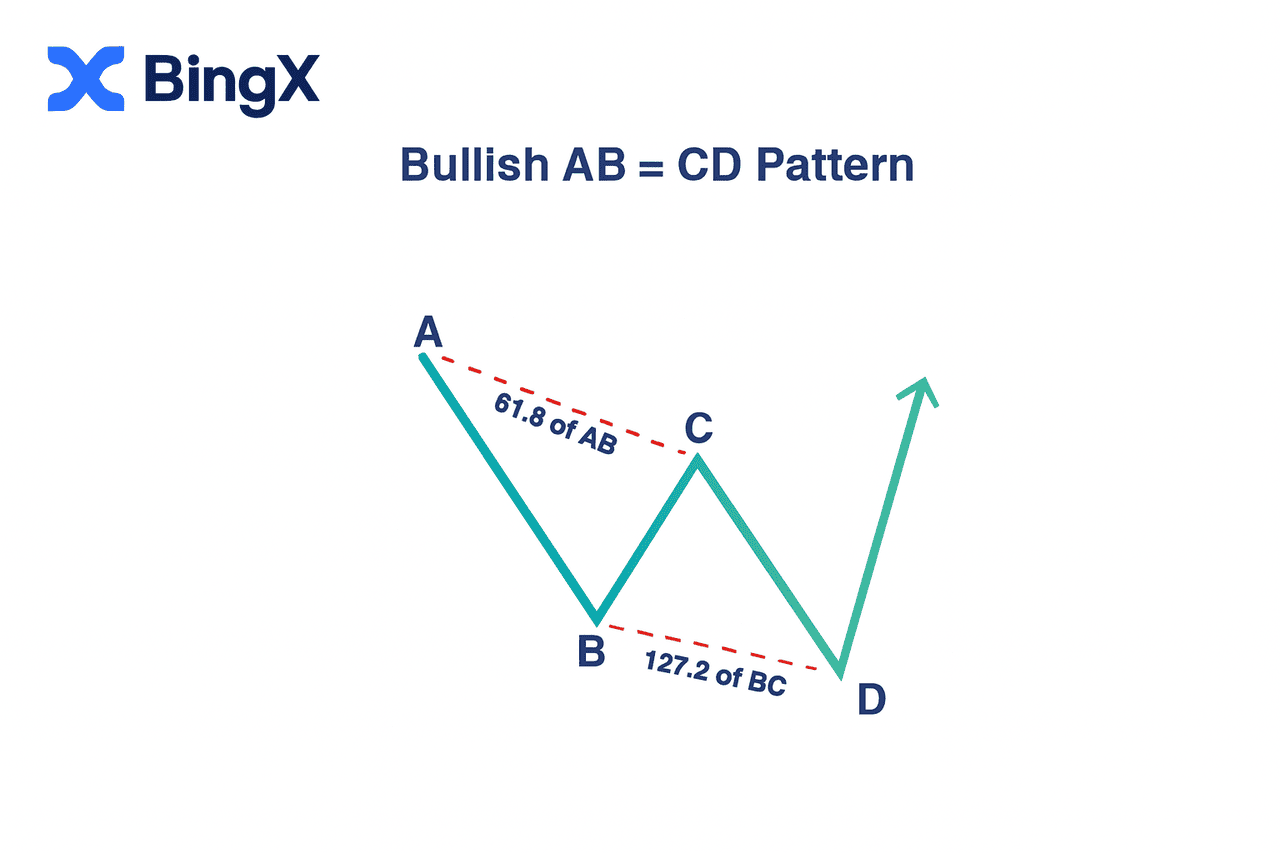
At Point D, the symmetry between AB and CD often signals that selling pressure is fading. Price may also touch a major support zone or align with multiple Fibonacci levels, strengthening the probability of a reversal.
Once price reacts from this area, traders look for: a bullish engulfing candle, higher volume on green candles or a break above a minor resistance or trend line. This makes the bullish ABCD pattern a valuable tool for spotting early reversal opportunities or identifying continuation setups in an emerging uptrend, especially in fast-moving crypto markets.
Bearish ABCD Pattern
A bearish ABCD pattern develops after a strong uptrend, indicating that buyers may be losing momentum. The structure becomes meaningful when each leg follows clear Fibonacci proportions:
• BC retraces roughly 61.8% of AB, which is a typical pullback in a strong bullish phase.
• CD extends to around 127.2% of BC, creating a measured move that mirrors the distance and rhythm of AB.
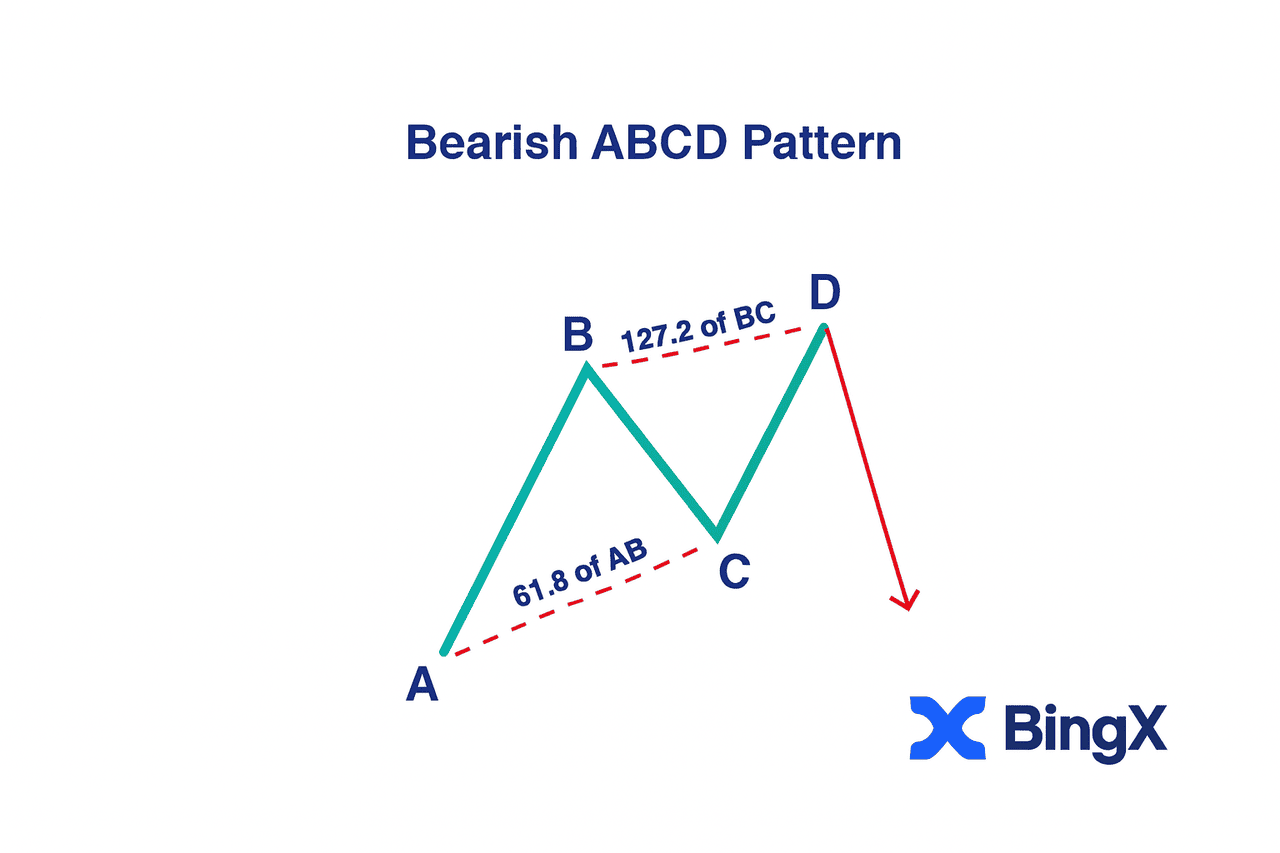
These ratios make Point D a high-probability exhaustion zone. When price hits Point D, the symmetry between AB and CD often signals that the uptrend is overstretched. At this stage, two things commonly appear on the chart:
• Buyer fatigue: smaller candles, weakening volume, or wicks rejecting higher prices
• Early selling pressure: bearish engulfing candles, lower highs, or rising volume on red candles
This is why traders treat the bearish ABCD as a strong potential reversal or corrective pullback setup. Most wait for confirmation, such as a break below a minor support level or a bearish candlestick pattern, before entering short positions.
The pattern gives structure, but the Fibonacci ratios (61.8% Fibonacci retracement, 127.2% Fibonacci extension) help validate it and improve its reliability in volatile crypto markets.
How to Draw the ABCD Pattern Like a Pro Trader
Let’s break down the exact steps to draw the ABCD pattern with accuracy.
Step 1: Identify the Impulse Move (A to B)
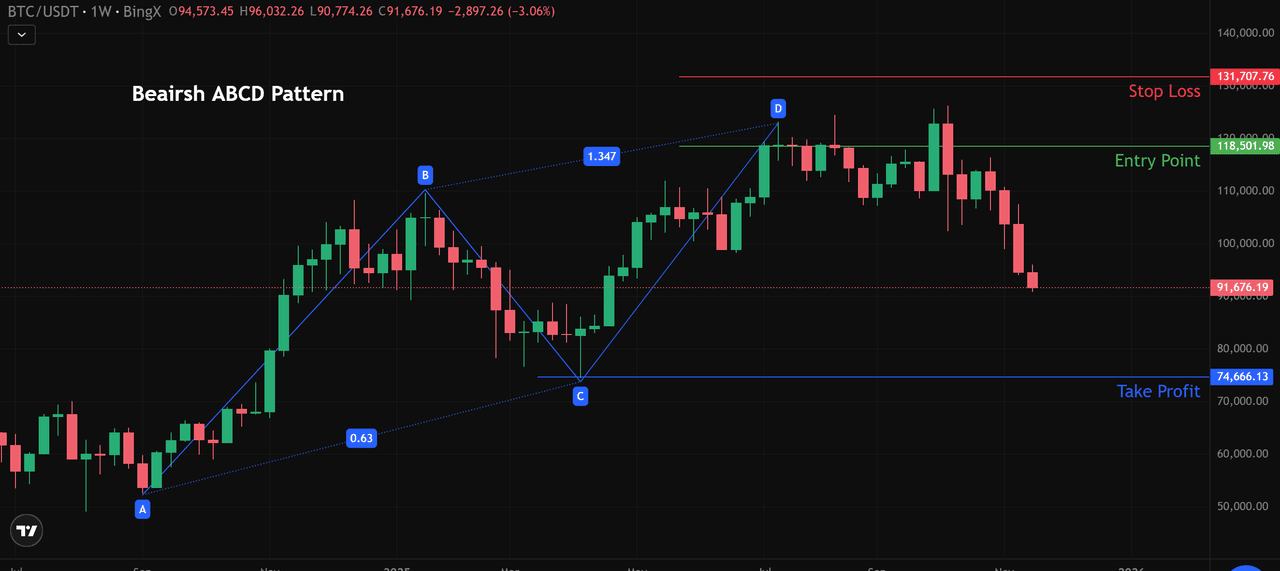
Every ABCD pattern starts with a clear directional swing. On the BTC/USDT weekly chart, this initial AB leg begins near $57,000 (Point A) and climbs sharply to around $106,000 (Point B). The strength and cleanliness of this move show firm buyer control, providing the structural base for the pattern.
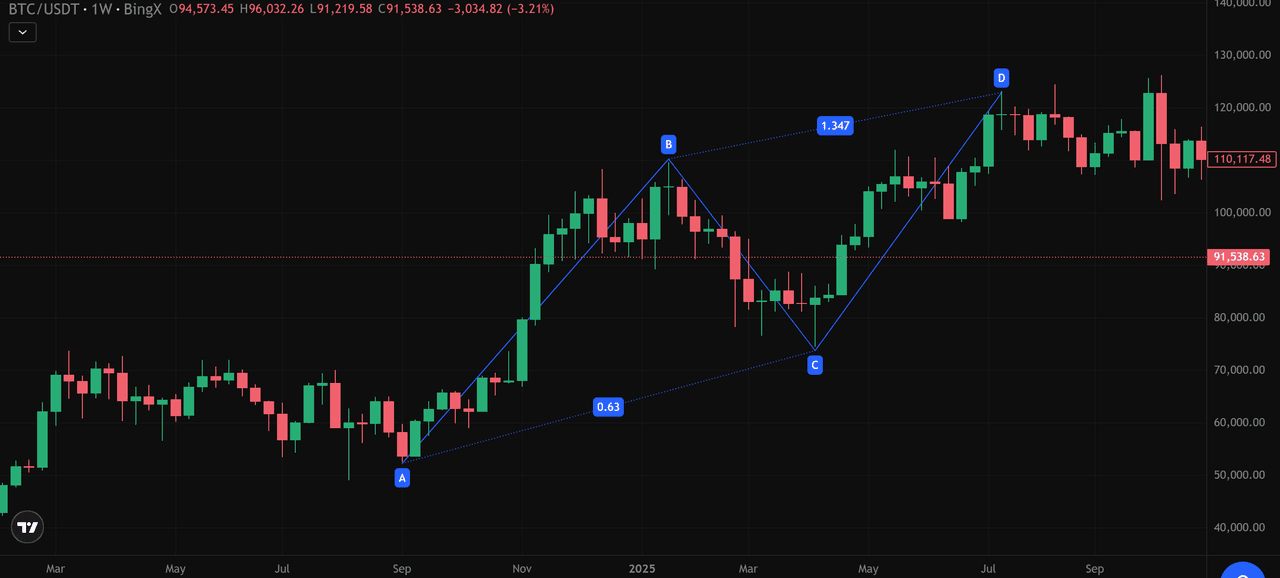
BTC/USDT Weekly Chart - Source: BingX
Step 2: Measure BC Retracement With Fibonacci
From Point B ($106K), Bitcoin retraces to Point C ($73,000). Using the Fibonacci retracement tool, BC aligns almost perfectly with the 0.63 level, which is essentially the 61.8% retracement, a textbook zone for a valid ABCD correction. This confirms a controlled pullback rather than a trend reversal.
Step 3: Project the CD Leg Using Fibonacci Extension
Once BC is confirmed, the next step is projecting the CD leg using Fibonacci extensions. In this example, BTC rallies from $73K to around $130K (Point D), completing a 1.347 extension of BC. Although it is slightly beyond the ideal 1.0–1.272 zone, such extended symmetry is common in volatile crypto conditions.
Step 4: Check Symmetry Between AB and CD
With ABCD patterns, symmetry matters more than perfection.\
In this case:
• AB: $57,000 → $106,000 (+$49,000)
• CD: $73,000 → $130,000 (+$57,000)
Both legs move with similar distance and momentum, confirming the geometric structure. This balance strengthens the significance of Point D as a potential reversal zone.
Step 5: Confirm Point D With Market Structure
A pattern is only complete when the market reacts. Around $130,000, BTC stalls, prints smaller candles, and forms long upper wicks, typical signs of buyer exhaustion. Combined with weekly resistance at $125K–$130K, declining volume, and flattening momentum, these signals confirm Point D as the completion of the pattern and a potential reversal level.
How to Trade Bearish ABCD Patterns
Now that the pattern is identified, here’s how to trade the bearish ABCD setup effectively.
1. Entry Strategy
In a bearish setup, entries are taken around Point D once momentum shifts. In the BTC/USDT example, Point D formed near $130,000, matching a 1.347 extension. Price then rejected this level and broke below short-term support at $118,500, triggering the confirmation for a short entry.
BTC/USDT Weekly Chart - Source: BingX
Traders typically look for: A bearish engulfing candle, rejection wicks at resistance, a break below a trendline or moving average. BTC showed all of these around the $118K zone.
2. Exit Strategy and Profit Targets
Bearish ABCD targets are based on CD retracements and prior swing levels.
• Target 1: 61.8% retracement of CD around $100,000–$103,000
• Target 2: Deeper move toward the prior swing zone to $90,000–$92,000
• Target 3: Full retest of Point C at $74,666, the ultimate ABCD completion target
BTC moved cleanly toward these levels after rejecting $130K.
3. Stop Loss Placement
Stop loss should sit above Point D, which is the invalidation level. For this setup, a stop around $131,700 (as shown on your chart) covers wick spikes while protecting the risk-reward ratio.
How to Trade a Bullish ABCD Pattern
Now that the pattern is identified, here’s how to trade the bullish ABCD setup effectively.
1. Entry Strategy
For a bullish ABCD pattern, the ideal entry comes at Point D, where the final CD leg completes and sellers begin to lose momentum.
On the XRP/USDT 4-hour chart:
• Point A to B forms a strong drop from $2.86 to $2.56.
• BC retraces to $2.69, aligning with the 40%–61.8% Fibonacci pullback.
• CD extends down to $2.74 (Point D), matching a 1.326 Fibonacci extension of the BC leg.
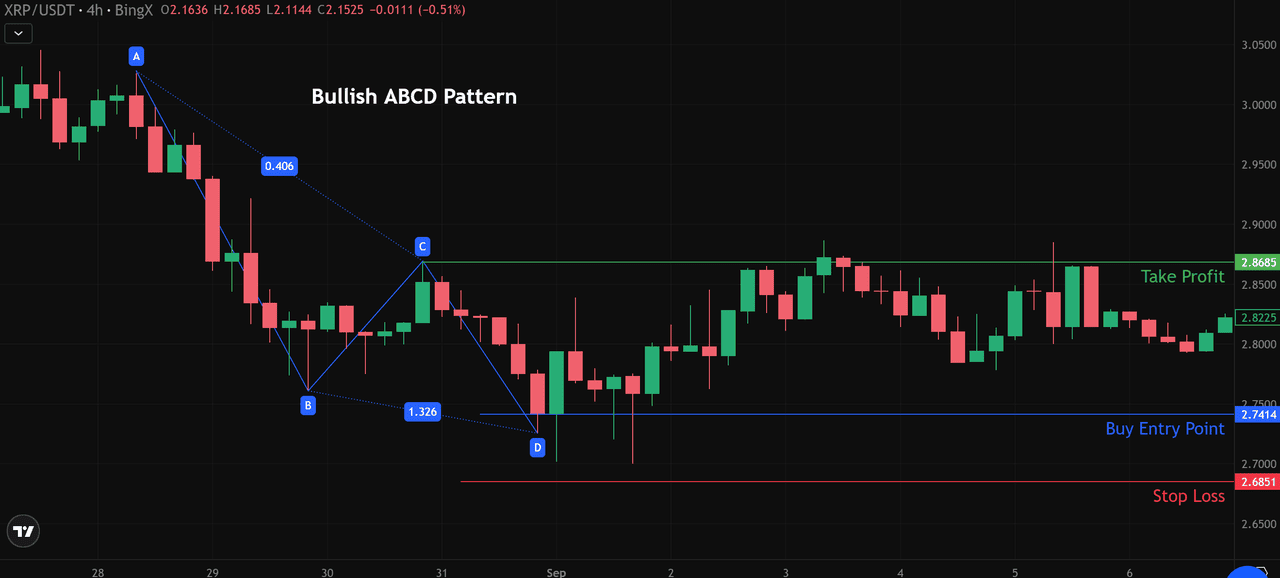
XRP/USDT Price Chart - Source: BingX
At Point D, XRP prints long lower wicks and tight candles, showing that sellers are weakening. The valid entry occurs slightly above D at $2.7414, when price breaks above short-term resistance and confirms a shift in momentum.
2. Exit Strategy and Profit Targets
Bullish ABCD targets follow Fibonacci retracements of CD and previous swing levels.
• Target 1: Move back to the 61.8% retracement of CD to $2.82–$2.84
• Target 2: Return to Point C to $2.86–$2.87 (shown as the “Take Profit” level on the chart)
XRP reaches this upper level with strong bullish candles, confirming the pattern.
3. Stop Loss Placement
Stop loss should always sit below Point D, which marks the invalidation zone.
For this chart:
• Point D: $2.74
• Stop Loss: $2.6851 (as shown), safely below the lows but close enough to preserve risk-reward.
This placement protects against deeper dips while keeping the trade structure intact.
How to Use Fibonacci Tools With the ABCD Pattern
Fibonacci tools help validate whether an ABCD pattern is truly structured. The BC leg should retrace roughly 38.2% to 61.8% of AB, while the CD leg typically extends 1.0 to 1.272 of BC, creating the symmetry the pattern relies on.
When these Fibonacci levels converge near key support or resistance zones, the accuracy of the setup improves significantly.
Checking these measurements on multiple timeframes, using higher timeframes to confirm the swing points and lower timeframes to refine entries, adds further confirmation and reduces the chance of false signals.
How to Manage Risks When Trading the ABCD Pattern
Risk management is essential for trading the ABCD pattern effectively. Use consistent position sizing, typically 0.5%–1% risk per trade, to handle volatility, and avoid entering early at Point C before Fibonacci levels confirm the structure.
Don’t force symmetry when price action is unclear; wait for proper AB, BC, and CD alignment. With clear invalidation levels and disciplined execution, the pattern becomes far more reliable.
Common Mistakes Traders Make When Using ABCD Patterns
Many traders struggle with the ABCD pattern simply because they misidentify the swing points, especially A, B, and C, which distorts the entire structure. Another common issue is forcing a pattern where the market isn’t actually forming one, often ignoring the broader trend in the process.
Entries also tend to come too early, before Point D is fully completed or confirmed.
And finally, relying solely on the pattern without support from volume, candlestick signals, or market structure leads to weak trades. Avoiding these mistakes helps ensure the ABCD setup remains accurate and tradable.
Conclusion
The ABCD pattern gives traders a clear framework for spotting reversals and managing risk with structure rather than guesswork. Its simplicity, Fibonacci alignment, and versatility across crypto, forex, and stocks make it a dependable tool in any market. The key is practice, focus on identifying clean swing points, stay patient for Point D confirmation, and trade only when trend and confluence support the setup.
Start applying the ABCD pattern on live charts, refine your eye for symmetry, and use it to build more disciplined, higher-confidence trade decisions.
Related Reading
FAQs on ABDC Pattern in Trading Crypto
1. What is the ABCD pattern in crypto trading?
The ABCD pattern is a price-action structure based on three consecutive swings, AB, BC, and CD, that helps traders identify potential reversals and continuation setups using symmetry and Fibonacci levels.
2. How do I confirm that an ABCD chart pattern is valid?
A pattern is valid when BC retraces to about 38.2–61.8% of AB, CD extends 1.0–1.272 of BC, and AB and CD show similar distance and momentum. Point D should also align with support or resistance.
3. Is the ABCD trading pattern reliable in volatile crypto markets?
Yes. Crypto volatility often creates clean impulse and correction legs, making the ABCD pattern highly effective, especially when combined with confluence factors like trend, volume, and Fibonacci levels.
4. Where should I enter and exit an ABCD pattern trade?
Entries typically occur at Point D after confirmation (candlestick signals or a breakout). Exits are usually set at 61.8% retracement of CD, a retest of Point C, or a full return to Point B depending on trend strength.
5. What timeframe works best for identifying ABCD patterns?
The pattern appears across all timeframes, but it’s most reliable on the 4H, 1D, and 1W charts. Lower timeframes can also work but may produce more noise and false signals.
