
Candlestick patterns are visual formations on a price chart made up of one or more candlesticks that signal potential price reversals or continuations. Each candlestick represents a specific timeframe and shows the open, high, low, and close price of an asset. Traders use candlestick patterns to read market sentiment, identify entry and exit points, and confirm signals from other indicators like RSI (relative strength index) and MACD (moving average convergence divergence). In crypto trading, candlestick patterns are among the most widely used tools in technical analysis.
In this guide, you will learn how to read candlestick charts, understand each major bullish and bearish candlestick pattern, and apply them to real trades on BingX.
What Are Candlestick Patterns?
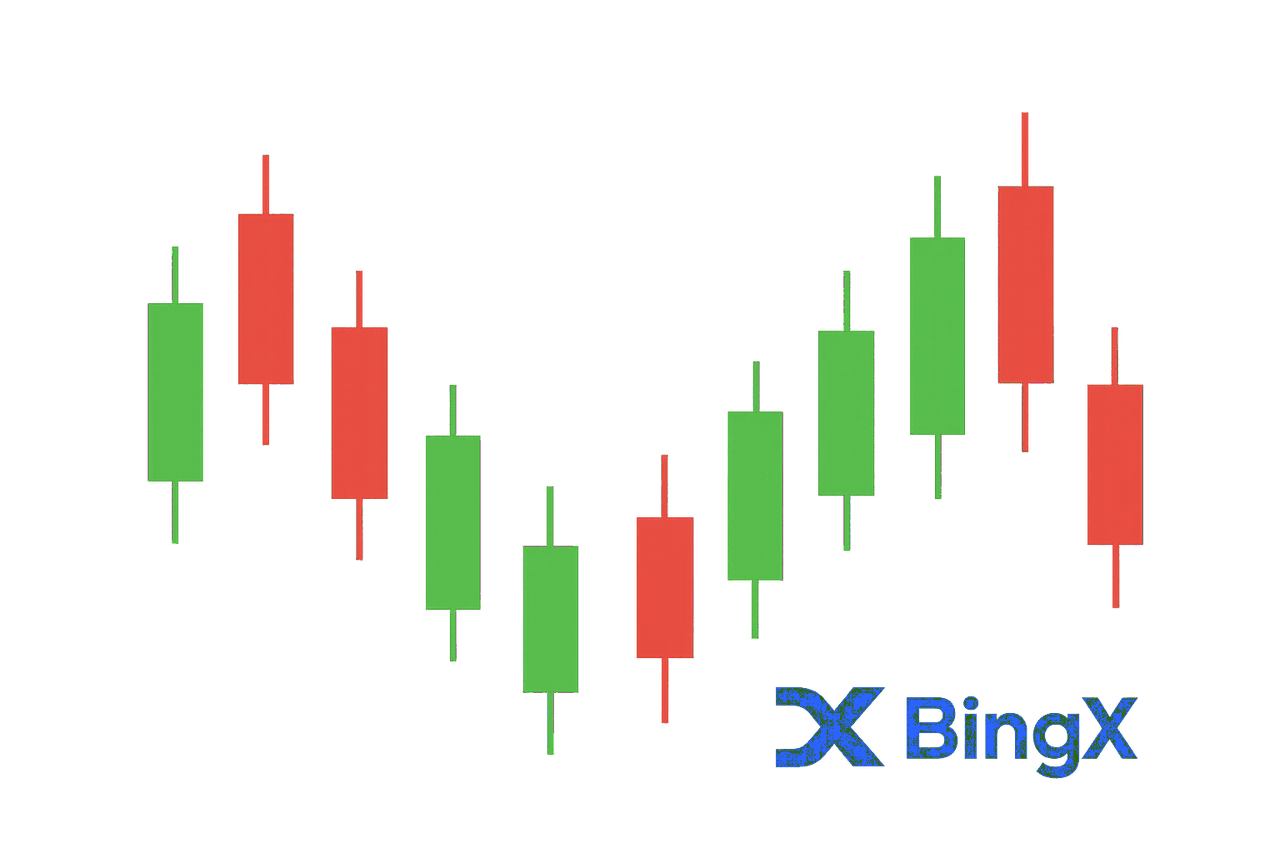
Candlestick charts are graphical representations of price movements over a chosen timeframe, from 1 minute to 1 week. They originated from 18th-century Japanese rice trading and have become the standard charting format for crypto, stocks, and forex traders worldwide.
Each individual candlestick displays four critical price points:
- Open: The price at the start of the timeframe
- Close: The price at the end of the timeframe
- High: The highest price reached during the timeframe
- Low: The lowest price reached during the timeframe
The rectangular "body" shows the range between open and close. The thin lines above and below, called "wicks" or "shadows", show the high and low.
Candlestick Anatomy at a Glance
|
Component |
What It Shows |
|
Body (large, green) |
Strong bullish session — close well above open |
|
Body (large, red) |
Strong bearish session — close well below open |
|
Body (small, any colour) |
Indecision — buyers and sellers roughly equal |
|
Long upper wick |
Buyers pushed price up but sellers rejected the highs |
|
Long lower wick |
Sellers pushed price down but buyers rejected the lows |
|
No wicks (marubozu) |
Extremely strong move in one direction — no opposition |
Bullish vs. Bearish Candlesticks
- Bullish candles (typically green or white) indicate a price increase, where the closing price is higher than the opening price. The bottom of the body represents the opening price, while the top shows the closing price.
- Bearish candles (typically red or black) indicate a price decrease, where the closing price is lower than the opening price. The top of the body represents the opening price, while the bottom shows the closing price
These visual cues allow traders to quickly identify market sentiment and potential reversal points, making candlestick charts invaluable for analyzing previous price movements and formulating trading strategies.
How to Use Candlestick Chart Patterns to Understand Market Sentiment
Candlestick charts function as a visual language that reveals the psychological battle between buyers and sellers in the cryptocurrency market. By analyzing these patterns, traders can decode underlying market sentiment and anticipate potential price movements before they fully develop.
Candlesticks reflect collective market psychology by displaying the relationship between opening and closing prices alongside the price extremes within a period. The body size, wick length, and pattern formation all contribute to understanding whether bullish sentiment, also known as buying pressure, or bearish sentiment, also known as selling pressure, is dominant.
Interpreting Market Dynamics with Candlesticks
- Long bodies indicate strong conviction in a particular direction
- Short bodies suggest indecision or equilibrium between buyers and sellers
- Long upper wicks on bearish candles often signal rejection of higher prices
- Long lower wicks on bullish candles typically indicate buyers stepping in to reject lower prices
- Doji patterns, where opening and closing prices are nearly identical, reveal market indecision and potential reversals
Reading Candle Signals at a Glance
|
What You See |
What It Means |
|
Long green body, small wicks |
Strong buying — bulls in full control |
|
Long red body, small wicks |
Strong selling — bears in full control |
|
Small body, long lower wick |
Buyers rejected lower prices — potential support |
|
Small body, long upper wick |
Sellers rejected higher prices — potential resistance |
|
Very small body (doji) |
Market indecision — watch for confirmation |
|
Three consecutive green candles |
Sustained buying pressure — trend continuation signal |
|
Three consecutive red candles |
Sustained selling pressure — trend continuation signal |
Candlestick formations often precede major trend reversals, giving attentive traders an early warning system. For example, a bullish engulfing pattern appearing after a downtrend suggests buyer momentum is overcoming seller pressure, potentially signaling an upcoming uptrend.
Understanding these market dynamics through candlestick analysis gives crypto traders on BingX a significant advantage. The ability to respond to changing sentiment before price movements becomes evident to the majority of market participants.
Bullish Candlestick Patterns: Complete List
Bullish candlestick patterns appear during downtrends and signal that selling pressure is weakening and buyers may be gaining control. They are most reliable when they form at key support levels and are confirmed by increased volume.
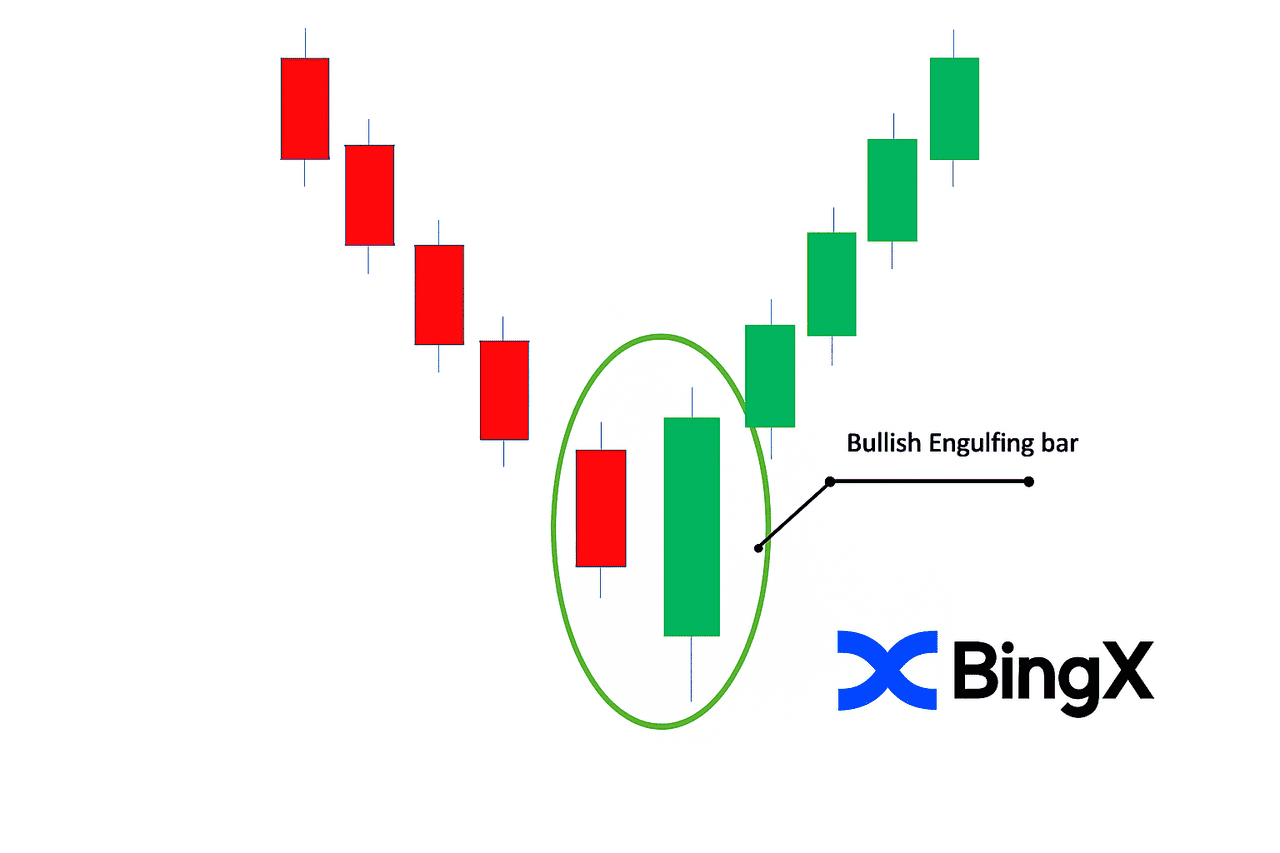
1. Bullish Engulfing Pattern
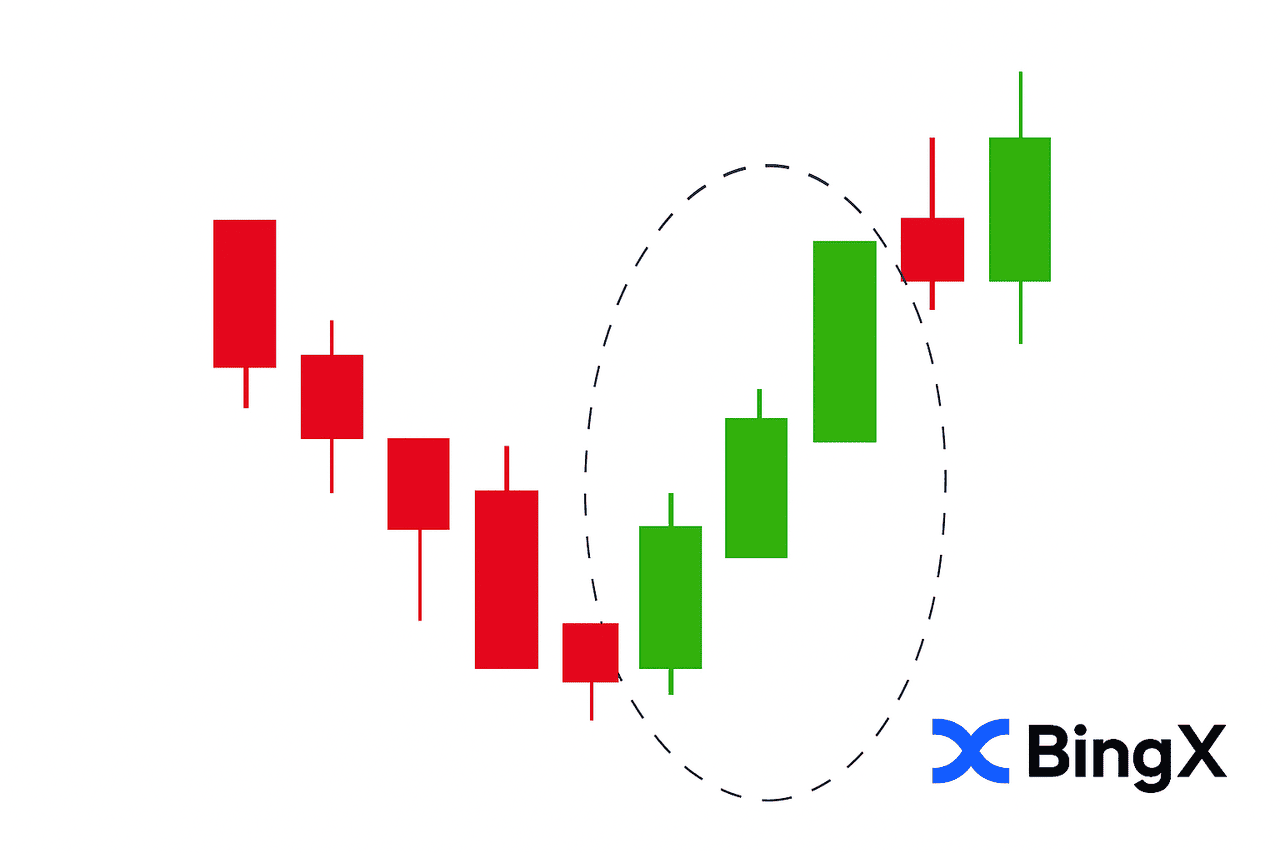
This two-candle pattern forms when a larger bullish candle completely "engulfs" the body of a previous smaller bearish candle. It signals that buyers have overwhelmed sellers, potentially indicating a bullish reversal at the end of a downtrend. The larger the bullish candle, the stronger the reversal signal.
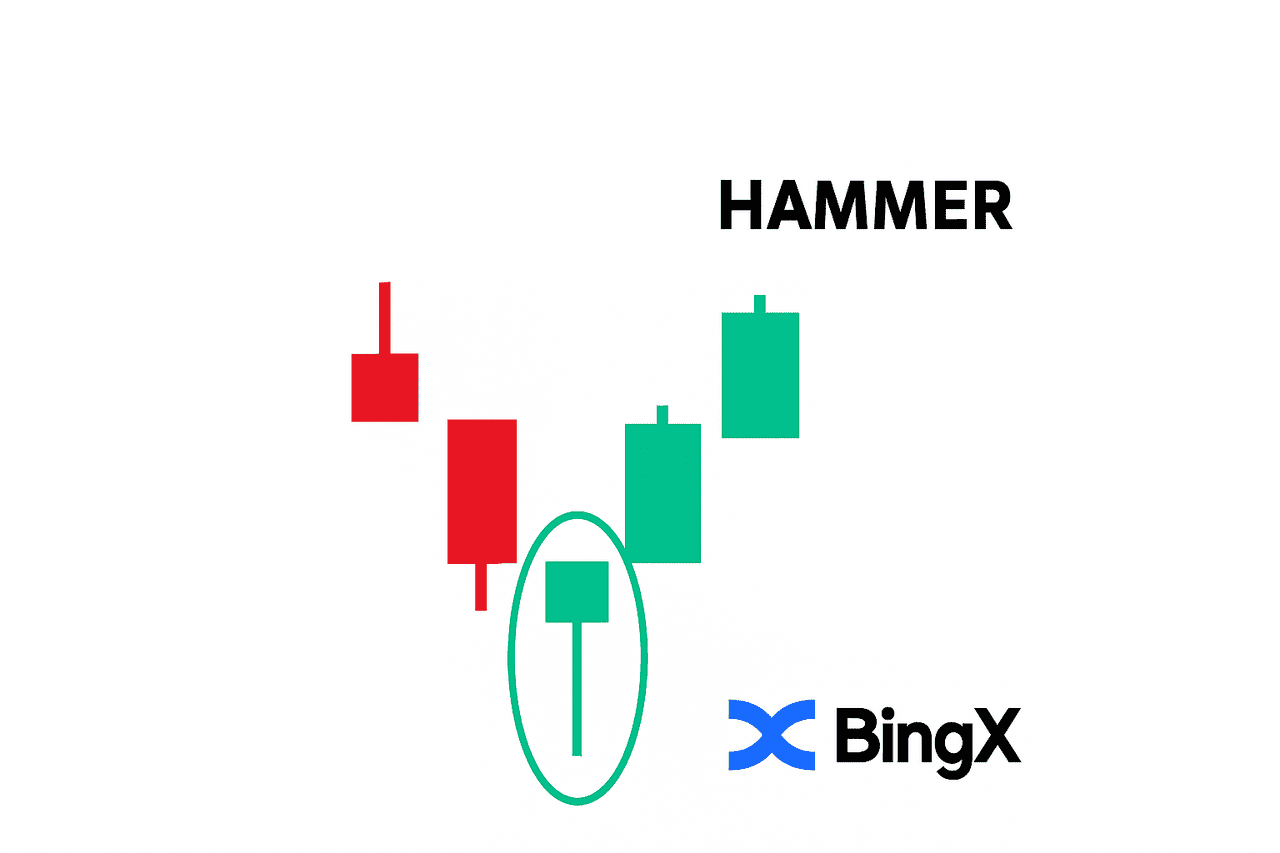
2. Hammer Candlestick Pattern
Resembling a hammer with a small body at the top and a long lower wick at least twice the body's length, this single-candle pattern appears during downtrends. The long lower wick shows sellers initially pushed prices down, but buyers regained control by closing time, a strong indication of buyer interest and potential trend reversal.
Read more: Using the Hammer Candlestick Pattern to Identify Crypto Trend Reversals
3. Inverted Hammer Candlestick Pattern
A single-candle bullish reversal pattern with a small body at the bottom and a long upper wick at least twice the body's length, appearing at the bottom of a downtrend to signal buyers testing higher prices.
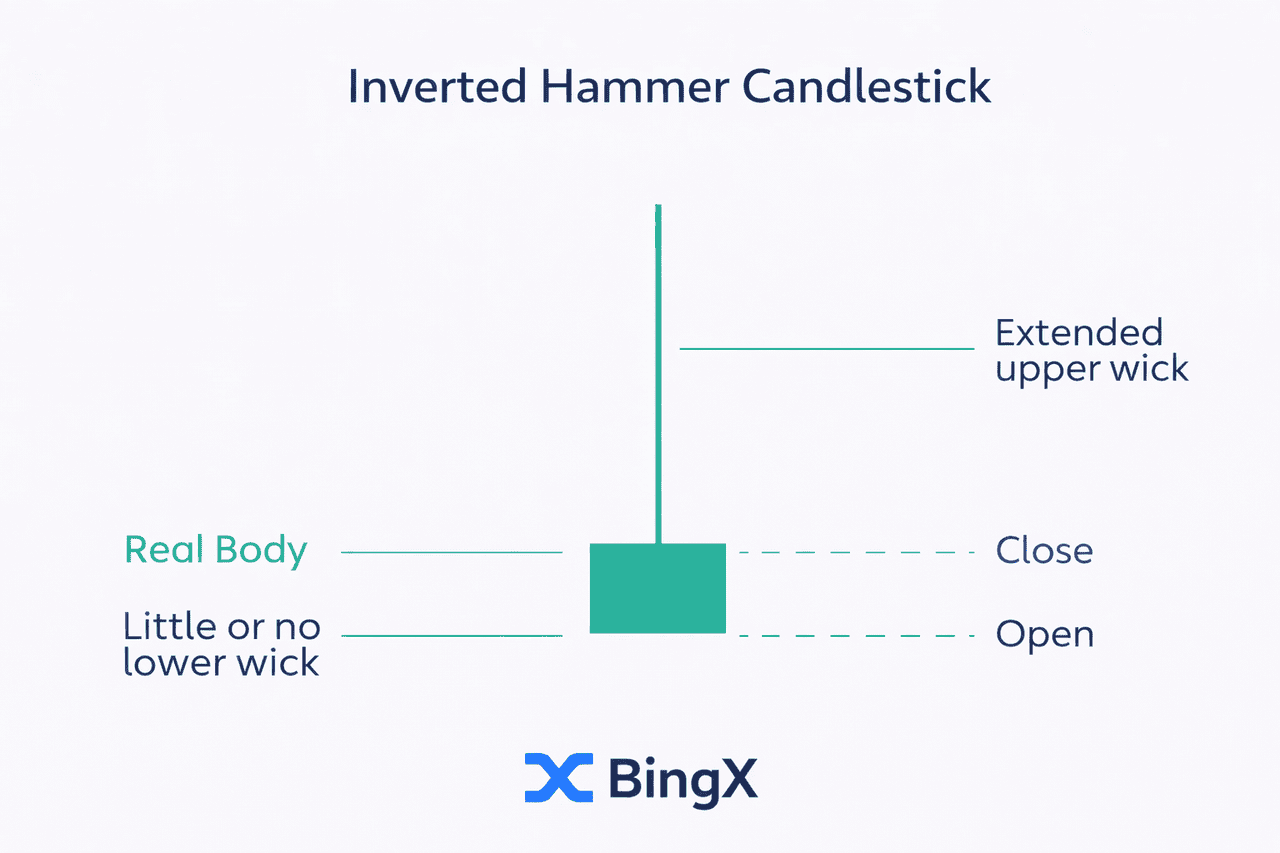
The inverted hammer looks like an upside-down hammer. It signals that buyers pushed prices significantly higher during the session before sellers brought them back down, but the sellers failed to make a new low, suggesting bearish momentum is fading.
Key Features of Inverted Hammer Candlestick Pattern
- Small body at the lower end of the session range
- Long upper shadow, at least 2× the body length
- Little to no lower shadow
- Requires confirmation from the next candle closing higher
Read more: Inverted Hammer Candlestick Pattern: What It Is & How to Trade It
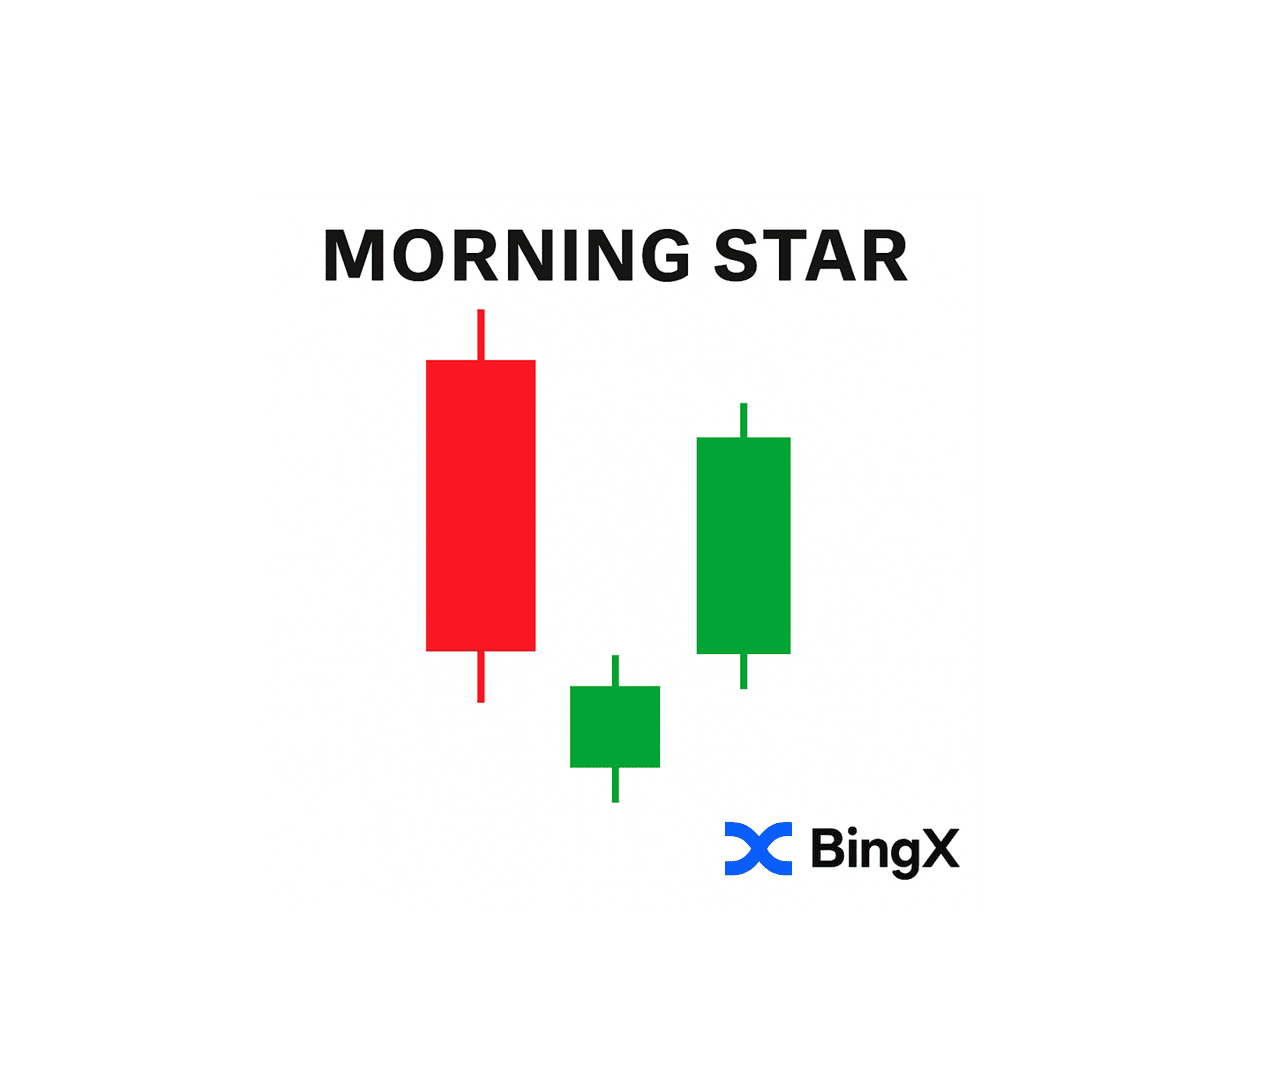
4. Morning Star Candlestick Pattern
This three-candle pattern begins with a large bearish candle, followed by a small bullish or bearish candle with gaps in either direction (the "star"), and completes with a strong bullish candle closing at least halfway up the first bearish candle. It represents market uncertainty followed by confirmed bullish sentiment.
Read more: Morning Star vs Evening Star Patterns in Crypto
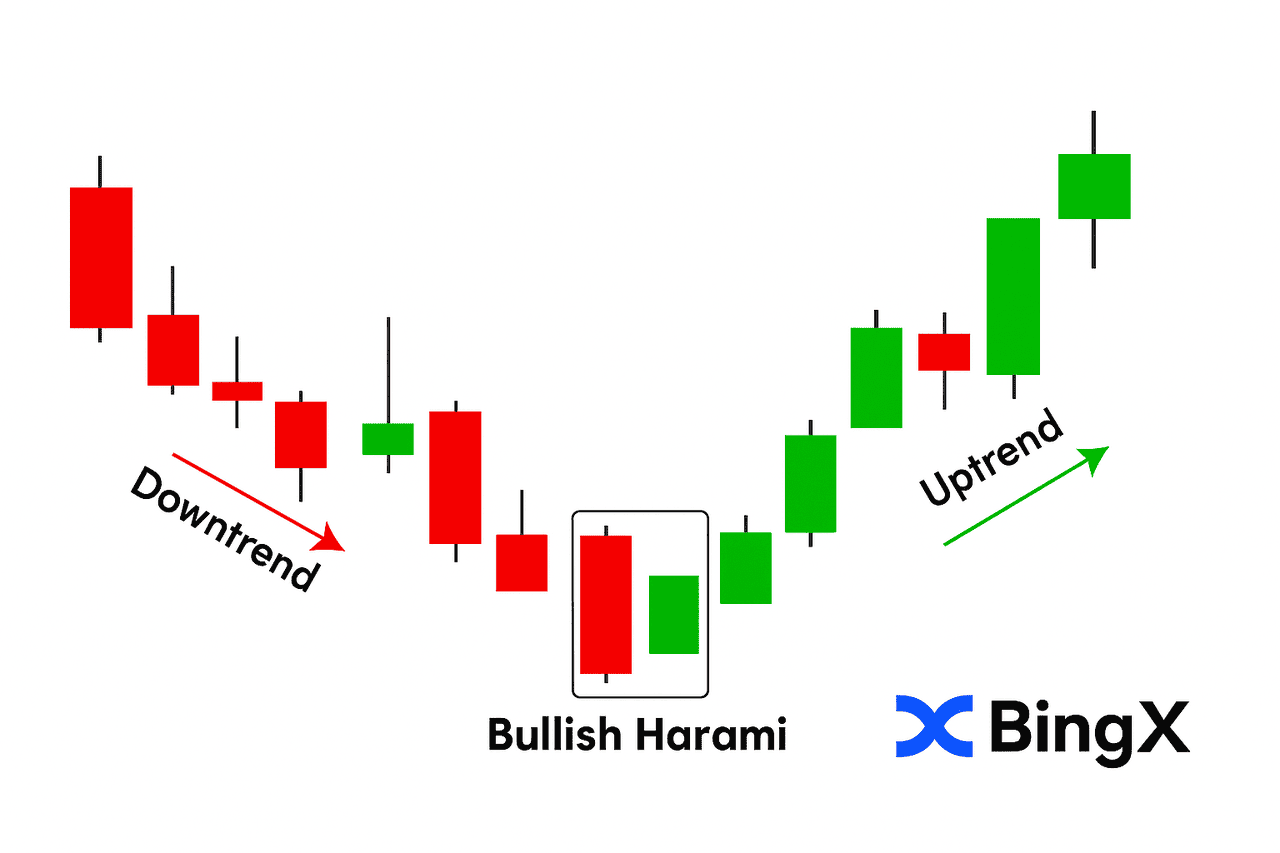
5. Bullish Harami Pattern
This two-candle pattern features a small bullish candle forming completely within the body of a preceding larger bearish candle. It suggests the downward momentum is weakening as buyers begin gaining control, potentially signaling a bullish reversal.
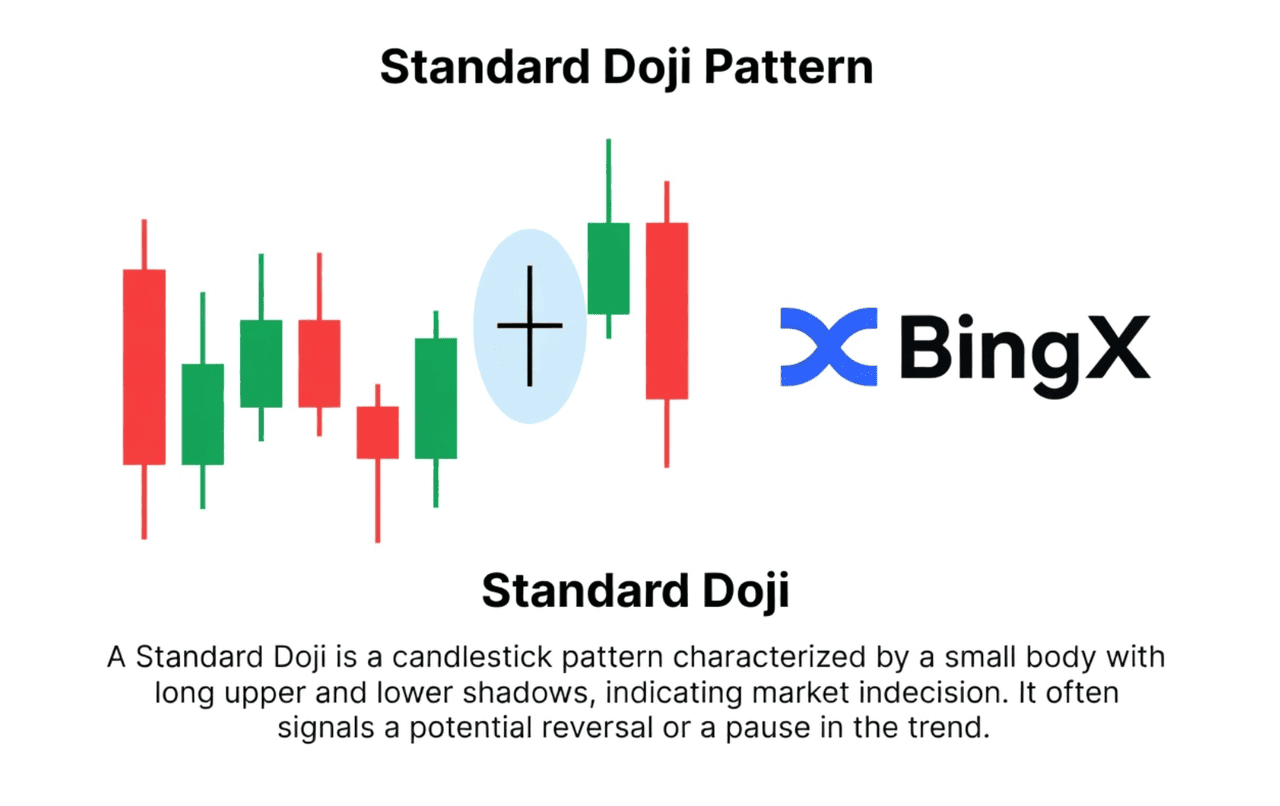
6. Doji Candlestick Pattern
A single-candle indecision pattern where the open and close price are nearly identical, producing a very small or non-existent body, signalling a standoff between buyers and sellers that often precedes a reversal.
A doji alone is not a buy or sell signal, it is a warning that the current trend may be running out of momentum. Its significance depends entirely on context: a doji appearing after a long downtrend is far more meaningful than one appearing in the middle of sideways action.
Three Types of Doji Candlestick Patterns
|
Type |
Shape |
Signal |
|
Standard doji |
Thin body, wicks on both sides |
Pure indecision |
|
Gravestone doji |
Long upper wick, no lower wick |
Bearish reversal signal at tops |
|
Dragonfly doji |
Long lower wick, no upper wick |
Bullish reversal signal at bottoms |

How to trade a doji: Wait for the candle after the doji to confirm direction. A bullish candle following a doji in a downtrend = potential long entry. A bearish candle following a doji in an uptrend = potential short entry.
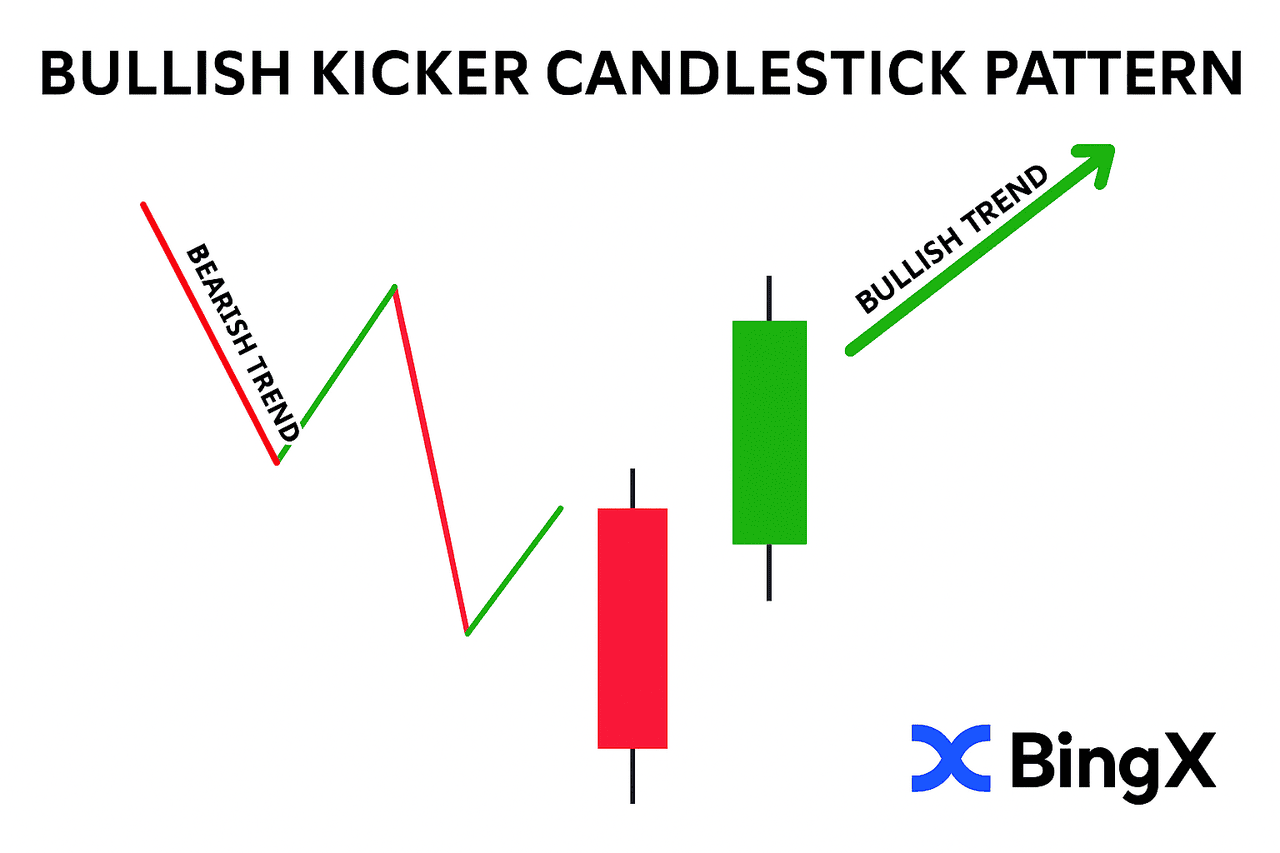
7. Bullish Kicker Pattern
One of the strongest reversal signals, this two-candle pattern occurs when markets open significantly higher after a bearish candle, creating a visible gap between the two candles. It demonstrates a dramatic shift in market sentiment from bearish to bullish.
8. Three White Soldiers
This powerful pattern consists of three consecutive bullish candles, each opening within the previous candle's body and closing higher than the previous candle. Each candle should have small or no upper wicks, showing sustained buying pressure and strong bullish momentum.
These patterns are most reliable when they appear at support levels or after extended downtrends. On BingX, traders can maximize effectiveness by confirming signals with trading volume and other technical indicators before entering positions.
Bullish Candlestick Patterns: Quick Reference Guide
|
Pattern |
Candles |
Signal |
Reliability |
|
Bullish engulfing |
2 |
Reversal |
High |
|
Hammer |
1 |
Reversal |
High |
|
Inverted hammer |
1 |
Reversal |
Medium–High |
|
Morning star |
3 |
Reversal |
High |
|
Doji (dragonfly) |
1 |
Reversal (context-dependent) |
Medium |
|
Bullish harami |
2 |
Reversal |
Medium |
|
Bullish kicker |
2 |
Reversal |
Very High |
|
Three white soldiers |
3 |
Continuation |
High |
Bearish Candlestick Patterns: Complete List
Bearish candlestick patterns appear during uptrends and signal that buying pressure is weakening and sellers may be gaining control. They are most reliable when they form at key resistance levels and are confirmed by increased volume.
1. Bearish Engulfing Pattern
This powerful two-candle reversal signal occurs when a larger bearish candle completely engulfs the previous bullish candle's body. When this pattern forms during an uptrend, it indicates sellers have overwhelmed buyers, suggesting momentum is shifting downward.
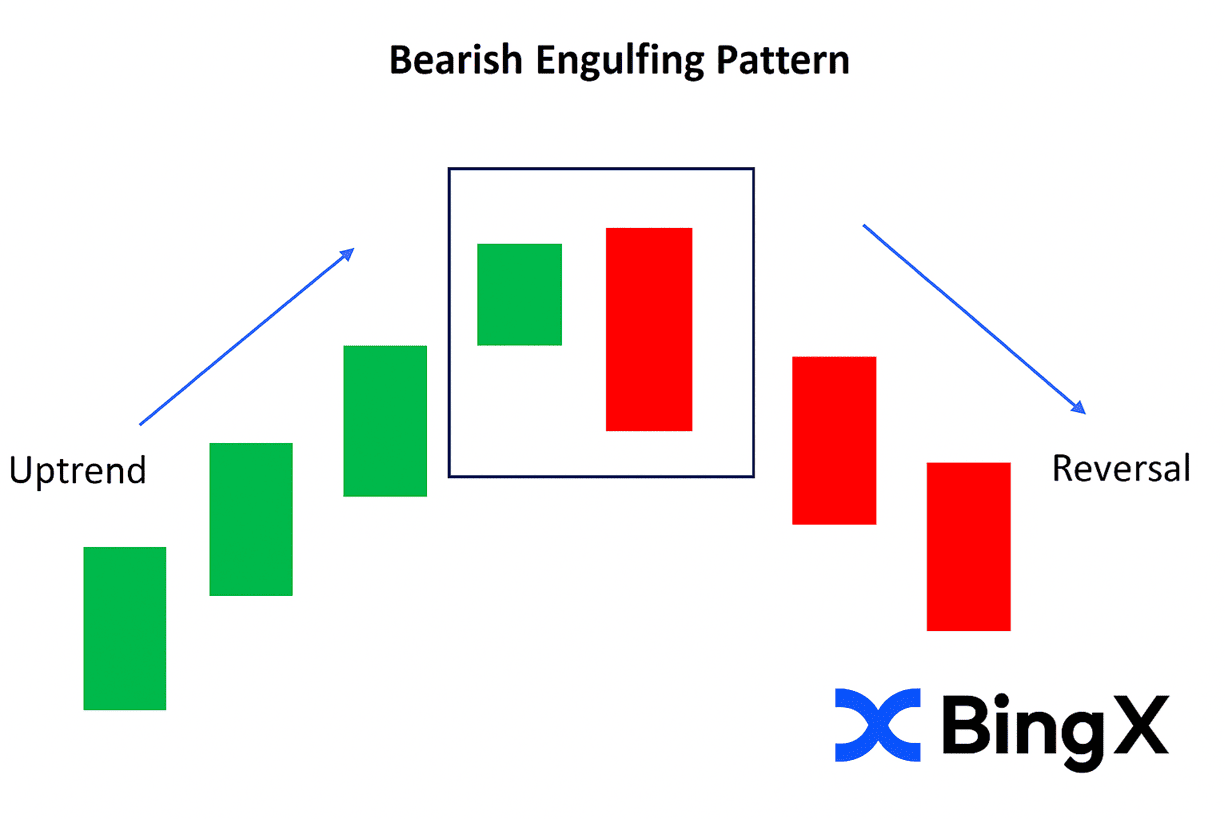
The larger the bearish candle relative to the preceding bullish one, the stronger the reversal signal.
2. Evening Star Candlestick Pattern
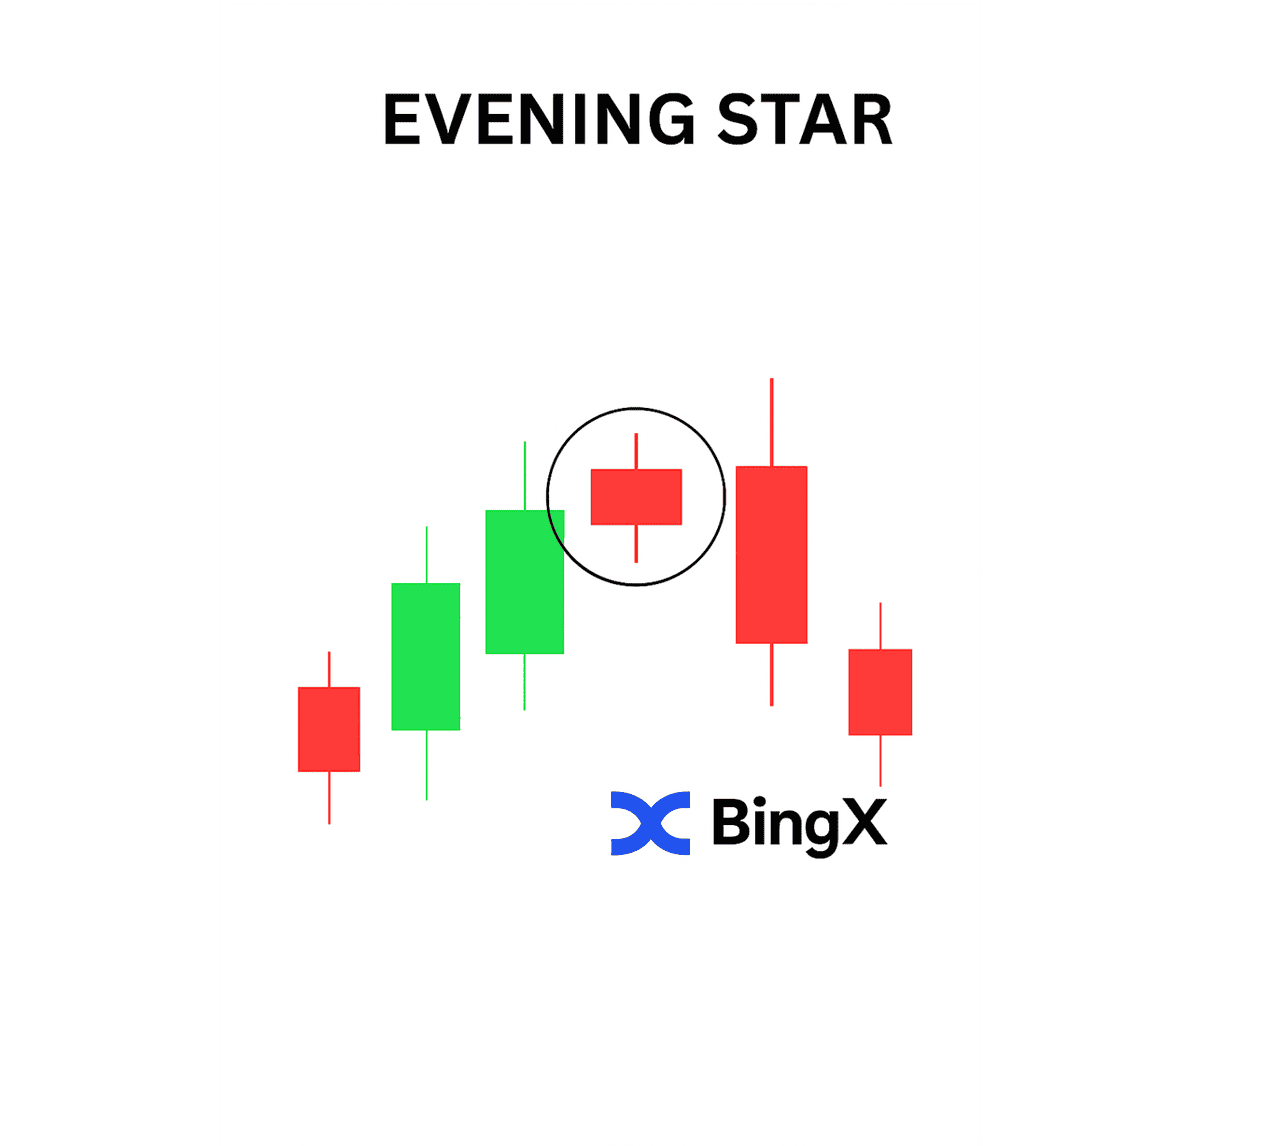
This three-candle formation begins with a strong bullish candle, followed by a small-bodied candle (the "star") that gaps up, and concludes with a bearish candle closing deep into the first candle's body. Appearing at market tops, it represents initial bullish sentiment, followed by uncertainty, and then confirmed bearish pressure, a reliable sign of a trend reversal.
Read more: Morning Star vs Evening Star Patterns in Crypto
3. Shooting Star Pattern
A single-candle bearish reversal pattern with a small body near the bottom and a long upper wick at least twice the body's length, appearing at the top of an uptrend to signal buyers being rejected at higher prices.

Read more: How to Trade the Shooting Star Candlestick Pattern in Crypto
4. Bearish Harami Pattern
This pattern features a small bearish candle forming completely within the body of a preceding larger bullish candle. It signals diminishing bullish momentum as bears begin gaining control, potentially indicating an upcoming reversal.
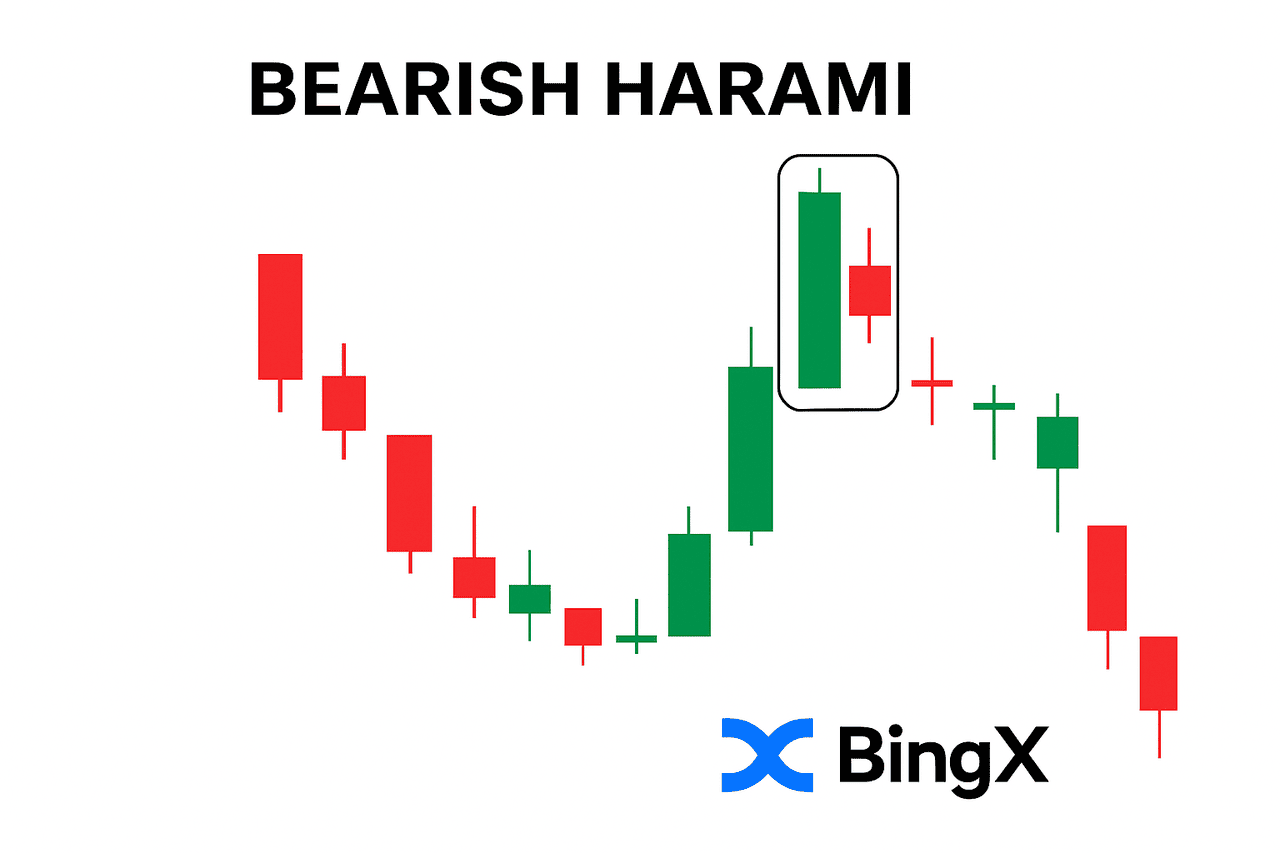
The name "harami" means "pregnant" in Japanese, referencing how the smaller candle appears contained within the larger one.
5. Dark Cloud Cover Pattern
The Dark Cloud Cover is a bearish reversal candlestick pattern that appears after an uptrend and signals a potential shift in momentum from buyers to sellers.
It consists of two candles:
1. The first candle is bullish (green), showing strong buying pressure.
2. The second candle is bearish (red), but with two key traits:
• It opens above the previous candle’s closing price (a sign of early optimism).
• It then closes below the midpoint of the previous bullish candle’s body.
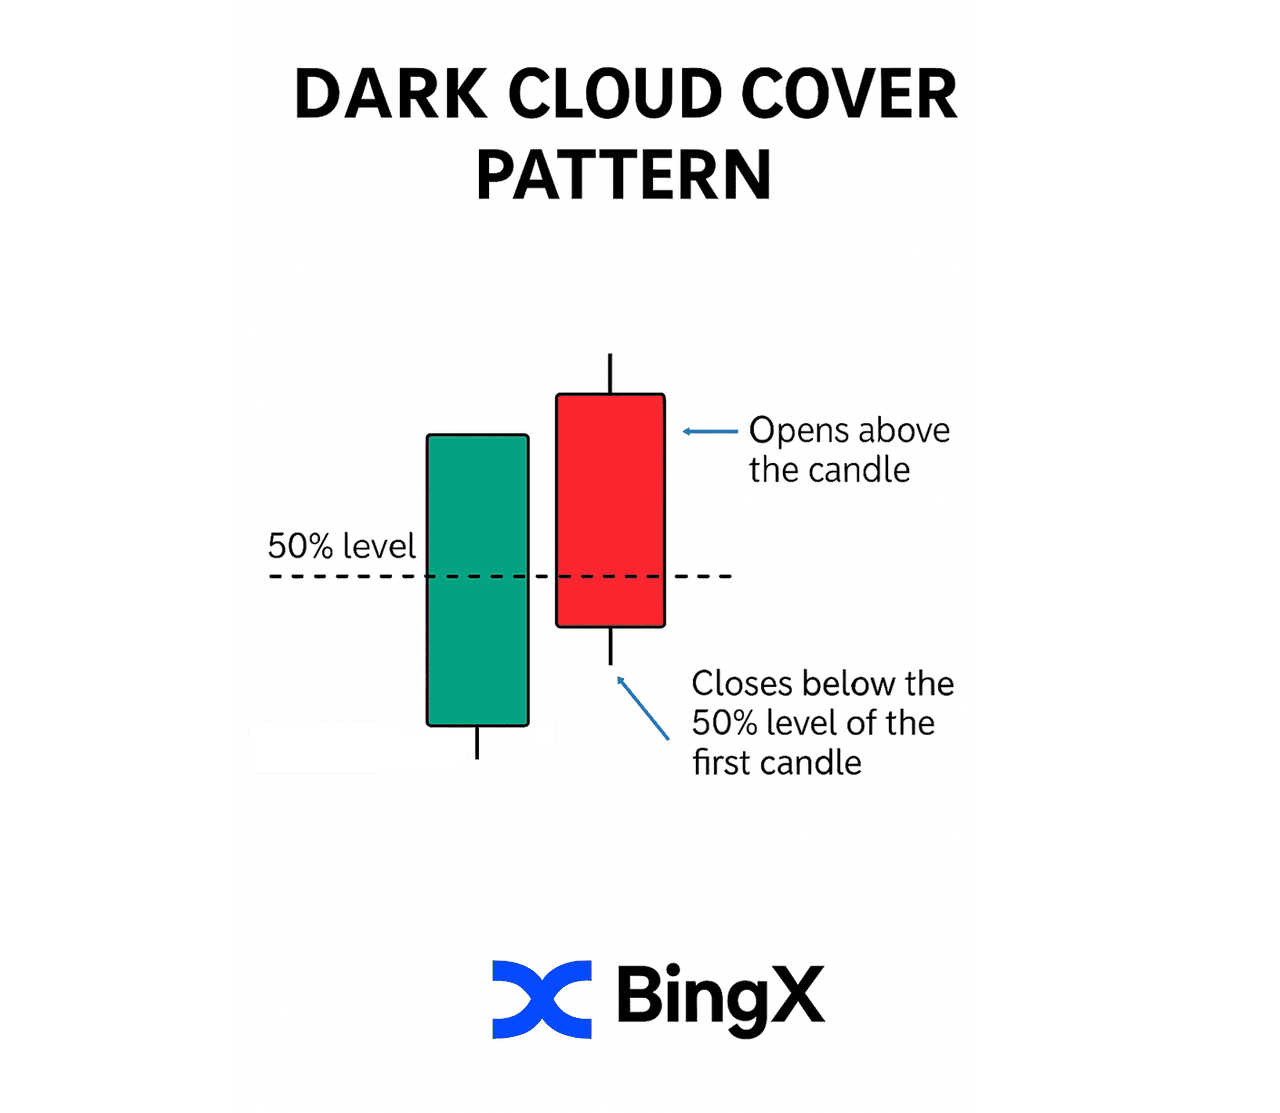
This setup shows that sellers have regained control after an initial attempt by buyers to continue the upward trend. The fact that the second candle closes deep into the prior green candle's territory, specifically below the 50% level, is a strong signal of weakening bullish momentum and possible trend reversal.
6. Shooting Star Pattern
The Shooting Star is a single-candle bearish reversal pattern that often appears at the top of an uptrend. It signals that the upward momentum may be weakening and that a potential bearish reversal is on the horizon.
Here’s how to recognize it:
- The candle has a small body near the bottom of the range.
- It features a long upper wick, at least twice the length of the body.
- The candle closes near or below the opening price, despite initially spiking higher.
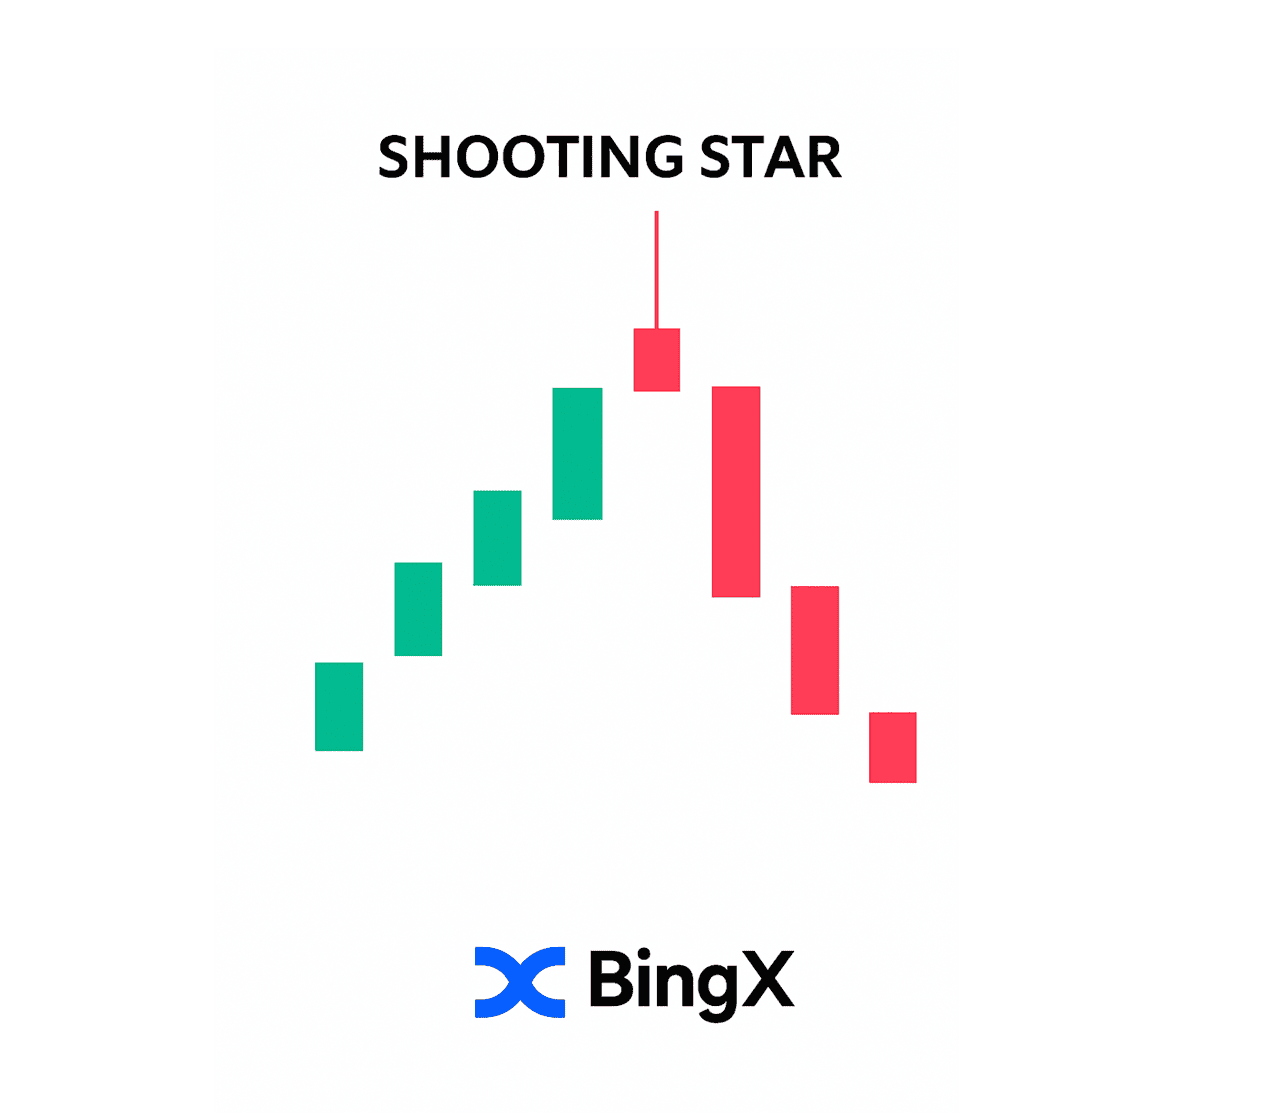
This pattern tells a story of buyer exhaustion: Bulls tried to push prices higher, but sellers stepped in aggressively, pushing the price back down before the candle closed. This shift from buying strength to selling pressure is a strong signal of bearish sentiment.
7. Hanging Man
The Hanging Man looks very similar to the Hammer, but context is everything. While the Hammer signals a bullish reversal at the bottom of a downtrend, the Hanging Man forms at the top of an uptrend, warning that buying pressure may be fading.
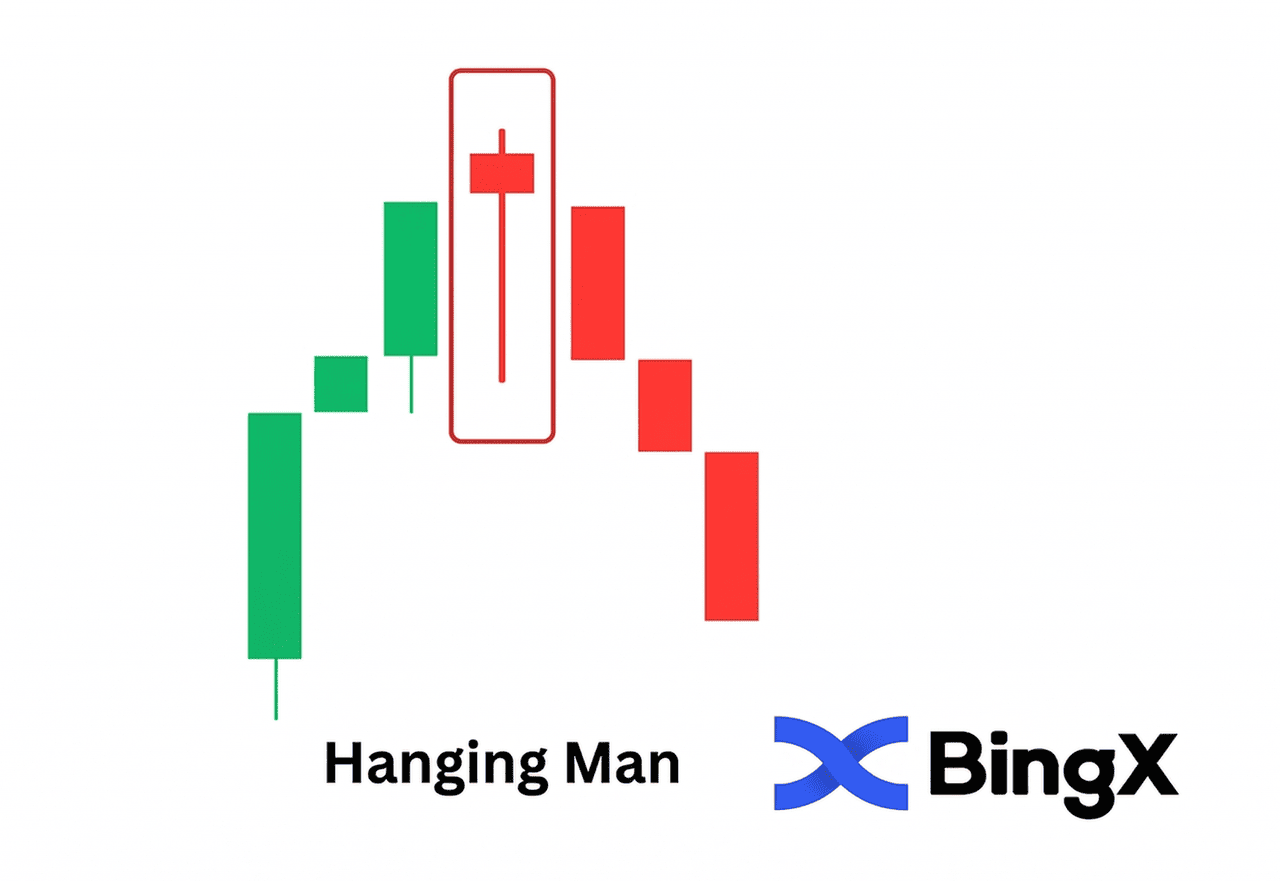
It has:
- A small real body at the top
- A long lower wick (at least twice the body length)
- Little or no upper wick
This shows that sellers entered the market aggressively, but buyers managed to close near the open. The imbalance suggests growing bearish sentiment, especially if followed by a red candle.
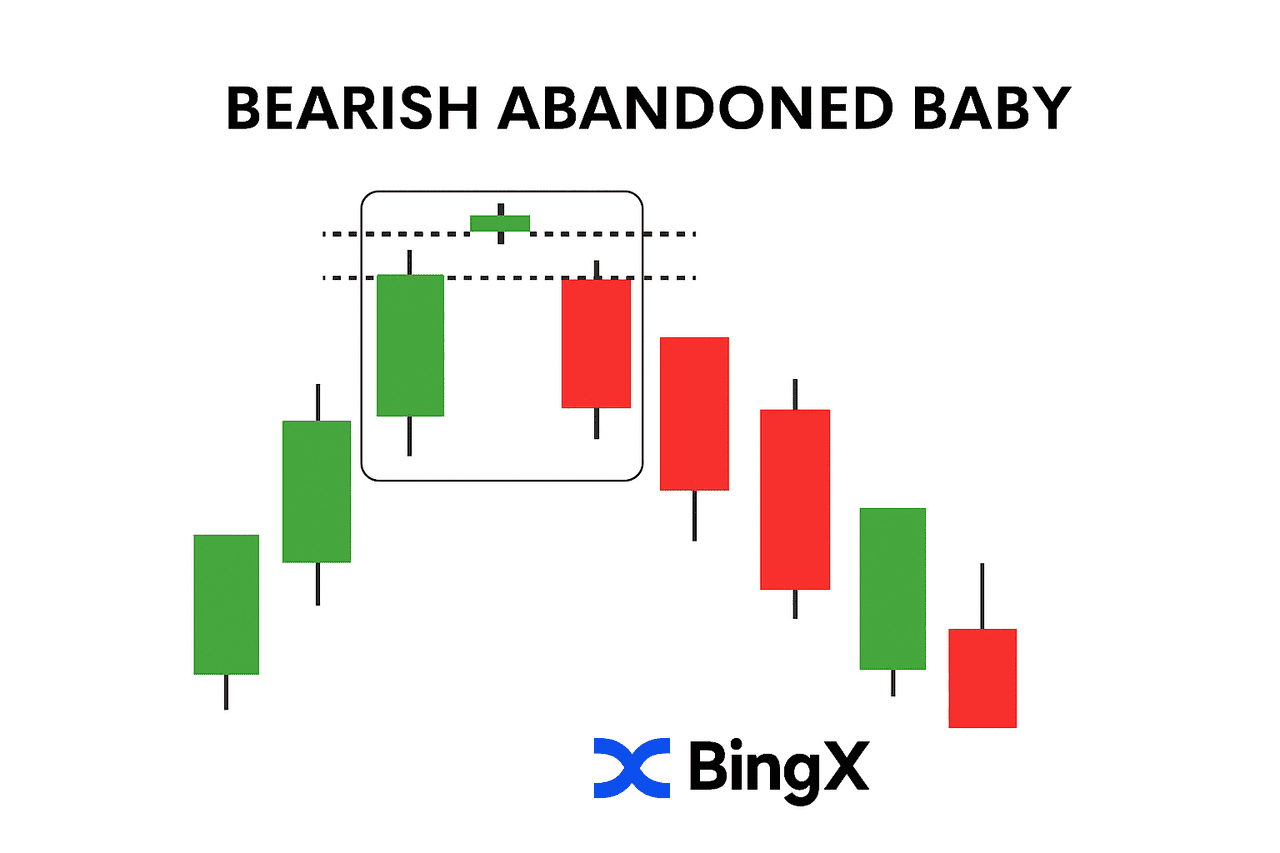
8. Bearish Abandoned Baby
This rare but strong three-candle reversal pattern includes:
- A large bullish candle
- A small doji that gaps above the prior close
- A strong bearish candle that gaps below the doji
The gap on both sides of the doji represents a complete loss of bullish momentum, as if the market “abandoned” the rally. When this forms near a resistance zone or after a sustained rally, it can signal a sharp trend reversal.
Both patterns are valuable warning signs for BingX traders, especially at key resistance levels. Spotting them early can help in timing exits or preparing short positions.
Bearish Candlestick Patterns: Quick Reference
|
Pattern |
Candles |
Signal |
Reliability |
|
Bearish engulfing |
2 |
Reversal |
High |
|
Evening star |
3 |
Reversal |
High |
|
Shooting star |
1 |
Reversal |
Medium–High |
|
Bearish harami |
2 |
Reversal |
Medium |
|
Dark cloud cover |
2 |
Reversal |
Medium–High |
|
Hanging man |
1 |
Reversal |
Medium |
|
Bearish abandoned baby |
3 |
Reversal |
Very High (rare) |
Reversal vs. Continuation Candlestick Patterns
Understanding whether a pattern signals a reversal or a continuation of the current trend is the most important skill in candlestick analysis.
What Are Reversal Patterns: Signaling Change in Direction
Bullish Reversal Patterns
Bullish reversal patterns often appear during downtrends, signaling that the bearish momentum is weakening and a potential upward move could be on the horizon. When these patterns align with support levels, they become powerful entry signals for crypto traders, especially on platforms like BingX.
In the chart above, we can see two key bullish reversal setups:
- Bullish Engulfing Pattern: This forms when a large green (bullish) candle fully engulfs the body of the previous red (bearish) candle. It shows a strong shift in sentiment, where buyers overpower sellers. This pattern often kickstarts a new uptrend after a prolonged decline.
- Hammer Pattern at Support: Appearing after a downtrend, the hammer has a small body and a long lower wick, showing that sellers drove the price lower, but buyers regained control before the close. When this forms at a clear support level, it signals potential for a bullish reversal.
These patterns are essential tools for traders looking to enter at the bottom of a trend, maximizing reward while minimizing risk.
What Are Bearish Reversal Patterns?
Bearish reversal patterns appear at the top of an uptrend and signal a potential shift in momentum from buyers to sellers. These formations are most reliable when they occur near resistance zones, helping traders anticipate a possible downturn.
From the charts provided, here are two clear examples:
Bearish Engulfing Pattern After a Prolonged Rally
In the first chart, a strong green candle is immediately followed by a larger red candle that completely engulfs the previous candle’s body. This bearish engulfing pattern suggests a decisive rejection of higher prices and often signals the start of a short-term correction or trend reversal. Traders frequently use this setup to reduce long exposure or initiate short trades.
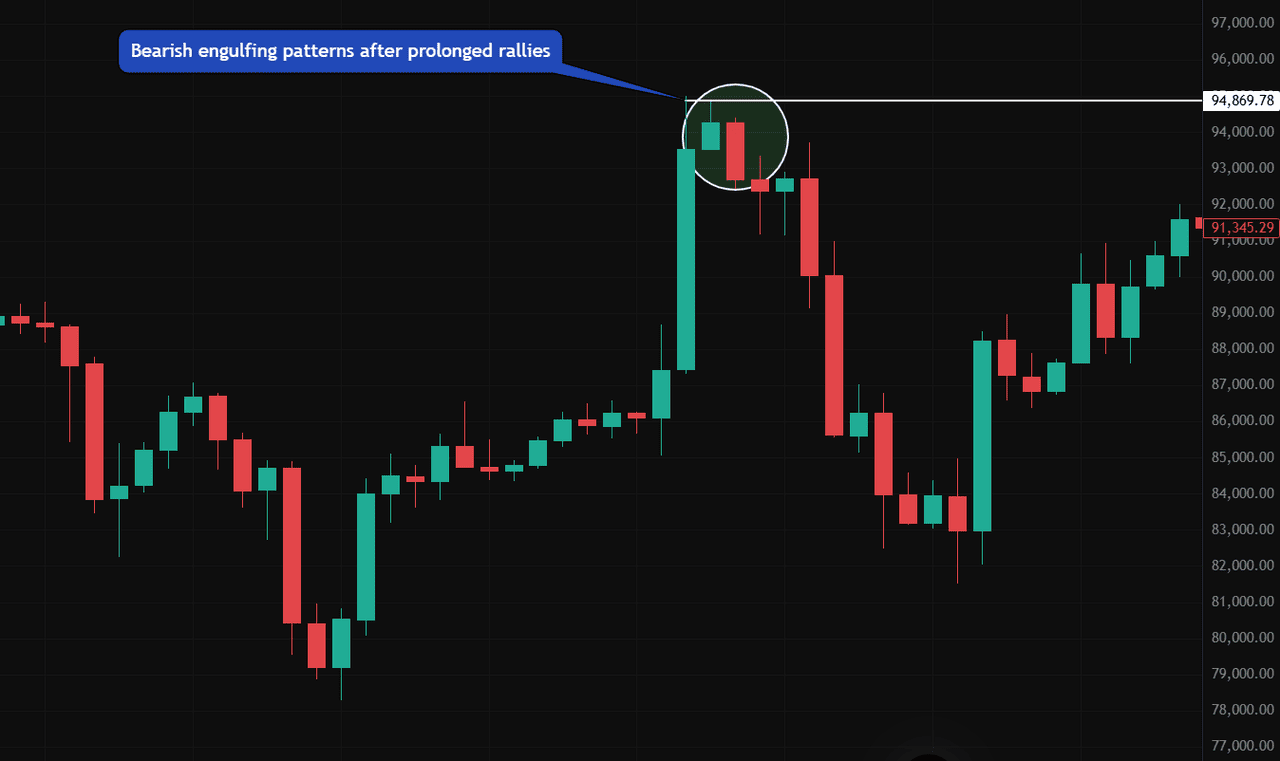
Source: BTC/USDT Trading Chart on BingX
Three Black Crows Formation
In the second chart, three consecutive red candles form after a local peak. Each candle opens within the previous one’s real body and closes lower, reflecting increasing selling pressure. This classic three black crows pattern indicates that bullish momentum has been exhausted and a bearish trend is likely to develop.
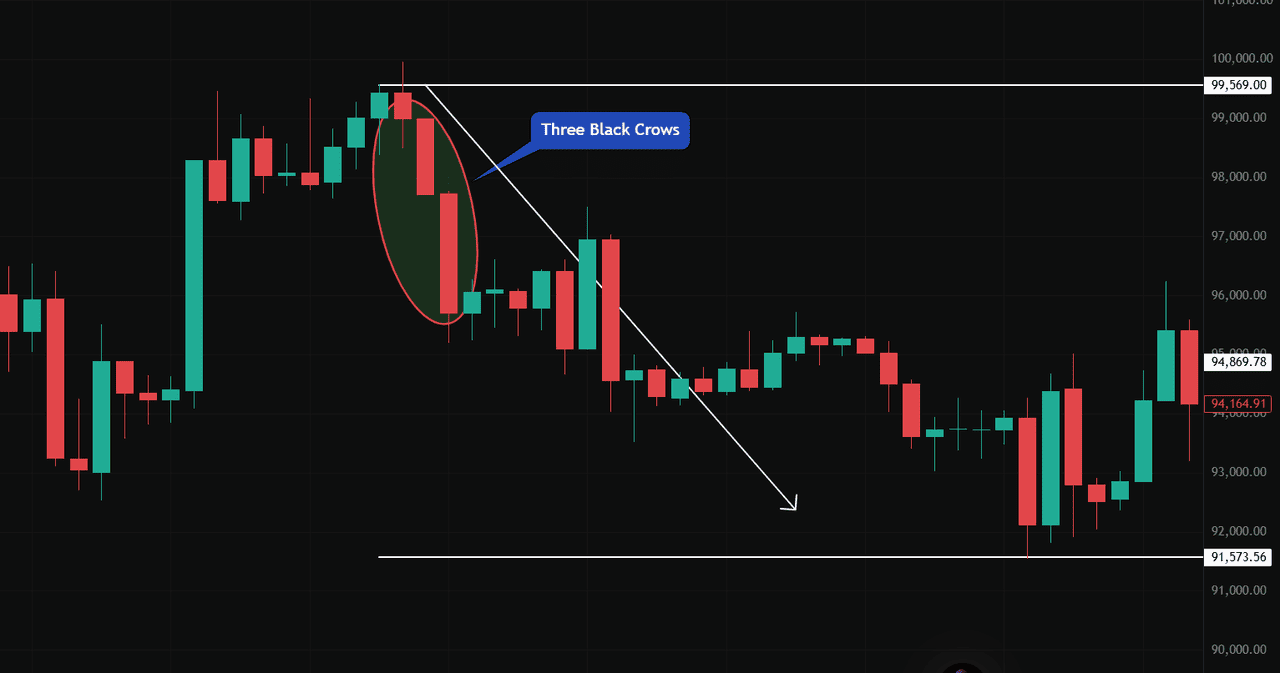
Source: BTC/USDT Trading Chart on BingX
These patterns are especially useful for BingX traders looking to confirm exit signals or time short entries with better precision.
Continuation Patterns: Confirming Existing Trends
Bullish Continuation Patterns
Bullish continuation patterns emerge during an ongoing uptrend, signaling that the trend is likely to resume after a brief pause or consolidation. These patterns provide traders with confirmation that buying momentum remains intact.
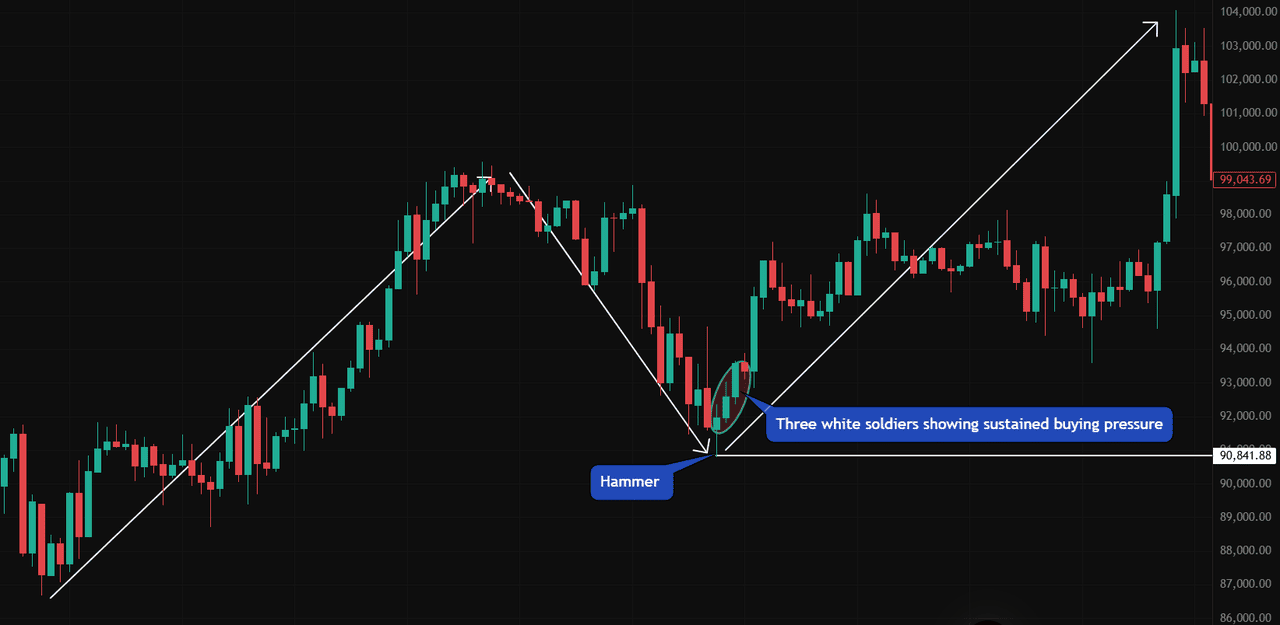
Source: BTC/USDT Trading Chart on BingX
In the chart above, a clear example of the Three White Soldiers pattern appears following a hammer reversal at the bottom of a downtrend. This formation consists of three consecutive bullish candles, each opening within the previous candle’s body and closing higher. It reflects sustained buying pressure, reinforcing the upward trend's continuation.
While other continuation patterns, such as bullish flags or the rising three methods, also serve similar purposes, the Three White Soldiers pattern is particularly valuable when it appears after a strong reversal signal. In this case, the initial hammer candle acted as a bullish reversal, and the three subsequent rising candles confirmed the resumption of bullish momentum.
Reversal vs. Continuation Candlestick Patterns at a Glance
|
Type |
What It Signals |
Where It Appears |
Examples |
|
Bullish reversal |
Downtrend ending — buyers taking control |
Bottom of a downtrend |
Hammer, morning star, bullish engulfing |
|
Bearish reversal |
Uptrend ending — sellers taking control |
Top of an uptrend |
Shooting star, evening star, bearish engulfing |
|
Bullish continuation |
Uptrend pausing — will resume higher |
Mid-uptrend consolidation |
Three white soldiers, bull flag |
|
Bearish continuation |
Downtrend pausing — will resume lower |
Mid-downtrend bounce |
Three black crows, bear flag |
How to Read Candlestick Charts on BingX
Knowing the patterns is only half the job. Here is how to apply candlestick analysis effectively on the BingX platform:
Step 1: Set your timeframe - Open BingX and select your trading pair. Choose your timeframe, daily and 4-hour charts produce the most reliable patterns. Shorter timeframes (5-minute, 15-minute) generate more patterns but also more false signals.
Step 2: Identify the trend - Before looking for any pattern, establish the prevailing trend. A bullish reversal pattern only carries weight at the bottom of a downtrend. A bearish reversal pattern only carries weight at the top of an uptrend.
Step 3: Spot the pattern - Look for the pattern formations covered in this guide. Focus on patterns that form at key support or resistance levels, these carry significantly more weight than patterns forming in the middle of a trend.
Step 4: Confirm with volume - Check the volume when the pattern forms. High volume on a reversal pattern = stronger signal. Low volume = treat with caution.
Step 5: Add indicator confirmation - Layer on RSI and/or MACD for confirmation. A bullish candlestick pattern is significantly more powerful when RSI is in oversold territory (below 30) or showing bullish divergence. A bearish pattern is stronger when RSI is overbought (above 70).
Practical Tips for Trading with Candlestick Patterns on BingX
- Use BingX's demo trading feature to practice spotting patterns before using real capital.
- Maintain a trading journal - document each pattern you trade with screenshots, entry/exit points, and outcomes. This reveals which patterns work best for your style.
- Prioritise quality setups - a pattern at a major support level with high volume and RSI confirmation is worth far more than three patterns forming in random conditions.
- Remember: no pattern is 100% reliable. Always set a stop-loss.
Conclusion
Mastering candlestick charts represents one of the most valuable skills in a cryptocurrency trader's toolkit. These visual price patterns offer unparalleled insights into market psychology, allowing traders to anticipate potential reversals and continuations before they fully develop. By understanding the language of candlesticks, you've gained access to centuries of trading wisdom that remains remarkably effective in today's digital asset markets.
BingX provides all the advanced charting tools needed to apply these candlestick patterns effectively. Take your next step by opening the BingX platform, enabling candlestick charts, and practicing pattern identification in real market conditions. Start with demo trading to build confidence, then gradually implement these strategies with real capital. The journey to profitable cryptocurrency trading begins with recognizing these powerful visual signals that have stood the test of time.
Related Reading
- Inverted Hammer Candlestick Pattern: What It Is & How to Trade It
- Bear Flag Pattern: What It Is & How to Trade It in Crypto
- Bull Flag Pattern: What It Is & How to Trade It in Crypto
- Crypto Chart Patterns: Head & Shoulders, Triangles & Wedges
- How to Trade the Shooting Star Candlestick Pattern in Crypto
- Morning Star vs Evening Star Patterns in Crypto
- How to Use MACD in Crypto Trading
- How to Use RSI in Crypto Trading
FAQs on Candlestick Chart Patterns in Crypto Trading
1. What is a candlestick chart in crypto trading?
A candlestick chart is a type of financial chart that shows an asset’s open, high, low, and close prices within a specific time frame. It's widely used in crypto trading to visualize price movements and identify market trends.
2. How do you know if a candlestick is bullish or bearish?
A candlestick is bullish if the closing price is higher than the opening price (often green or white), and bearish if the closing price is lower than the opening price (typically red or black).
3. Which candlestick pattern is most reliable?
Patterns like the bullish engulfing, hammer, and morning star are considered highly reliable in signaling potential bullish reversals, especially when confirmed by volume and support levels.
4. Can candlestick patterns be used alone to make trades?
While candlestick patterns provide valuable signals, they are best used alongside other tools like trendlines, volume analysis, and indicators such as RSI or moving averages.
5. Does BingX offer candlestick charts for all cryptocurrencies?
Yes, BingX supports candlestick charting for a wide range of cryptocurrencies. Traders can customize timeframes and apply technical analysis directly within the platform.
6. What does a doji candlestick mean?
A doji forms when a candlestick's open and close prices are nearly equal, producing a very small or non-existent body. It signals market indecision, neither buyers nor sellers controlled the session. A doji is most significant when it appears after a strong trend, potentially signalling that momentum is exhausting. Always wait for the next candle to confirm direction before acting on a doji.
7. How many candlestick patterns are there?
There are over 100 named candlestick patterns in technical analysis. However, traders typically focus on 10–15 of the most reliable patterns. The core patterns to learn first are: hammer, inverted hammer, doji, bullish engulfing, bearish engulfing, morning star, evening star, shooting star, hanging man, and three white soldiers/three black crows.
8. What is the most profitable candlestick pattern?
No single pattern is universally the most profitable, profitability depends on context, timeframe, and confirmation. However, studies consistently rate the bullish engulfing, morning star, and three white soldiers among the highest-accuracy patterns when confirmed by volume and support levels. The shooting star and bearish engulfing similarly rank highly for bearish reversals.
