
The global agricultural landscape in mid 2026 is undergoing a major structural recalibration, and sugar is right at the center of volatility. After peaking at 186.1 million metric tons (MMT) during the 2025/26 marketing year, the global sugar balance sheet is tightening noticeably. According to the USDA Foreign Agricultural Service’s (FAS) data, global sugar production for the 2026/27 cycle is projected to drop by roughly 1.2 million tons down to 184.9 MMT.
While an initial glance suggests a clear supply deficit, a fact confirmed by analytical firms like Czarnikow revising their outlooks to a 100,000 ton deficit, market prices have remained stubbornly range bound near multi-month lows. The interplay between shifting biofuels mandates in South America, fluctuating macro geopolitical developments in the Middle East, and looming climate risks is creating an environment where a thin surplus cushion could morph into an outright squeeze at a moment's notice.
Read more: Wheat Global Outlook 2026: Balancing Regional Weather Shocks vs. Abundant Black Sea Supply
Top 5 Things for Sugar Investors to Know in 2026
Source: USDA
- Tightening Global Production Envelope: Global sugar output is retracting. The USDA targets a baseline of 184.9 MMT, while conservative estimates from the International Sugar Organization (ISO) place production closer to 180 MMT, marking a 1.15% to 1.2% year over year contraction.
- Brazil Alleviates Supply via Biofuel Redirection: Brazil’s domestic energy policy has fundamentally altered global trade loops. A mandated shift pushing the anhydrous ethanol blend in gasoline up to 30% means local mills are crushing more cane for fuel rather than raw crystals, causing a 1.3 MMT drop in Brazilian sugar output.
- India’s Recovery Prevents a Supply Crisis: Mitigating steep production cuts from Western nations, back to back strong monsoon seasons have fully replenished India’s water table. Indian production is staging a major recovery, climbing 3.6 MMT to hit an anticipated 33.6 MMT output.
- Macro Risk Premium Evaporates on Strait of Hormuz Reopening: In late spring 2026, a preliminary peace agreement in the Middle East led to the reopening of the Strait of Hormuz. Because this vital channel restricts approximately 6% of the global sugar trade when closed, its reopening has dropped maritime risk premiums and sent crude oil sliding, putting downward pressure on raw agricultural contracts.
- Deficit Projections Looming Large: Facing a comfortable supply profile today, consensus is fracturing. Analytical desks at StoneX and Czarnikow project impending global structural deficits ranging between 262,000 MT and 550,000 MT for the tail end of the 2026/27 marketing year.
2026 Cross Commodity Comparison Analysis
The overview below analyzes the position of global sugar compared to other major agricultural soft commodities in mid 2026. All raw data and price tracking can be viewed natively across active markets. If you want to trade these shifts directly, you can explore the Spot market or track macro agricultural indices inside the TradFi section on BingX.
2026 Agricultural Commodities Pricing & Production Comparison
The table below breaks down the pricing dynamics, year over year velocity, and key sovereign nations shaping the global supply balance sheets for Sugar, Coffee, and Cocoa in mid 2026.
|
Commodity Market |
Benchmark Price (Mid June 2026) |
12-Month Price Performance |
Primary Producing Nations |
Leading Market Dynamics & Core Drivers |
|
Sugar (Sugar) |
13.86 USd / Lbs (ICE No. 11) |
Down 15.54% |
Brazil, India, Thailand, China, United States |
Tightening global supplies down to 184.9 MMT due to Brazilian ethanol blending adjustments (30% mandate) and lower Thai farm gate price caps. The downside is limited by an emerging El Niño pattern, but near term pressures exist due to the reopening of the Strait of Hormuz lowering shipping risk premiums. |
|
Coffee |
262.75 USd / Lbs (ICE Arabica) |
Down 23.31% |
Brazil, Vietnam, Colombia, Indonesia |
Trading near 18 month lows on massive supply expectations. The USDA projects a record Brazilian 2026/27 crop of 71.9 million bags (up 14%). Rabobank expanded its global surplus forecast to 9.5 million bags, shifting the market out of its multi year deficit phase. |
|
Cocoa |
$4,237 / Metric Ton (ICE NY) |
Down 55.00% |
Ivory Coast, Ghana, Indonesia, Ecuador |
Stabilizing around the $4,200 mark after crashing from historic highs. While current port arrivals in West Africa are robust, StoneX and the ICCO have lowered future surplus forecasts due to confirmed El Niño heat and drought risks to the upcoming 2026/27 main crop. |
Data Source Verifications
The structural and financial metrics populated across this outlook are extracted from official global agricultural circulars and commercial soft commodity tracking networks:
- Sugar Metrics: Sourced directly from the USDA Foreign Agricultural Service (FAS) May 2026 Sugar: World Markets and Trade circular, alongside real time price indexes compiled by Trading Economics Sugar Commodity Data.
- Coffee Metrics: Extracted from the June 2026 USDA global coffee production brief, industry updates from Brazil's National Supply Company (Conab), and Rabobank's 2026/27 supply surplus revision reports.
- Cocoa Metrics: Compiled via the International Cocoa Organization (ICCO) May 2026 data adjustments, StoneX West African crop surveys, and daily Intercontinental Exchange (ICE) inventory reports.
Understanding Global Sugar Benchmarks
The global valuation of sugar operates on two dominant international futures mechanisms, reflecting the distinct refinement states of the underlying product:
- ICE Sugar No. 11 (New York): The absolute premier benchmark for the global trade of raw, unrefined cane sugar. It tracks the free on board (FOB) value from key international port facilities.
- ICE London White Sugar No. 5: The primary pricing contract for fully refined, white crystalline sugar, heavily utilized by industrial commercial food manufacturing and confectionery buyers.
Key Supply and Demand Drivers of Sugar by Region
Source: 1 Year Trading Sugar Output | TradingEconomics
Brazil: The Biofuel Tug of War
As the planet's undisputed top sugar origin, holding a massive 24% stake in global supply, Brazil is pulling back. Total production is dropping to a 42.5 MMT channel.
The primary driver is a domestic policy pivot from late 2025 that increased the mandatory anhydrous ethanol blend in commercial gasoline from 27% to 30%. This regulatory change incentivized a 52/48 crush split in favor of ethanol processing. Plummeting oil prices in mid 2026 have made ethanol slightly less competitive, which may prompt mills to tilt back toward sugar late in the season. However, export volumes are already structurally lower, forecast to downshift from 34.1 MMT to 33.6 MMT.
India: Monsoon Windfalls and Heavy State Control
India, the second largest global producer and primary consuming engine, is experiencing an excellent agronomic rebound. Production is climbing back toward 33.6 MMT territory, driven by expanded plantings stretching across 6.0 million hectares in Uttar Pradesh, Maharashtra, and Karnataka.
Despite a domestic surplus of 2.5 MMT, India remains insulated behind highly protected regulatory barriers. The state's Fair and Remunerative Price (FRP) mechanism mandates steep minimum grower pay scales, and strictly managed domestic export quotas mean India will only release a modest 3.6 MMT to international buyers, focused primarily on North African and Middle Eastern buyers like Sudan and Libya.
The European Union and Thailand: Policy and Input Pressures
- European Union: High agricultural input expenses combined with soft regional pricing structures are forcing beet farmers to rotate fields into more lucrative cash crops. Harvested acreage drops are squeezing EU output down 6% to 14.4 MMT, converting the Eurozone back into a net importer.
- Thailand: The Office of the Cane and Sugar Board artificially capped farm gate cane purchase prices below real operational production costs to suppress local food inflation. This policy backfired on volume, driving growers away and triggering a massive 1.8 MMT drop in output down to 9.5 MMT, which is the largest relative drop worldwide.
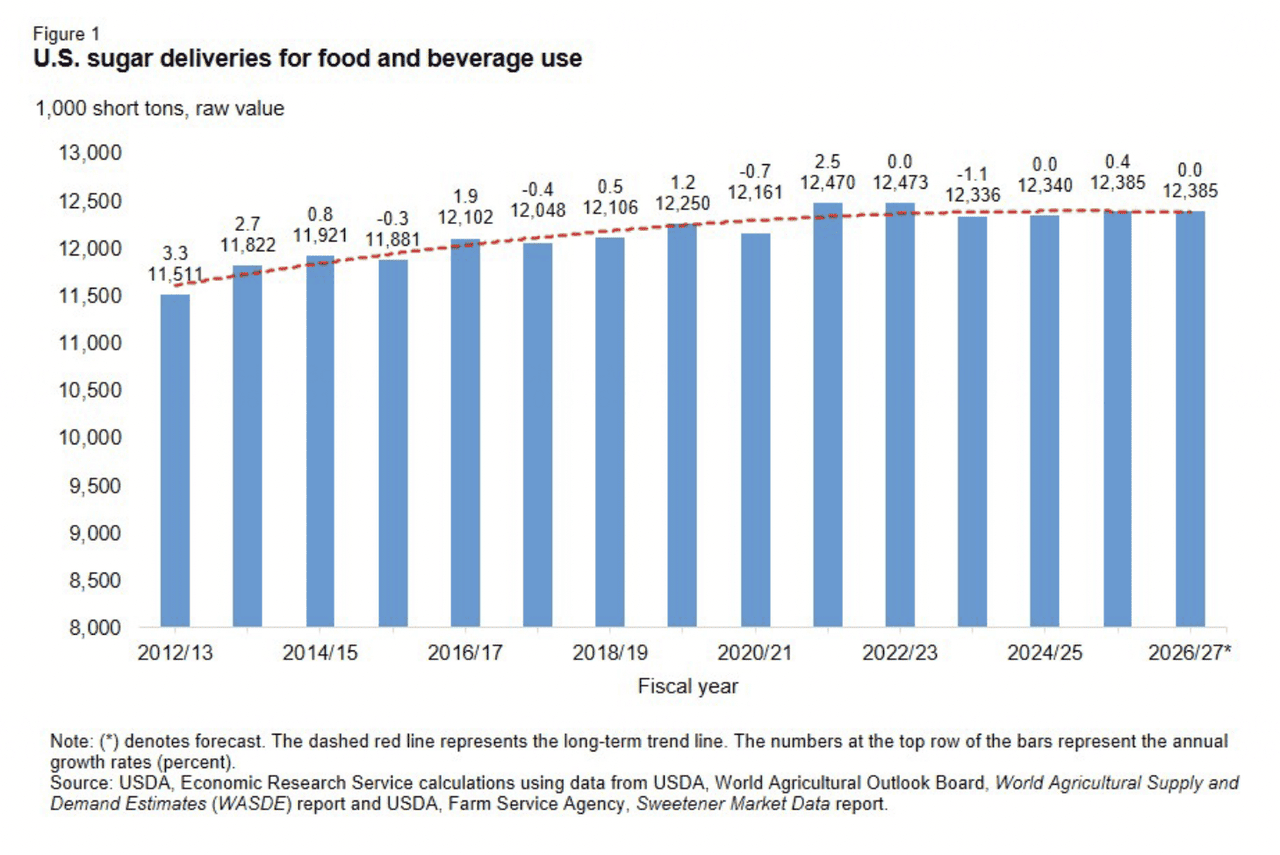
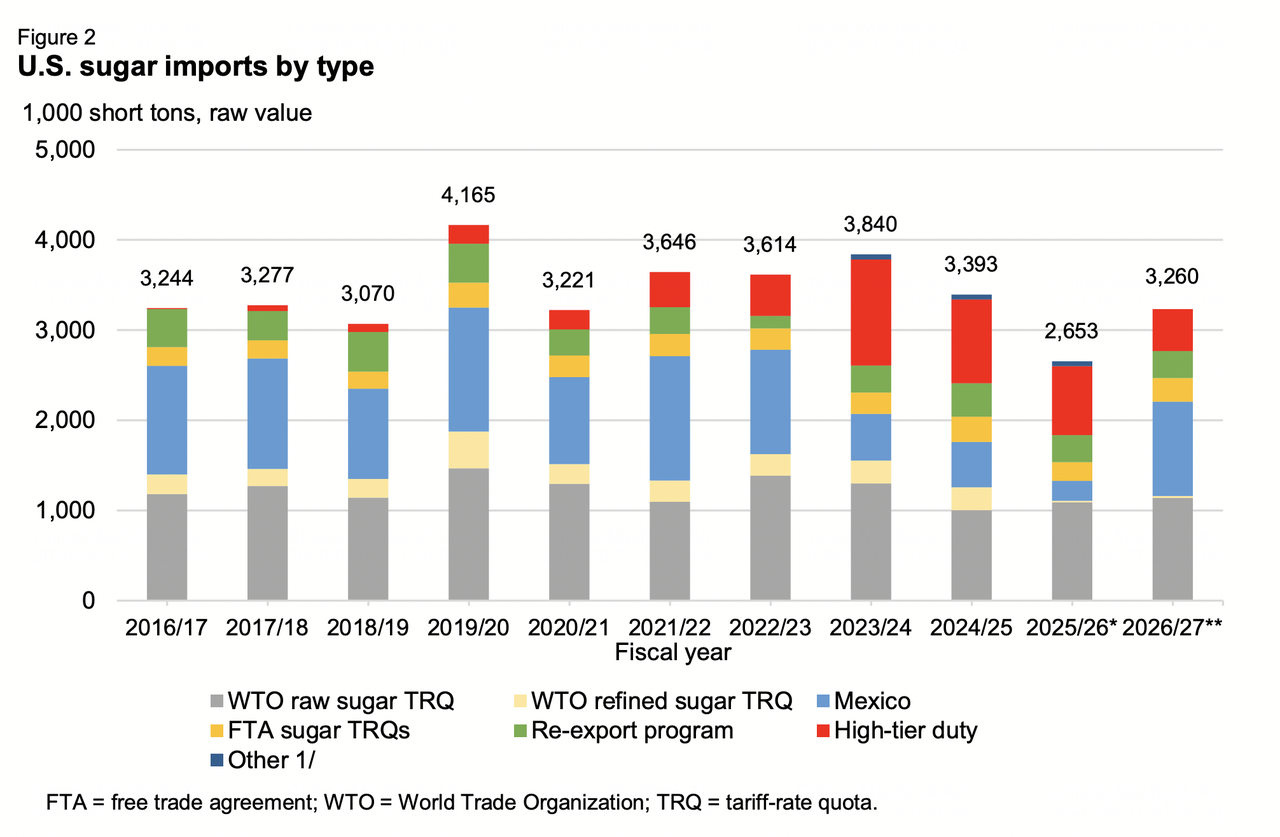
The North American Corridor: Shrinking Domestic Supply
The North American balance sheet highlights a widening supply squeeze for the 2026/27 fiscal year.
According to updated USDA Economic Research Service metrics, U.S. total supply has been adjusted downward to 14.062 million short tons raw value (STRV), which represents a 300,000 STRV decline stemming from lower carried over beginning inventories and an 8.0 MMT domestic crop contraction. With stable domestic consumption fixed at 12.389 million STRV, the structural shortfall will be compensated through a 600,000 STRV import surge up to 3.0 million STRV. This influx relies on high tier tariff volumes and managed calculations from Mexico, whose output has stagnated at a flat 5.142 MMT. As a result, U.S. ending stocks are sliding to a vulnerable five year low of 1.673 million STRV.
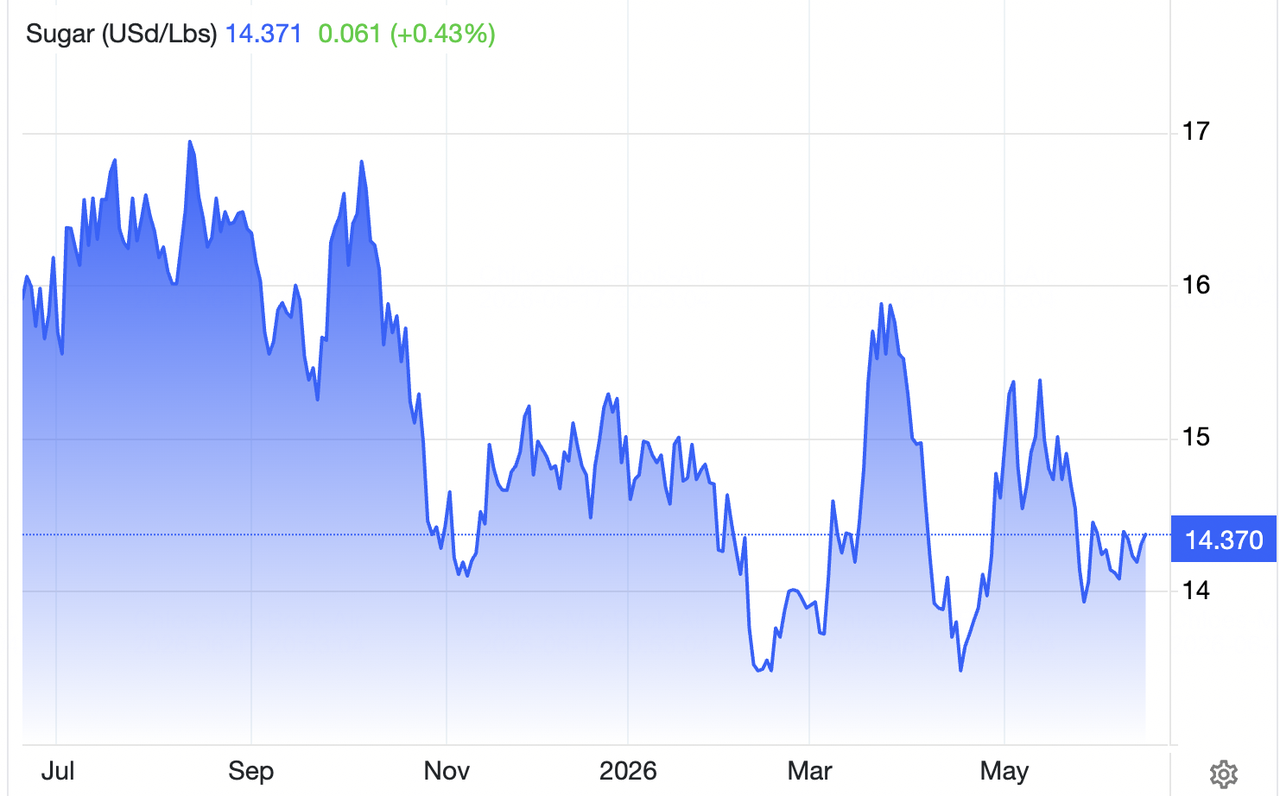
Commodity Pricing Profile in Mid 2026
Source: USDA
The physical and paper financial markets demonstrate range bound trading values, as immediate cash physical availability counters underlying climate and deficit risks.
|
Futures and Cash Benchmarks |
Operational Position / Data |
|
ICE Raw Sugar No. 11 (July Contract) |
13.85 USd / Lbs |
|
ICE Raw Sugar No. 11 (October Contract) |
14.37 USd / Lbs |
|
ICE London White Sugar No. 5 (August) |
$452.20 / metric ton |
|
Trading Economics Spot Benchmark |
~14.37 US cents / Lbs |
|
USDA U.S. All Sugar Supply Target |
14.062 Million STRV |
|
Global 12-Month Price Velocity |
Down 15.54% |
|
Analyst 2026/27 Consensus Average Range |
14.60 to 16.20 USc / Lbs |
Sugar Market Forecasts in 2026: Bull vs. Bear Outlook
The Bull Case for Sugar Prices: El Niño Disruptions and Thin Deficit Margins
The structural bull pathway centers entirely on severe weather realization and unexpected supply chokepoints. If the intensifying El Niño climate pattern inflicts severe heat damage on emerging fields in Center South Brazil or curtails India’s upcoming monsoon patterns, global stocks will hit critical lows. With major analytical houses validating a transition toward a structural deficit and the U.S. holding five-year stock minimums, even a minor crop failure could trigger massive short covering rallies back up toward the 16.20 USc/Lbs consensus target.
The Bear Case: Biofuel Demand Destruction and Record Shipments
The bear case hinges on macro energy market dynamics. If global crude oil values continue to fall following geopolitical resolutions in the Middle East, the financial incentive for Brazilian mills to process ethanol will disappear. This would trigger a massive structural pivot, forcing mills to maximize their sugar crystallization ratios. This extra supply, combined with aggressive export logistics from Thailand and a rising stockpile cushion in China (rising to 4.0 MMT), could push prices back down past the 13.34 USc/Lbs life of contract support floor.
How to Trade Sugar Futures on BingX TradFi
The TradFi architecture on BingX provides a highly fluid, modern infrastructure for entering agricultural commodity markets using USDT-settled perpetual contracts, allowing traders to circumvent old-world futures brokerage loops.
Long or Short Sugar Perpetuals with USDT on BingX Futures
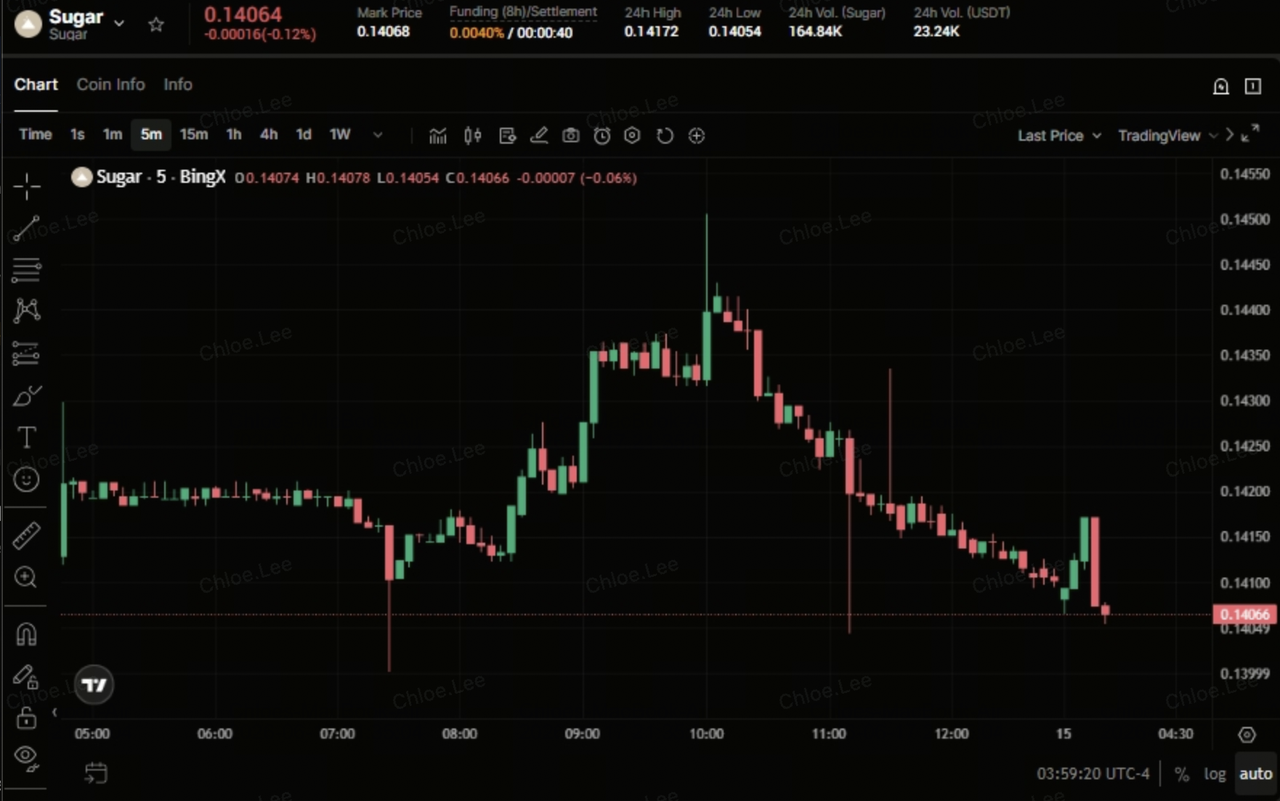
Sugar (Sugar) perpetual contract on BingX futures market
- Navigate to the BingX trading platform and navigate directly to the TradFi Stock/Commodity Futures interface.
- Select the Sugar (Sugar) perpetual contract.
- Verify active trading sessions before submitting order tickets. Spreads and localized volatility may widen during extended-hour sessions due to lower immediate order book density.
- Configure your preferred Margin Mode (Isolated for defined boundary isolation, or Cross for collective portfolio pooling) and select leverage metrics.
- Execute Open Long if you anticipate positive backlog conversions, consecutive earnings outperformance, or strong margin guidance updates. Execute Open Short if you look to hedge against tech sector pullbacks, overextended valuations, or potential manufacturing execution friction.
- Implement protective Take-Profit (TP) and Stop-Loss (SL) boundary parameters immediately upon order entry to shield capital configurations from sudden macro market swings.
Conclusion: How to Navigate the 2026 Sugar Market on BingX
The global sugar complex in 2026 is trapped in a classic standoff between tightening crop balances and broader macroeconomic weights. While structural reductions across Thailand, Brazil, and Europe provide a strong structural cushion underneath the market, the removal of geopolitical risk premiums and weak crude oil prices prevent any immediate breakout. Successful participants must keep a close eye on Brazilian crop crushing ratios and develop weather metrics to capitalize on the next major structural shift.
Risk Reminder: Trading soft agricultural commodities via Spot or derivatives portals involves high exposure to unpredictable weather anomalies, shifting national currency valuations (especially the Brazilian Real), and fluctuating biofuel regulations. Deploy strict position sizing and defensive stop protocols across all active market trades.
Related Reading
- How to Trade Gold Futures With Crypto: A Beginner's Guide for 2026
- How to Trade Forex, Commodities, Stocks, and Indices With BingX TradFi: A Beginner’s Guide (2026)
- Is Gold a Good Investment in 2026? Risks & Returns Explained
- Commodities, Forex, and Gold Heating Up On-Chain Amid 2026 Precious Metal Highs
