In early May 2026, Natural Gas (NG) sits at the most fractured juncture in the history of fossil fuels. While European and Asian markets are reeling from an 80-100% price surge following the outbreak of the U.S.-Iran War on February 28, the U.S. domestic market remains physically isolated. U.S. Henry Hub futures are currently consolidating near 17-month lows of $2.52–$2.78, even as global benchmarks like TTF and JKM trade at staggering premiums.
The crisis has exposed a critical infrastructure straitjacket: U.S. LNG export plants are at maximum capacity, meaning the world’s largest producer cannot move its surplus to the nations that need it most. With a Super El Niño looming for late 2026 and West Texas producers literally paying to have gas taken away, traders are balancing extreme global scarcity against a massive domestic glut.
This guide breaks down the Natural Gas price prediction for 2026 using data from the EIA, Rystad Energy, Bank of America, and Reuters.
You will also discover how to trade Natural Gas futures with USDT through BingX TradFi.
Top 5 Things for Natural Gas Traders to Know in 2026
As Natural Gas navigates a high-stakes environment of geopolitical blockades and seasonal weather shifts, traders must monitor these five market-moving factors.
- The Hormuz Blockade: The war has halted 20% of global LNG supply. Qatar’s damaged liquefaction trains at Ras Laffan are estimated to be offline for 3–5 years, creating a structural global deficit.
- U.S. Export Bottlenecks: Although U.S. LNG exports hit a record 18.8 Bcf/d in April, the system is maxed out. Relief from new projects like Golden Pass and Corpus Christi Stage 3 is months away, keeping U.S. prices decoupled from global spikes.
- Waha Hub Negativity: In the Permian Basin, spot prices have been negative for a record 69 days in 2026. This trapped gas puts downward pressure on the Henry Hub benchmark despite the global energy war.
- The Super El Niño Factor: Climate models predict a 2.5°C rise in Pacific temperatures by autumn 2026. Historically, this results in milder winters, which would further swell U.S. storage and crush domestic heating demand.
- Strategic Curtailments: Major U.S. producers like EQT have begun cutting output to floor the price. How long they can hold gas in the ground will determine if Henry Hub can break back above $3.00.
What Is Natural Gas (NG)?
Natural Gas is a methane-rich hydrocarbon that serves as the bridge fuel for the global energy transition. In 2026, its utility is dominated by three high-demand sectors: Electric Power, accounting for around 40% of U.S. consumption, Industrial Feedstock for ammonia-based fertilizers, and the rapidly expanding AI Data Center market, which requires 24/7 dispatchable power. Unlike crude oil, gas is expensive to transport across oceans, requiring it to be super-cooled to -162°C to create Liquefied Natural Gas (LNG).
The 2026 market is defined by a Physical Disconnect. While the U.S. produces a record 110 Bcf/d, global supply has contracted by 20% due to the closure of the Strait of Hormuz and the damage to Qatar’s Ras Laffan facility. This has split the market into two isolated pricing tiers:
- Regional Pipeline Gas (The Glut): Trapped in North America due to full pipelines, keeping the Henry Hub benchmark near $2.70/mmBtu.
- Seaborne LNG (The Scarcity): Trading at a massive War Premium, with European TTF and Asian JKM benchmarks exceeding $20.00/mmBtu.
For natural gs traders on BingX TradFi, the primary opportunity in 2026 lies in the Arb Spread, the $17+ difference between U.S. futures and global spot prices. Under normal conditions, this spread is limited by the cost of liquefaction and shipping, typically $2.00–$3.00. However, with global capacity capped, the spread has become a barometer for geopolitical risk.
Natural Gas’s Performance in 2025: A Review
In 2025, Natural Gas was a story of record-breaking production. U.S. output hit an all-time high of 107.7 Bcf/d, driven by associated gas from oil drilling. Prices remained relatively stable between $2.50 and $3.50 as supply growth largely kept pace with the expansion of new LNG export terminals.
By December 2025, storage levels were healthy, and the market expected a balanced 2026. However, the February 2026 Iranian attacks on Gulf energy infrastructure completely upended this stability, turning Natural Gas into a geopolitical weapon and creating the bifurcation we see today.
Natural Gas 2026 Investment Outlook: $4.50 Recovery vs. $1.80 Surplus Collapse
The following outlook analyzes three distinct probability-weighted paths for Natural Gas as the market grapples with a historic disconnect between domestic oversupply and global energy scarcity.
The Bull Case: Natural Gas's $4.50 Infrastructure Breakout
The bullish narrative centers on the unclogging of the American energy artery. If key infrastructure projects like Golden Pass Train 1 and Corpus Christi Stage 3 achieve substantial completion ahead of schedule in Q3 2026, the U.S. will gain approximately 2.0 Bcf/d of new export capacity. This would allow domestic producers to arbitrage the massive price gap created by the damaged Qatari facilities, effectively exporting the U.S. glut and driving Henry Hub toward the $4.50 mark.
Beyond exports, this scenario is fueled by a surge in 'always-on' power demand from AI data centers, which the EIA projects will push gas-fired generation toward 38.1 Bcf/d. Investors should watch for a decisive weekly close above the $3.35 12-month strip average; such a move would signal that incremental demand from new LNG feedgas is finally eroding the storage surplus, shifting the market from a regional waste product pricing model to a globalized commodity valuation.
The Base Case: $2.50 – $3.20 Range-Bound Gridlock for Natural Gas Prices
The base case envisions a Straitjacket environment where physical constraints dictate price ceilings. While global demand is insatiable, the U.S. remains limited by a nameplate export capacity cap of roughly 18-19 Bcf/d. Analysts at Rystad and the EIA expect Henry Hub to churn within a tight band, anchored by a 7% storage surplus that prevents sustained rallies. In this environment, any price spike toward $3.20 is met with associated gas production from the Permian, which continues to flow regardless of gas prices.
Tactically, this is a mean-reversion market where internal U.S. Dynamics, like coal-to-gas switching, act as the primary support. With summer power demand expected to rise 2.3% over 2025 levels, the market has a fundamental floor near $2.50. Traders should focus on the spread between Henry Hub and European TTF; as long as this remains at 6x historical norms, the U.S. market will remain a captive, range-bound satellite of the broader global energy war.
The Bear Case: Natural Gas Price Experiences $1.80 Super El Niño Trap
The bearish scenario is a perfect storm of climatic and geopolitical isolation. Meteorologists warn of a Super El Niño with sea surface temperature anomalies exceeding +2.5°C, which historically correlates with significantly warmer winters in the U.S. Northeast. If the 2026-2027 heating season fails to materialize, the current 1,900 Bcf storage cushion could swell toward all-time highs, forcing a containment crisis where there is simply no physical room left to store gas.
In this hard-landing event, the Waha Hub negative pricing phenomenon could go national. If the Strait of Hormuz remains blockaded, preventing any emergency expansion of U.S. LNG shipments, the domestic market would face a 'supply without a home' reality. A breach of the $2.00 psychological floor would likely trigger systematic liquidations, potentially retesting the $1.80 support zone last seen during the 2020 demand shock, as producers are forced to shut-in wells to prevent a total storage breach.
Natural Gas Price Forecasts for 2026 by Leading Analysts
|
Institution |
2026 Target (Avg/Peak) |
Market Outlook |
|
EIA (Short-Term Energy Outlook) |
$3.67 |
Neutral: Traces near-average storage expectations. |
|
Bank of America |
$4.00+ |
Bullish: Cites eventual pipeline relief late in the year. |
|
Rystad Energy |
$2.80 - $3.20 |
Stable: Domestic pricing remains insulated from global war. |
|
LSEG Data |
$2.50 |
Bearish: Points to record storage injections and mild weather. |
How to Trade Natural Gas (NG) Futures on BingX TradFi
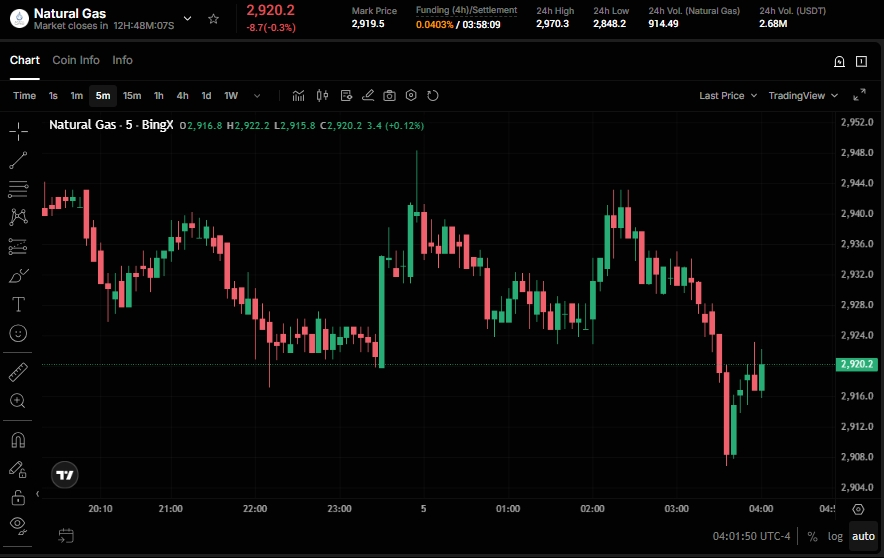
Trade natural gas futures with USDT on BingX TradFi
Capitalize on the 2026 energy bifurcation using BingX TradFi and the power of automated insights from BingX AI. Whether you are hedging against an El Niño winter or betting on the U.S. export breakout, BingX provides the tools to trade the world's most volatile fuel.
- Access BingX TradFi: Navigate to the Commodities section.
- Select Natural Gas (NG): Choose the Natural-Gas-USDT perpetual contract in the futures market.
- Choose Your Direction: Select Open Long if you anticipate new LNG terminals draining the U.S. surplus, or Open Short if you expect a warm El Niño winter to crush demand.
- Manage Risk: Use TP/SL (take-profit/stop-loss) tools to navigate the 10% weekly swings common in the 2026 market.
Final Thoughts: Is Natural Gas a Buy at $2.70 in 2026?
As of May 2026, the value proposition for Natural Gas depends entirely on your investment horizon and your access to global versus domestic liquidity. At the $2.70 level, Henry Hub is trading at a historic 85% discount to global benchmarks, a gap that fundamentally cannot persist once the next wave of LNG export infrastructure, such as Golden Pass, reaches full utilization. For long-term portfolios, the structural shift toward a data-center-driven economy and a projected 35 Bcf/d export capacity by 2030 suggests that current prices represent a significant undervaluation of U.S. energy reserves relative to the global stack.
For tactical traders, however, the cheap domestic price is a secondary metric to the immediate physical constraints of storage and weather. Entering a long position at $2.70 requires a high tolerance for volatility, as a Super El Niño could easily push prices toward the $2.00 support floor before any infrastructure breakout occurs. The most effective strategy in this bifurcated market is to monitor inventory injection rates and Strait of Hormuz transit data; a breakthrough in either - geopolitical de-escalation or domestic pipeline completion, will be the primary catalyst for the next major trend.
Risk Reminder: Natural Gas is notoriously volatile and is often referred to as 'The Widowmaker' due to its susceptibility to unpredictable weather shifts and geopolitical shocks. Trading Natural Gas futures involves a high risk of capital loss, particularly when using leverage. Investors should employ strict stop-loss orders and ensure they are not over-exposed to a single commodity sector.
Related Reading
- Cheniere Energy (LNG) Price Prediction 2026: $330 Sovereign Boom or $210 Infrastructure Trap?
- Crude Oil Price Forecast 2026: $140 War Premium or $60 Surplus Baseline?
- Energy Select Sector XLE ETF Prediction 2026: $65 Energy Supercycle or $40 Hormuz Hedge Exit?
- XOP S&P Oil & Gas ETF Prediction 2026: $210 Geopolitical Moonshot or $130 Hedge Trap?
- SLB Stock Prediction 2026: $83 Digital AI Breakout or $48 Geopolitical Trap?
- Occidental Petroleum (OXY) Price Prediction 2026: $115 Net-Zero Alpha or $55 Commodity Trap?
