Join the Trading Community: Learn & Earn with BingX.
Source: TradingView & BingX
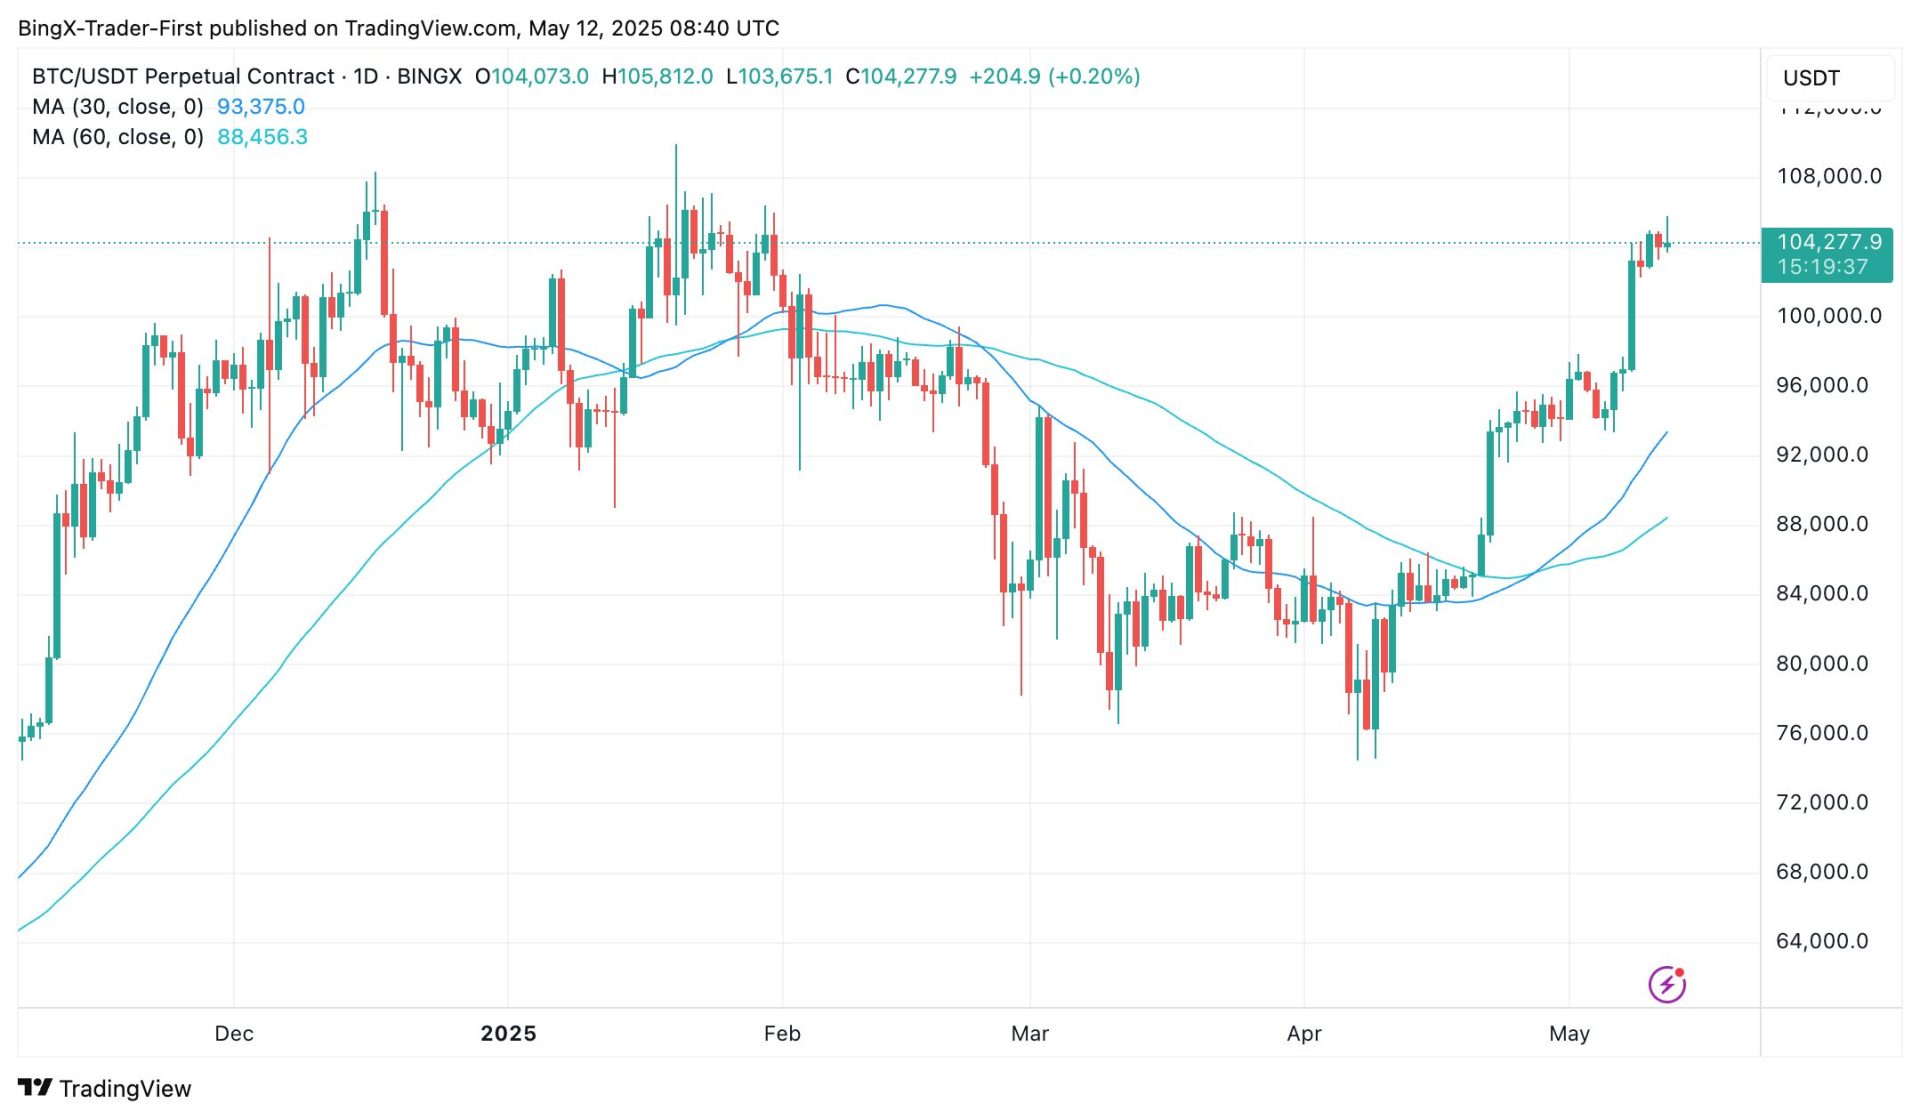
The 4-hour chart for BTC/USD shows Bitcoin trading at $104,129, reflecting a continued upward move of 1.92% from recent levels. The price has extended its rally beyond the previous high of $102,169, breaking through the $103,000 resistance and setting a new high at $104,129. This move is well above the 30-period moving average at $92,345.1 and the 60-period moving average at $87,456.8, confirming strong bullish momentum. The candlestick patterns show a series of bullish candles with increasing volume, indicating sustained buying pressure. However, the RSI on the 4-hour chart is at 75.32, deep in overbought territory, and the MACD, while still bullish, is showing signs of flattening, suggesting a potential short-term pullback.
On the 1-day chart, Bitcoin’s broader trend remains strongly bullish, with the price soaring from $58,846 in late 2024 to the current $104,129, solidifying its position above the $100,000 milestone. The daily chart shows the price continuing to push beyond the upper boundary of a long-term ascending channel, with $102,169 now acting as a potential support level after the breakout. The 200-period moving average at $92,789.12 trends upward, supporting the bullish outlook, and the rally has been accompanied by elevated volume, reflecting strong market conviction. The RSI on the daily chart is at 80.14, indicating severely overbought conditions, and the MACD, though bullish, shows a growing divergence, raising concerns about the sustainability of the current momentum.
From a technical perspective, Bitcoin’s current levels on both timeframes highlight a robust uptrend but with increasing risks of a correction. On the 4-hour chart, the overbought RSI and flattening MACD suggest the price may face resistance around $105,000, with a possible pullback to test support at $102,169 if selling pressure emerges. On the 1-day chart, the break above $100,000 and the channel’s upper boundary remains a bullish signal, but the extremely high RSI and MACD divergence indicate a heightened risk of a pullback, with support near $102,169 or the 200-period moving average at $92,789. A sustained move above $105,000 could target $108,000, while a drop below $102,169 might lead to a deeper correction.
Disclaimer: BingX does not endorse and is not responsible for or liable for any content, accuracy, quality, advertising, products, or other materials on this page. Readers should do their own research before taking any actions related to the company. BingX is not responsible, directly or indirectly, for any damage or loss caused or alleged to be caused by or in connection with the use of or reliance on any content, goods, or services mentioned in the article.