Join the Trading Community: Learn & Earn with BingX.
Source: TradingView & BingX
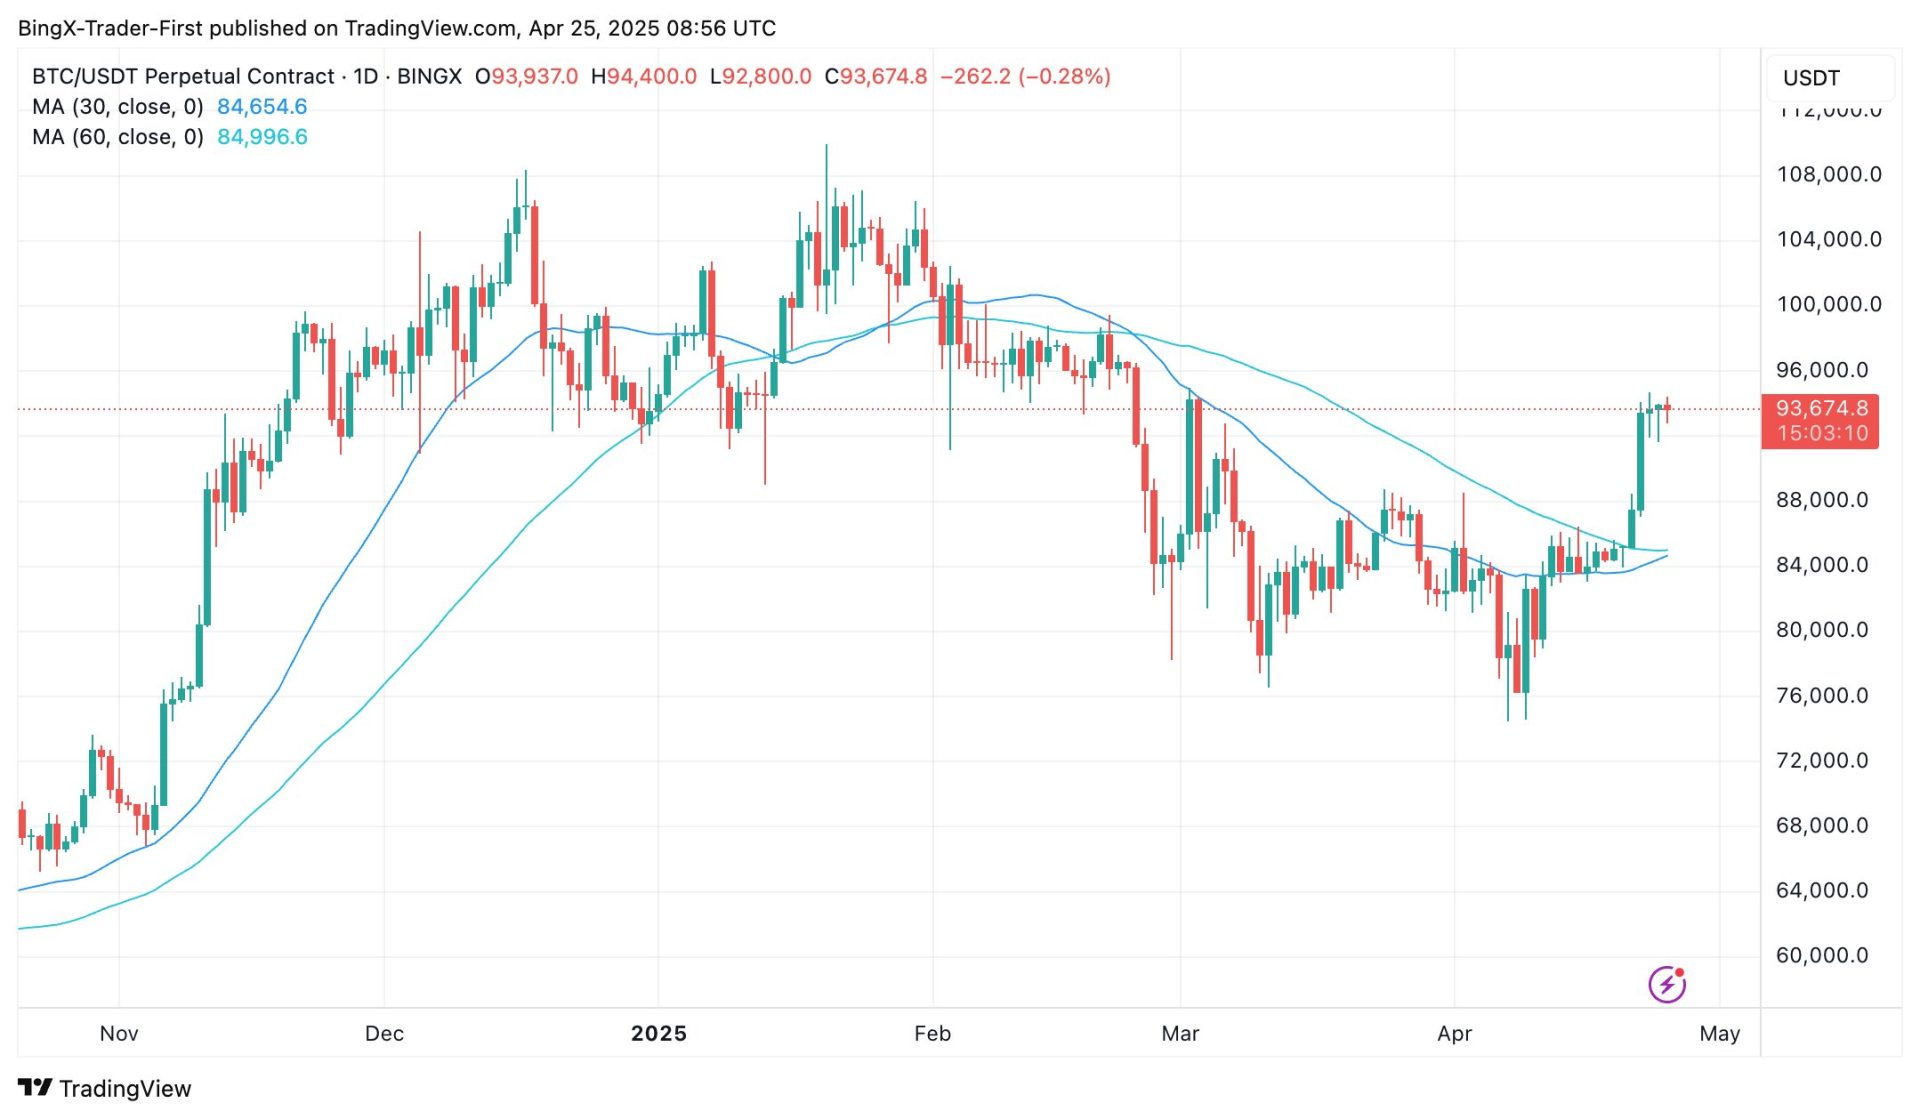
The 4-hour chart for BTC/USD shows a recent price movement, with Bitcoin trading at $93,646 as of April 25, 2025. The chart indicates a sharp decline from a high of around $94,469 earlier in the week, followed by a period of consolidation and a slight recovery. The price is currently interacting with the 30-period moving average at $84,654.6 and the 60-period moving average at $84,996.6, which have acted as dynamic support and resistance levels. The candlestick patterns reveal increased volatility, featuring a mix of bullish and bearish candles, which suggests indecision in the market. The RSI on the 4-hour chart is at 53.26, indicating neutral momentum, while the MACD shows a bearish crossover, hinting at potential downward pressure in the short term.
On the 1-day chart, Bitcoin’s price action over the past few months displays a broader trend. The price surged from a low of $74,508 in early December 2024 to a peak near $94,469 in late February 2025, marking a significant uptrend. However, a sharp correction followed, bringing the price down to the current level of $93,646. The daily chart shows the price testing a long-term trendline support, which has held firm since November 2024. The moving averages on this timeframe, including the 200-period MA at $84,000, are still trending upward, suggesting that the overall bullish structure remains intact despite the recent pullback. Volume spikes during the decline indicate strong selling pressure, but the subsequent decrease in volume suggests a potential slowdown in bearish momentum.
From a technical perspective, Bitcoin’s current position on both the 4-hour and 1-day charts points to a critical juncture. The 4-hour chart’s neutral RSI and bearish MACD signal caution for short-term traders, as the price may continue to consolidate or face further downside if it breaks below the moving averages. On the daily chart, the trendline support and the upward-sloping 200-period moving average (MA) provide a bullish backdrop; however, the recent correction and declining volume suggest that buyer conviction may be waning. Traders may watch for a breakout above $94,469 to confirm a bullish continuation or a drop below $92,800 to signal a deeper correction, with the $84,000 level serving as the next major support.
Disclaimer: BingX does not endorse and is not responsible for or liable for any content, accuracy, quality, advertising, products, or other materials on this page. Readers should do their own research before taking any actions related to the company. BingX is not responsible, directly or indirectly, for any damage or loss caused or alleged to be caused by or in connection with the use of or reliance on any content, goods, or services mentioned in the article.