
In April 2026, the SPDR S&P Oil & Gas Exploration & Production ETF (XOP) has become the epicenter of the global energy crisis, as the U.S.-Iran conflict effectively shuts down the Strait of Hormuz. While WTI crude oil has spiked above $114 per barrel, a level not seen in four years, XOP investors are facing a complex reality: while pure-play explorers are the front-line beneficiaries of supply shocks, the fund's equal-weight structure is exposing a massive divergence between rising spot prices and the hedging traps currently swallowing producer profits.
As the world faces the mother of all energy crises (IEA), the market is weighing record-breaking free cash flow from Permian giants like Diamondback (FANG) against the $60 Bear Floor predicted by J.P. Morgan once geopolitical premiums evaporate.
This guide breaks down the XOP ETF price prediction for 2026 using data from S&P Global, Bloomberg, and Tickeron, and how to trade XOP ETF futures with Tether (USDT) on BingX TradFi.
Top 5 Things for S&P Oil & Gas (XOP) ETF Investors to Know in 2026
As the energy sector navigates a high-stakes environment of naval blockades and Agentic Finance algorithm trading, investors must monitor these five factors:
- The $114 Price Ceiling: Crude has touched $114 due to the Hormuz blockade, but XOP has only gained 43% YTD, as traders price in a potential de-escalation that could send WTI back to its $57 fair value.
- The Hedging Trap: Many holdings in XOP, such as ConocoPhillips (COP), realized only $42-$45 per barrel in late 2025 due to low-price hedges. These companies are currently bleeding the upside of $100 oil.
- Capex Discipline: Unlike previous cycles, U.S. shale producers are refusing to drill more. Global upstream capex is set to fall 4% in 2026, prioritizing stock buybacks over volume growth.
- Equal-Weight Sensitivity: XOP’s equal-weight methodology means small-cap drillers carry the same weight as ExxonMobil. This creates a high-beta environment where XOP outpaces broad indices during rallies but crashes harder during sell-offs.
- LNG Arbitrage: With the Ras Laffan facility in Qatar damaged, U.S. natural gas producers like EQT and Cheniere are seeing massive demand from Europe, providing a secondary engine for XOP.
What Is the SPDR S&P Oil & Gas Exploration & Production ETF (XOP)?
The SPDR S&P Oil & Gas Exploration & Production ETF (XOP) is a targeted fund that tracks the S&P Oil & Gas Exploration & Production Select Industry Index. Unlike cap-weighted funds like XLE, which is 40% Exxon and Chevron, XOP uses a modified equal-weight approach. This means it provides unconcentrated exposure to ~50 U.S. firms across large, mid, and small-caps.
The fund is anchored by the Upstream segment, the companies that find and extract crude and natural gas. In 2026, XOP is the primary vehicle for investors betting on U.S. Energy Independence, as domestic production remains the only stable supply while 20% of global oil trade is choked off in the Persian Gulf.
A Review of the Global Energy Sector Performance in 2025
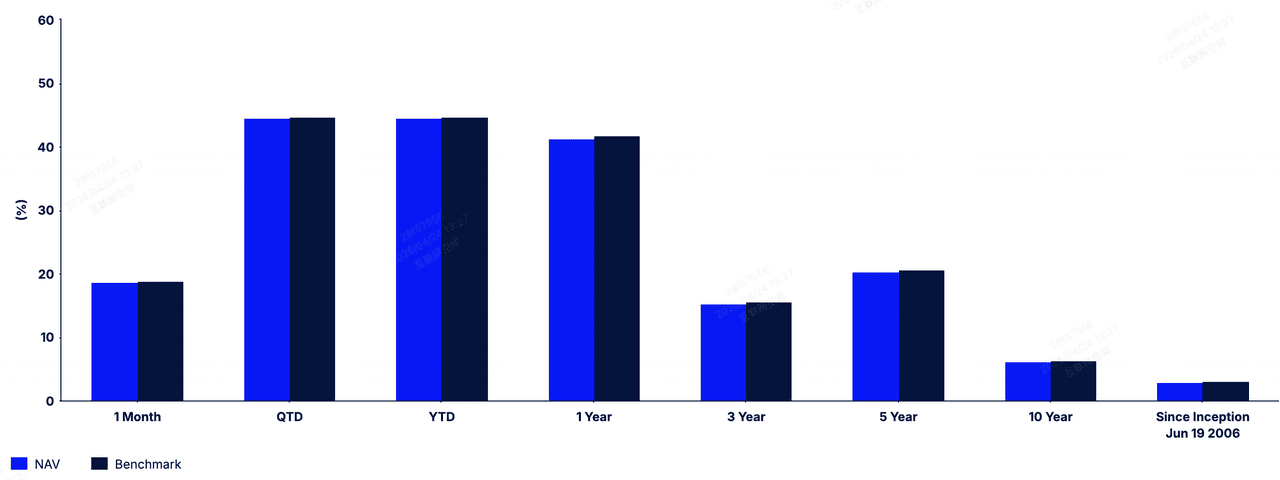
XOP ETF performance | Source: State Street
The 2025 energy landscape was defined by a stark valuation chasm; while the S&P 500 rode the AI-driven Inference Era to record highs, the energy sector languished as a value orphan. West Texas Intermediate (WTI) plummeted to a cyclical floor of $57 per barrel by December, weighed down by record-high non-OPEC supply and persistent demand skepticism from China. During this period, the sector underwent a rigorous Capital Discipline transformation. Instead of chasing production growth, top XOP holdings like Diamondback Energy (FANG) and Devon Energy (DVN) pivoted to a strict Harvest Mode, utilizing free cash flow to slash net-debt-to-EBITDA ratios below 1.0x and boosting return-of-capital frameworks to over 75%.
This Fortress Balance Sheet pivot effectively de-risked the sector just as the Iran-Strait of Hormuz crisis ignited in February 2026. Because U.S. shale producers had aggressively retired high-interest debt and optimized their breakeven points to sub-$45 levels during the 2025 lull, they entered the 2026 geopolitical shock with unprecedented operating leverage. This lean financial architecture has allowed XOP constituents to convert the recent jump to $114 oil directly into equity value and accelerated buybacks, capturing the geopolitical premium without the interest-expense drag that historically crippled smaller drillers during sudden price spikes.
XOP ETF 2026 Investment Outlook: $210 Moonshot vs. $130 'Hedge-mageddon'
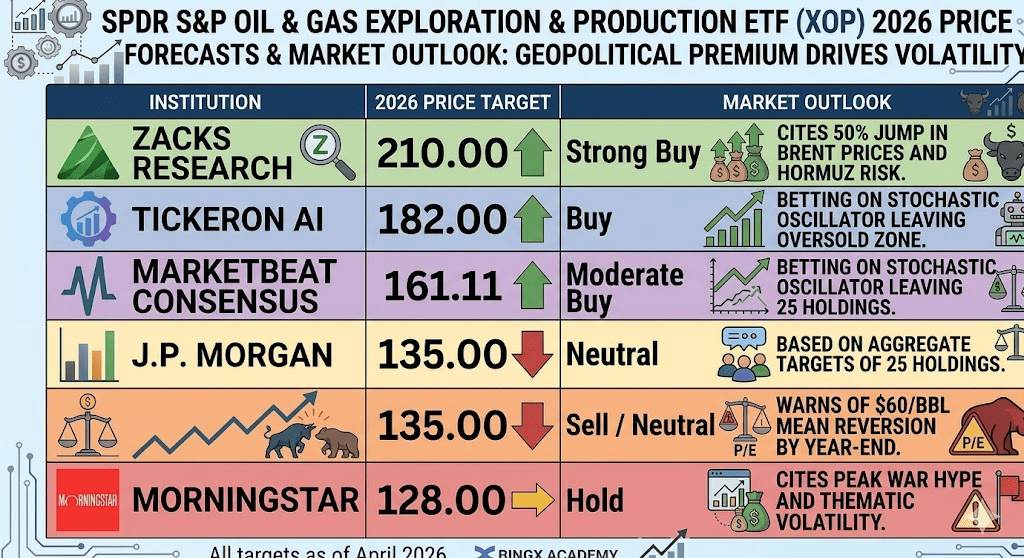
State Street SPDR S&P Oil & Gas (XOP) ETF 2026 forecasts by various Wall Street analysts
Navigate the volatility of the 2026 energy crisis by weighing these three probability-weighted scenarios for XOP.
The Bull Case: XOP's $210 Strait of Fire Breakthrough
The $210 target is predicated on a persistent maritime blockade through Q3 2026, creating a structural 12 million barrel-per-day (bpd) deficit that exhausts the global spare capacity buffer. As Brent crude sustains levels above $120, the hedge-drag that previously capped producer profits evaporates as 2025-era contracts roll off, allowing XOP’s pure-play explorers to realize full spot-market pricing. In this environment, the U.S. government likely issues emergency LNG and crude export permits to fill the European shortfall, transforming the Permian Basin into the world’s primary swing producer.
From a data perspective, this scenario assumes XOP’s free cash flow (FCF) yield expands toward 15%, driven by unhedged margins exceeding $65 per barrel. With institutional Prepayment Mania moving from AI chips to energy security, we anticipate a 30% surge in base dividends and a massive wave of special distributions. Practically, a decisive weekly close above the $170 resistance would confirm this breakout, positioning XOP as the ultimate high-beta hedge against a war-premium inflationary cycle.
The Base Case: S&P Oil & Gas (XOP) ETF's $165 – $185 Consolidation
The base case envisions a fragile peace where the Strait of Hormuz partially reopens under naval escort, stabilizing WTI in the $85–$95 range. While the extreme geopolitical premium cools, a decade of global underinvestment in conventional discovery prevents a return to cheap oil. XOP holdings remain in a Capital Discipline sweet spot: maintaining flat production while utilizing $90 oil to aggressively retire remaining debt and execute opportunistic share buybacks. This creates a high-floor valuation for the ETF, supported by a reliable 2.15% dividend yield.
In this range-bound environment, XOP serves as a yield-plus-growth alternative for investors rotating out of overextended Magnificent Seven tech valuations. The fund will likely oscillate as it digests its 43% YTD gain, with $165 serving as a hard psychological support level. Investors should focus on the Total Return aspect here, as E&P companies prioritize returning 100% of excess FCF to shareholders, turning XOP into a quasi-bond for the energy sector.
The Bear Case: $130 'Hedge-mageddon' Trap for XOP ETF
The bear case is triggered by a sudden diplomatic resolution and the immediate return of Iranian and Russian barrels to a well-supplied market, causing WTI to plummet toward its $60 fundamental floor. This Hedge-mageddon occurs if producers, betting on sustained triple-digit prices, failed to lock in protection for late 2026. As the geopolitical premium vanishes, the market shifts focus to CapEx Fatigue, where the massive infrastructure spend initiated during the April spike becomes an underwater liability in a low-price environment.
Data-wise, a move toward $130 implies a catastrophic de-rating of P/E multiples from 11x back to historical lows of 7x or 8x. Technically, if XOP fails to hold the $155 support, systematic trend-following algorithms and TradFi bot sell-offs will likely accelerate the decline. This hard-landing scenario would see the current 40% YTD gain completely retraced as the supply-demand balance flips from a 12 million bpd deficit to a 2 million bpd surplus by year-end.
XOP ETF Analyst Forecasts and Price Targets for 2026
|
Institution |
2026 Price Target (XOP) |
Market Outlook |
|
Zacks Research |
$210.00 |
Strong Buy: Cites 50% jump in Brent prices and Hormuz risk. |
|
Tickeron AI |
$182.00 |
Buy: Betting on Stochastic Oscillator leaving oversold zone. |
|
MarketBeat Consensus |
$161.11 |
Moderate Buy: Based on aggregate targets of 25 holdings. |
|
J.P. Morgan |
$135.00 |
Sell/Neutral: Warns of $60/bbl mean reversion by year-end. |
|
Morningstar |
$128.00 |
Hold: Cites Peak War Hype and thematic volatility. |
How to Trade S&P Oil & Gas ETF (XOP) on BingX TradFi
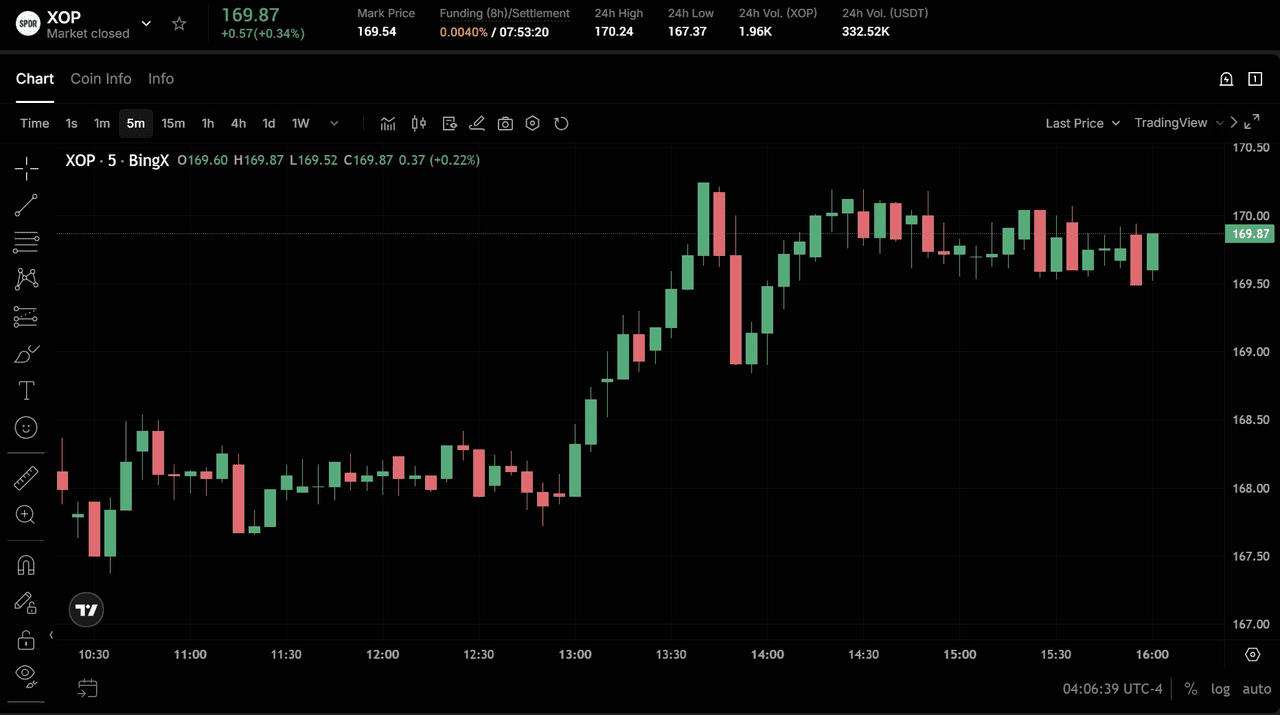
XOP/USDT perpetuals on BingX futures market
Maximize your precision in the energy market by leveraging BingX AI integrations to identify optimal entry points and using BingX TradFi to hedge your portfolio against geopolitical shocks.
- Access TradFi: Log in to your BingX account, navigate to TradFi, and select Stocks.
- Locate XOP: Search for XOP/USDT perpetual contract to open the trading interface on BingX futures.
- Configure Leverage: Use 2x–5x leverage for a balanced approach to this high-volatility sector.
- Execute Strategy: Select Open Long if you anticipate the blockade continuing, or Open Short to profit from a potential peace deal and price reversal.
- Manage Risk: Set Stop-Loss (SL) at key support levels to protect against a severe crash.
Top 5 Risks to Watch for XOP Investors in 2026
As the energy sector transitions from a cyclical commodity to a strategic geopolitical asset, investors must remain vigilant regarding these five structural and macroeconomic threats to XOP’s 2026 trajectory.
- Geopolitical De-escalation: A sudden diplomatic breakthrough could erase the $20 war premium in crude overnight.
- The Hedge Drag: If oil stays at $110, but producers are hedged at $60, they will post massive non-cash losses in Q2/Q3 earnings.
- Demand Destruction: $5.00/gallon gasoline in the U.S. could trigger a recession, slashing the demand for the very oil XOP holdings produce.
- The OPEC Pivot: If Saudi Arabia decides to flood the market to regain share from U.S. shale, prices could collapse regardless of the Iran conflict.
- Regulatory Friction: Any new U.S. Windfall Profits Tax could cap the upside for the producers held in XOP.
Is State Street SPDR S&P Oil & Gas Exploration & Production ETF (XOP) a Good Buy in 2026?
The SPDR S&P Oil & Gas Exploration & Production ETF (XOP) serves as a high-conviction vehicle for investors seeking maximum beta to the American Energy Moment. With its equal-weight structure, the fund is uniquely positioned to capture the outsized gains of mid-cap drillers during a sustained geopolitical supply shock, a dynamic that cap-weighted energy funds often dilute. For those who view the current Strait of Hormuz blockade not as a temporary spike, but as a long-term structural shift in energy security, XOP remains an effective tool for expressing a directional, unhedged view on triple-digit oil prices.
However, from a tactical standpoint, the fund's 43% YTD surge and the prevailing $114 WTI peak suggest the easy money phase of the trade may be maturing. Neutral market positioning favors a wait-and-see approach, looking for a mean-reversion test of the $160 support level before initiating new long positions. Investors should prioritize the underlying fundamentals of the E&P sector, specifically free cash flow yield and debt-retirement progress, over daily geopolitical headlines to determine if this rally has the structural legs to reach the $210 bull target.
Risk Reminder: Trading thematic energy ETFs involves significant sector concentration and commodity price risk. The oil and gas industry is historically hyper-cyclical and sensitive to unpredictable diplomatic shifts. Always utilize stop-losses, leverage BingX AI for trend confirmation, and ensure this satellite position does not exceed 10% of your total portfolio.
Related Reading
- Crude Oil Price Forecast 2026: $140 War Premium or $60 Surplus Baseline?
- Occidental Petroleum (OXY) Price Prediction 2026: $115 Net-Zero Alpha or $55 Commodity Trap?
- Exxon Mobil (XOM) Price Prediction 2026: $180 Energy Alpha or Geopolitical Value Trap?
- Cheniere Energy (LNG) Price Prediction 2026: $330 Sovereign Boom or $210 Infrastructure Trap?
- Energy Select Sector SPDR ETF (XLE) Prediction 2026: $65 Energy Supercycle or the $40 Hormuz Hedge Exit?
- Roundhill Memory ETF (DRAM) Forecast 2026: $1.5B AI Supercycle or 'RAMmageddon' Trap?