A bull flag pattern is a bullish continuation chart pattern consisting of two parts: a sharp price rise called the flagpole, followed by a brief consolidation where price drifts slightly downward within two parallel trendlines called the flag. When price breaks above the upper boundary of the flag on increased volume, it signals the uptrend is resuming. The bull flag is one of the most reliable continuation signals in crypto technical analysis, commonly used by traders to time long entries and project upside price targets.
In this guide, you will learn exactly how to identify a bull flag, understand the market psychology behind it, distinguish it from a bear flag and bull pennant, and apply a step-by-step trading strategy with real Bitcoin chart examples on BingX.
What Are Flag Patterns in Crypto Trading?
A flag pattern is a short-term consolidation that appears after a sharp price movement known as the flagpole. It reflects a temporary pause in the market before the trend resumes in the same direction. The pattern resembles a small rectangle or parallelogram, shaped by two parallel trendlines that slope slightly against the prevailing trend.
In technical analysis, flag formations are classified as either bullish or bearish depending on whether they occur in an uptrend or a downtrend.
What Are the Key Components of a Flag Pattern?
- Flagpole: The initial strong price movement.
- Flag: The consolidation phase is bounded by parallel lines.
- Breakout point: Where price exits the flag to resume the main trend.
Unlike reversal patterns, which signal a trend change, continuation patterns like flags indicate the existing trend is likely to continue.
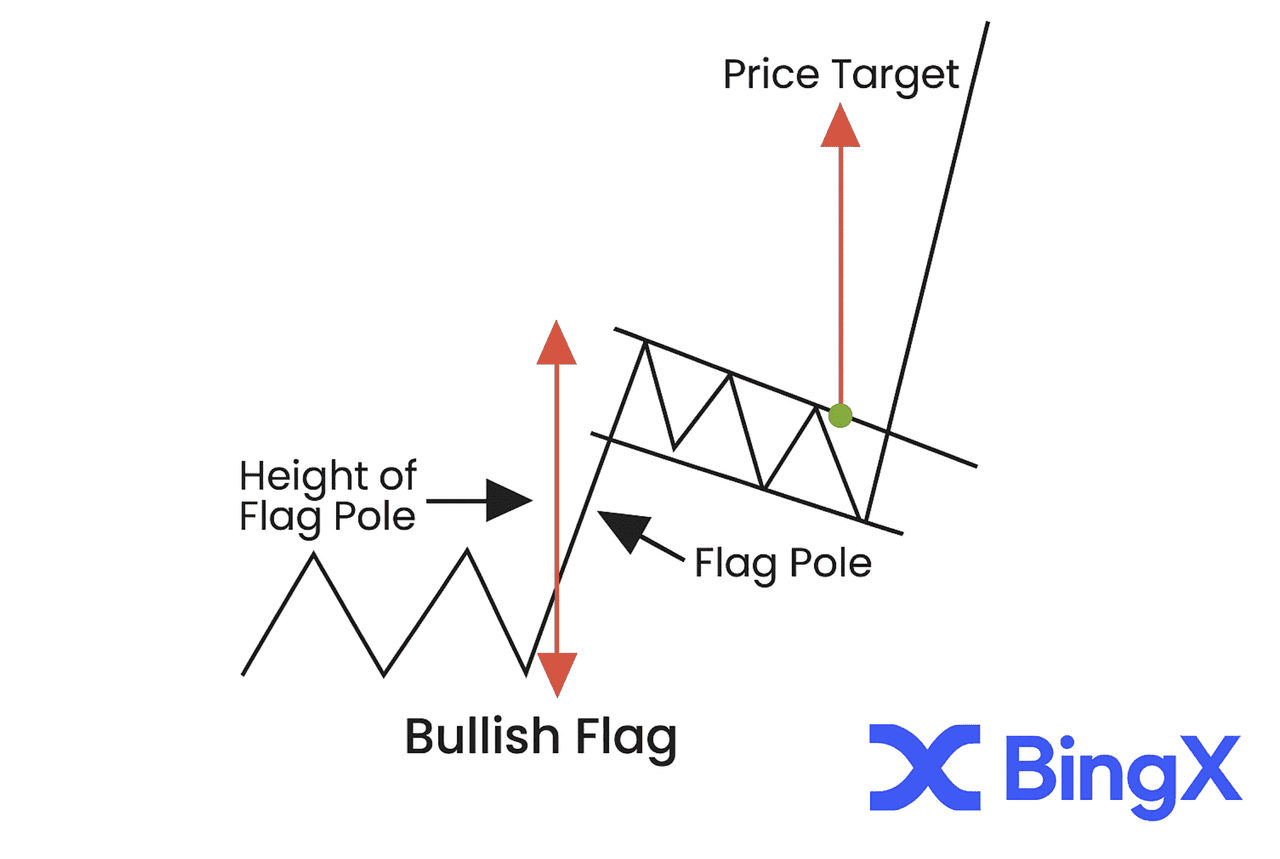
What Is a Bull Flag Pattern?
A bull flag pattern forms during an upward trend when prices surge sharply, pause briefly in a downward-sloping channel, and then continue higher. It begins with an impulsive rise called the flagpole, created by strong buying pressure pushing price upward in a short time.
Following this move, the market enters a mild consolidation known as the flag, which slopes slightly downward and is confined by two parallel trendlines. This stage represents a period where early buyers take profits while the broader bullish momentum remains intact. It is not a reversal, it is a healthy pause.
A bull flag breakout occurs when price moves above the upper trendline, confirmed by increased trading volume. This signals renewed bullish momentum and continuation of the uptrend.
Example:
- Flagpole: A rapid 15% price surge in Bitcoin over 2–3 candles.
- Flag: A tight 3–5% downward drift forming a narrow parallel channel, volume decreasing throughout.
- Breakout: Price closes above the upper trendline with volume expansion, confirming bullish continuation.
The bullish flag pattern helps traders identify strong market momentum and plan entries before the next upward wave.
How to Identify a Bull Flag: 5-Step Checklist
Before acting on any bull flag setup, confirm all five steps:
Step 1: Confirm a Clear Uptrend
The flagpole must be a sharp, near-vertical rally of at least 10%. The more decisive and fast the move, the stronger the pattern.
Step 2: Identify the Flag Consolidation
After the rally, price should drift downward in a narrow channel. Draw two parallel trendlines — one along the highs, one along the lows of the consolidation.
Step 3: Confirm Volume Decreases During the Flag
Volume must fall during the consolidation. This shows the pullback is profit-taking, not distribution. Rising volume during the flag is a warning sign.
Step 4: Wait for the Confirmed Breakout
Never enter during the flag. A valid breakout is a candle that closes above the upper trendline on higher volume.
Step 5: Confirm Volume Spikes on the Breakout
The breakout candle should show a clear volume spike above the average during the flag phase. This confirms buyers are returning with conviction.
How to Trade a Bull Flag Setup
A bull flag forms when the market rises sharply, pauses for a brief pullback, and then continues higher. In the chart below, Bitcoin formed a clear bull flag following a strong rally. The flagpole represented a rapid price surge, followed by a downward consolidation channel.
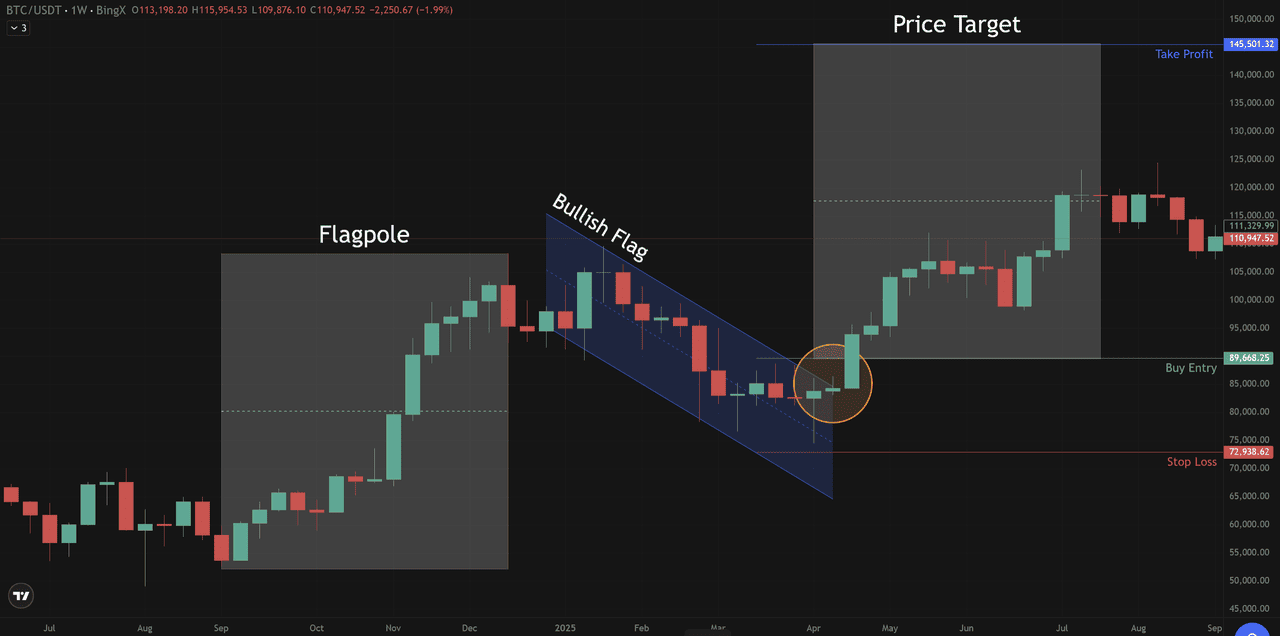
Bull flag trade chart Bitcoin (BTC/USD) Price Chart- Source: BingX
The breakout candle signaled a buy entry near $89,668 with a stop-loss at $72,938 and a projected take-profit around $145,501, aligning with the flagpole's measured move target.
Entry: Just above the breakout candle's close, once it has closed above the upper trendline.
Stop-loss: Below the lower trendline of the flag, protects capital if the breakout fails.
Take-profit: Project the flagpole's height upward from the breakout point.
Risk-to-reward: Target a minimum 1:2 ratio, for every $1 risked, aim for at least $2 in return.
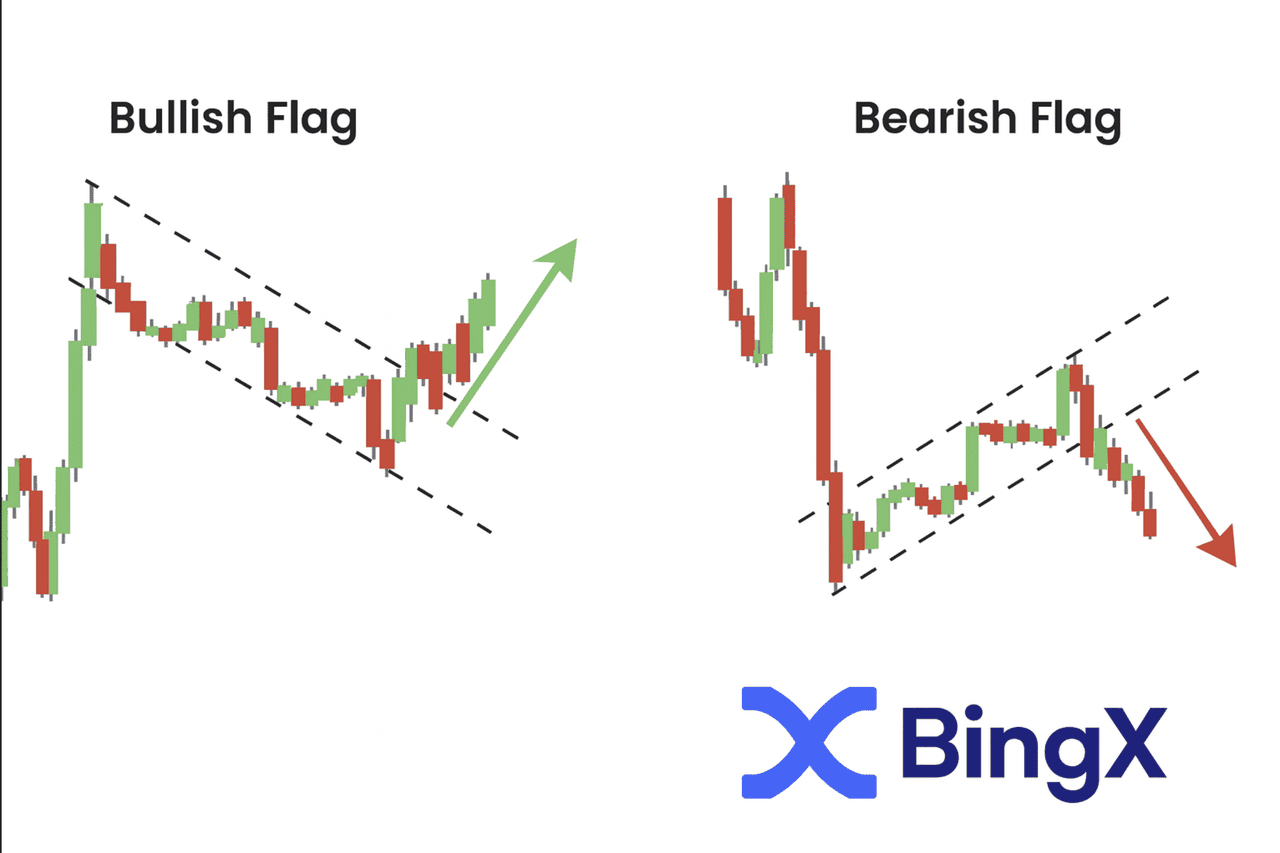
Bull Flag vs Bear Flag: Key Differences
The bull flag and bear flag are mirror images. The same consolidation structure signals completely opposite outcomes depending on the preceding trend.
|
Feature |
Bull Flag |
Bear Flag |
|
Preceding trend |
Uptrend |
Downtrend |
|
Flagpole direction |
Sharp rise ↑ |
Sharp drop ↓ |
|
Flag slope |
Slightly downward ↓ |
Slightly upward ↑ |
|
Breakout direction |
Above upper trendline ↑ |
Below lower trendline ↓ |
|
Trading signal |
Long / buy |
Short / sell |
|
Volume during flag |
Decreases |
Decreases |
|
Volume at breakout |
Spikes |
Spikes |
Bull Flag vs. Bull Pennant: What's the Difference?
Both are bullish continuation patterns that follow a sharp rally, but their consolidation shapes differ.
|
Feature |
Bull Flag |
Bull Pennant |
|
Consolidation shape |
Rectangular parallel channel |
Converging triangle |
|
Trendlines |
Parallel throughout |
Converge toward a point |
|
Duration |
Slightly longer |
Shorter, forms quickly |
|
Volume during consolidation |
Decreases |
Decreases |
|
Breakout trigger |
Close above upper trendline |
Close above upper trendline |
The rule: If the consolidation trendlines are parallel → bull flag. If they converge toward a point → bull pennant. Both signal bullish continuation and are traded identically.
How to Combine the Bull Flag With Technical Indicators
Using the bull flag in isolation can lead to false signals, especially in volatile crypto markets. Combining it with Relative Strength Index (RSI) and Moving Average Convergence Divergence (MACD)significantly improves accuracy and helps you identify the right moment to enter and exit.
1. RSI Confirmation
For a bull flag, check that RSI is below 70 (not overbought) at the time of the breakout. This means there is still room for further upside before the market becomes stretched.
If RSI is already above 70 when the flag forms, be cautious, overbought conditions can trigger sharp pullbacks that invalidate the breakout. In that case, consider reducing your position size or waiting for RSI to pull back below 65 before entering.
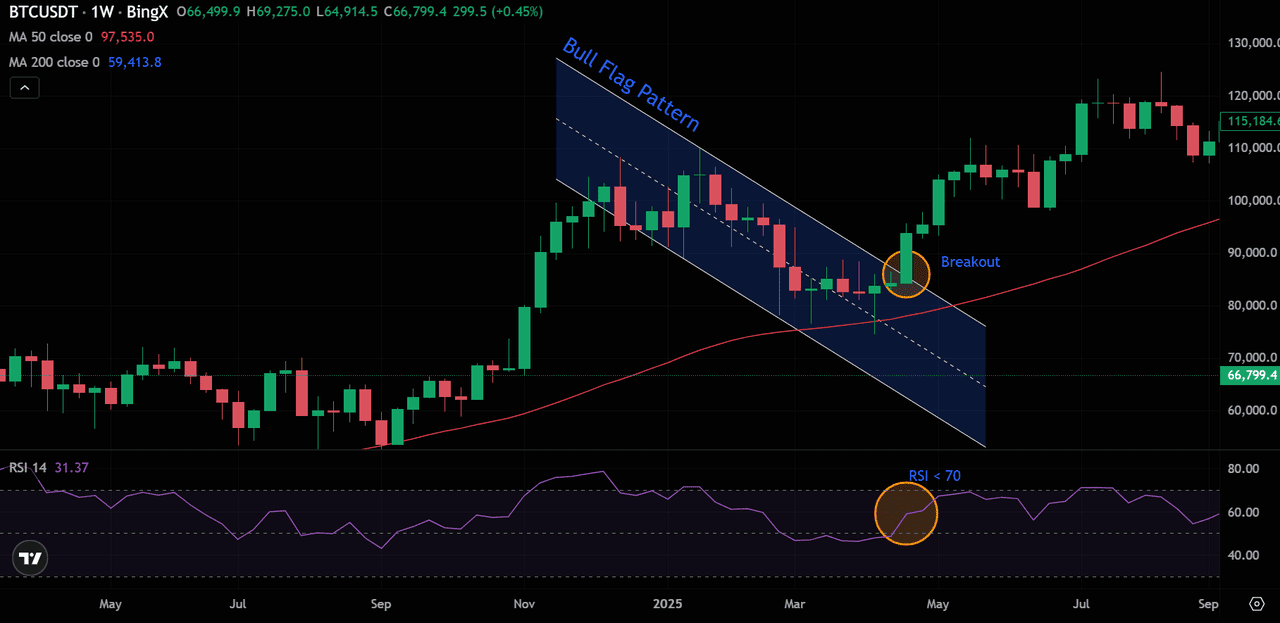
Bitcoin (BTC/USD) Price Chart - Source: BingX
What to look for: RSI between 50–65 at the point of breakout = healthy bullish momentum with room to run. This is the ideal RSI zone for a bull flag entry.
2. MACD Confirmation
A bullish MACD, where the MACD line is above the signal line and the histogram bars are positive and growing, confirms that buying momentum supports the bull flag trade.
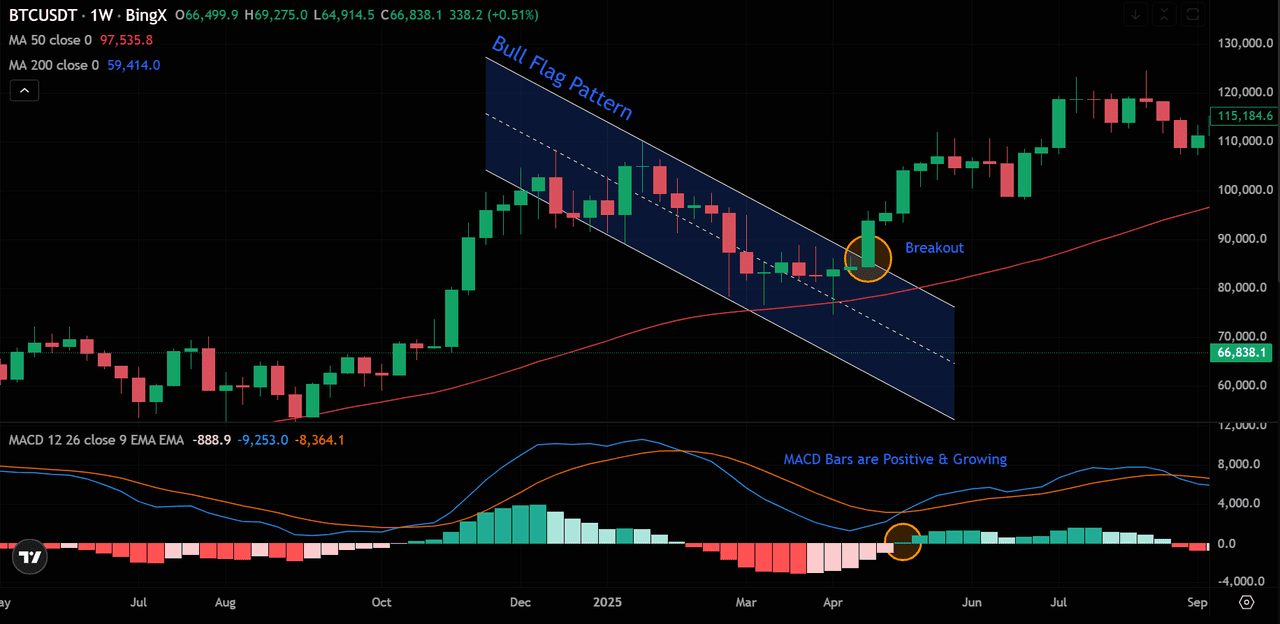
Bitcoin (BTC/USD) Price Chart - Source: BingX
If the MACD histogram starts shrinking or turns negative during the flag consolidation, momentum may be weakening. In this case, wait for the histogram to turn positive again on the breakout candle before entering.
What to look for: Positive MACD histogram on the breakout candle = momentum confirming the upside move.
This insight helps investors adjust expectations, secure profits earlier, and avoid unnecessary exposure when technical analysis suggests that a trend reversal is underway.
How to Trade Bull Flags on BingX
- Open BingX and select your crypto pair. Switch to the daily or 4-hour timeframe for the most reliable signals.
- Identify the flagpole: confirm a sharp rally of at least 10% over a small number of candles.
- Draw the flag: Connect the highs and lows of the downward consolidation with two parallel trendlines.
- Monitor volume: Confirm it decreases steadily during the flag phase.
- Wait for the breakout: Only act once a candle has closed above the upper trendline.
- Set your entry: Place a buy order just above the breakout candle's high.
- Set your stop-loss: Below the lower flag trendline.
- Set take-profit: Project the flagpole height upward from the breakout point. Consider partial exits at each key resistance level.
How to Manage Risk and Set Profit Targets
Effective risk management is essential when trading flag setups.
- Place your stop-loss just below the lower flag trendline to protect against a failed breakout.
- Use the flagpole's length as your minimum price target, projected upward from the breakout point.
- Aim for a minimum 1:2 risk-to-reward ratio, every $1 risked should target at least $2 in return.
- Consider partial profit-taking at intermediate resistance levels rather than holding for the full target. This locks in gains if momentum fades before the full move completes.
- Keep position size consistent with your account balance, never overexpose to a single setup.
Confluence Checklist
- Clear uptrend with a sharp flagpole (10%+ rally)
- Flag slopes slightly downward (counter-trend)
- Volume decreases steadily during flag consolidation
- RSI is below 70, not overbought
- MACD histogram is positive or neutral, no bearish crossover
- Breakout candle closes above the upper trendline
- Breakout volume spikes above average
- Stop-loss placed below the lower flag boundary
Common Mistakes When Trading Bull Flag Patterns
Avoid these common mistakes when trading bull flag patterns to improve accuracy, manage risk effectively, and prevent costly false breakout trades.
- Entering before the breakout is confirmed: The most costly mistake. Entering during the flag consolidation exposes you to the full loss if price breaks downward instead of upward. Always wait for a candle to close above the upper trendline.
- Chasing the breakout: If you miss the initial breakout candle, do not enter 5–10% above the flag. Wait for a pullback to the old upper trendline (now acting as support) and enter on the retest. This gives a lower-risk entry with a tighter stop-loss.
- Ignoring volume during the flag: Rising volume during flag consolidation suggests sellers are actively distributing, not healthy. Valid bull flags show decreasing volume throughout the flag and a spike only on the breakout.
- Setting a stop-loss too tight: Crypto volatility means wicks frequently pierce slightly below support before the move continues. A stop-loss placed too close to the entry will get hit by normal noise. Place it below the entire flag structure, not just the most recent candle.
- Relying on the pattern alone: Combine the bull flag with at least one confirming indicator. RSI below 70, positive MACD histogram, or a volume spike on the breakout, to filter false signals.
Conclusion
The bull flag pattern is one of the most consistent continuation signals in crypto, clear in structure, logical in psychology, and tradeable with well-defined risk parameters. The three non-negotiable rules: wait for the breakout candle to close above the upper trendline, always set a stop-loss below the lower flag boundary, and use the flagpole projection to set your target.
Combine this pattern with RSI and MACD to filter false breakouts and identify the highest-probability entries. If you miss the initial breakout, wait for a retest of the breakout level rather than chasing price. Practice identifying bull flags on BingX's charting tools across hundreds of crypto pairs in live market conditions.
Related Reading
- Ascending Triangle Pattern Strategies in Crypto Trading
- Understanding the Symmetrical Triangle Pattern in Crypto Trading
- How to Use Moving Average Convergence Divergence (MACD) in Crypto Trading
- How to Use the Evening Star Pattern to Predict Market Trends in Crypto Trading
- Mastering Candlestick Charts in Cryptocurrency Trading: A Complete Guide
- 10 Common Technical Analysis Mistakes in Crypto Trading (And How to Avoid Them)
- Simple Moving Average(SMA) vs Exponential Moving Average(EMA) in Crypto Trading: Differences to Know
FAQs on Bull and Bear Flag Chart Patterns
1. What is a flag pattern in crypto trading?
A flag pattern is a short-term consolidation that occurs after a sharp price move, forming a small rectangular channel. It signals a pause before the trend continues in the same direction.
2. How can I tell if a flag is bullish or bearish?
A bullish flag forms after an uptrend and slopes slightly downward, while a bearish flag forms after a downtrend and slopes slightly upward. The direction of the breakout confirms the pattern type.
3. How do I confirm a flag breakout?
A breakout is confirmed when the price closes outside the flag boundary with higher trading volume. Additional confirmation can come from indicators like RSI or MACD showing momentum alignment.
4. Which technical indicators work best with flag patterns?
Indicators such as the Relative Strength Index (RSI), MACD, and moving averages help validate breakout strength and detect early reversals, reducing the risk of false signals.
5. What’s the best strategy to trade flag patterns safely?
Wait for a confirmed breakout, set a stop-loss beyond the opposite flag boundary, and use partial profit targets at support or resistance levels to manage risk and secure gains.
