


Gold trading sits at the intersection of capital preservation and active speculation in 2026. After surging more than 60% in 2025 and testing new all-time highs near $5,300 per ounce, gold has re-established itself as both a core hedge and a high-liquidity trading instrument. Few global assets now combine safe-haven demand, deep liquidity, and sustained volatility as consistently as gold, making it attractive to both long-term allocators and short-term traders.
Periods of market stress, falling real yields, currency instability, and geopolitical shocks continue to drive sharp moves in gold prices, often outside traditional trading hours. At the same time, record participation from central banks, ETFs, and derivatives markets has increased intraday and multi-week price swings, creating clear opportunities for day trading, swing trading, and portfolio hedging. In 2026, understanding how to trade gold is no longer optional for macro-focused traders but is also a core skill for managing risk and capturing volatility in uncertain markets.
What Is Gold (XAU/USD) and What Makes It an Attractive Investment?
XAU/USD is the price of one troy ounce of gold quoted in US dollars, making gold highly sensitive to US monetary policy, real interest rates, and dollar flows. Gold typically strengthens when the dollar weakens, real yields fall, inflation threatens purchasing power, or markets shift from risk-on to risk-off amid geopolitical stress. As a result, gold trading activity tends to increase during uncertainty, not calm markets, with XAU/USD often acting as a real-time barometer of global risk sentiment.
Why Is Gold Rallying and Making New Highs in 2026?
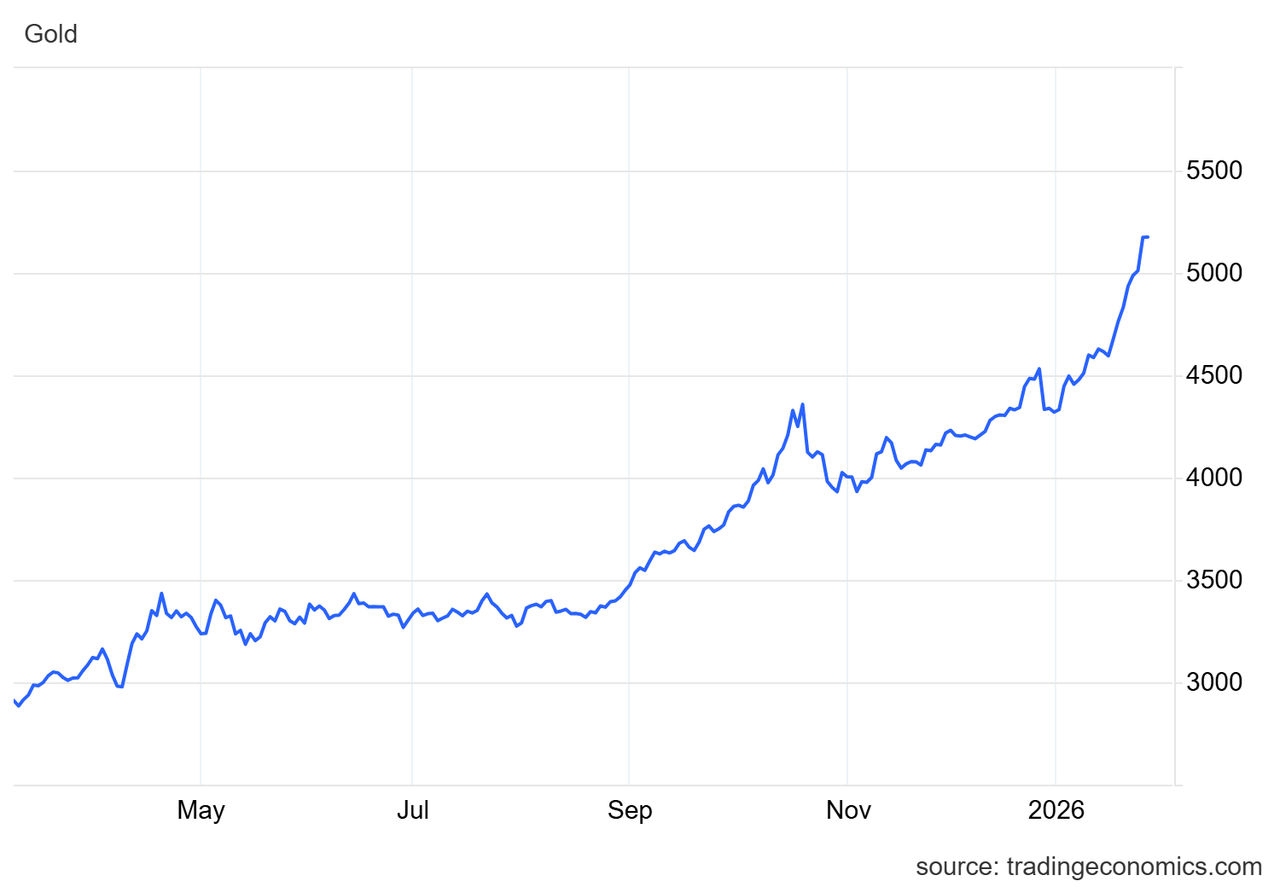
Gold Historical Price Chart - Source: Tradingeconomics
Gold’s strength in 2026 reflects a continuation of the same macro forces that powered its historic 2025 rally, rather than a new speculative phase. After rising about 65% in 2025, from roughly $2,600 to $4,550 per ounce, gold decisively broke above $5,200 in January 2026 and has been trading near $5,300/oz as late January. This price behavior signals structural demand, not a blow-off top, with former resistance levels now acting as support as investors accumulate at higher valuations than in previous cycles.
The core drivers remain monetary policy, central-bank demand, and the US dollar. Following multiple rate cuts in 2025, the Federal Reserve’s policy rate sits near 3.50–3.75%, keeping real yields constrained and supporting non-yielding assets like gold. Central banks purchased roughly 845 tonnes of gold in 2025, one of the strongest years on record, reinforcing long-term demand as countries diversify away from USD reserves. Inflation has cooled, but sticky core inflation continues to cap real yield upside, while a softer Dollar Index (DXY) near the 98–99 range has further underpinned gold prices.
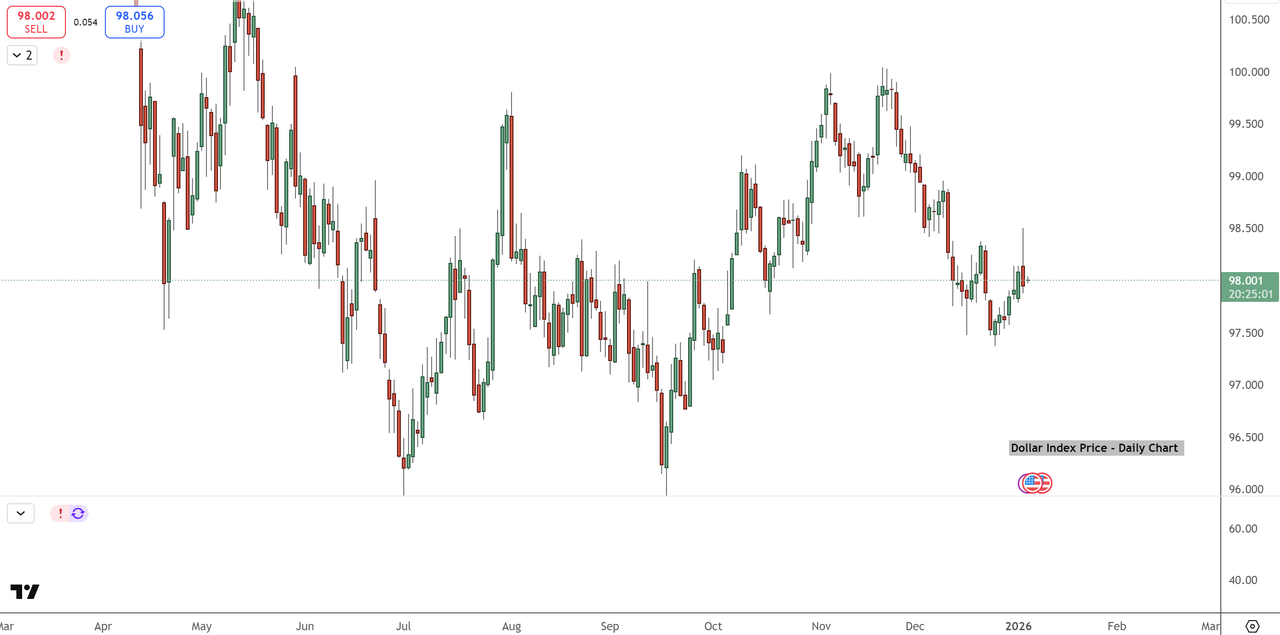
Dollar Index Price Chart - Source: Tradingview
Investment flows add another layer of support. Physically backed gold ETFs attracted about $38 billion in net inflows in 2025, the strongest in five years, lifting holdings to multi-year highs. Combined with persistent geopolitical risk and ongoing official-sector buying, these dynamics explain why gold remains both a defensive hedge and a momentum-driven trading asset in 2026, even as volatility and periodic pullbacks are likely along the way rather than a straight-line move higher.
Gold Price Outlook 2026 Market Consensus: What the Data Shows
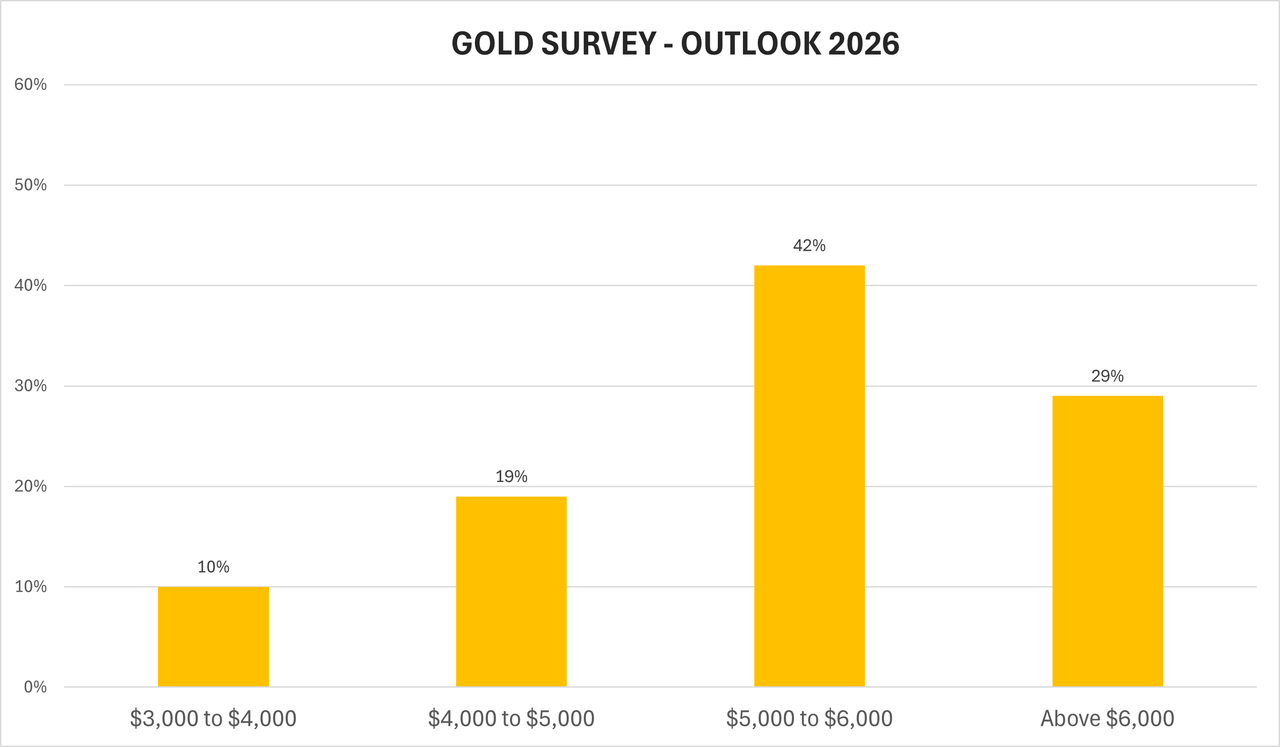
Kitco News Annual Gold Survey - Source: Kitco
Market expectations for gold in 2026 have shifted materially higher following gold’s decisive breakout above $5,000/oz in January. Recent forecasts from major institutions now cluster well above prior consensus: Goldman Sachs targets $5,400 by end-2026, J.P. Morgan expects prices to average around $5,055 in Q4 2026, and Bank of America projects gold reaching $6,000 as early as spring 2026 under continued macro stress. Even more conservative banks still keep gold firmly above pre-2024 levels, reinforcing the view that gold has undergone a structural repricing, not a temporary spike.
Investor positioning supports this higher range. Gold ETFs absorbed $72–89 billion of net inflows in 2025, or around 670–800 tonnes, the strongest inflow year since 2020, yet total holdings remain below historical peaks, indicating demand strength without full saturation. Retail sentiment mirrors this shift: surveys show a clear majority now expecting $5,000–$6,000+ gold in 2026, with downside scenarios increasingly viewed as shallow and short-lived.
Central banks remain the dominant anchor. Official purchases reached roughly 845 tonnes in 2025, and updated projections for 2026 range from around 755 tonnes to as high as 1,100 tonnes, led by emerging-market reserve diversification away from the US dollar. Because this demand is policy-driven rather than price-sensitive, it creates a durable floor under gold prices. Taken together, the latest forecasts suggest gold in 2026 is less about whether it can hold $5,000, and more about how far above it prices can sustainably trade if macro and geopolitical pressures persist.
What Are the Most Popular Strategies for Trading Gold in 2026?
Gold trading in 2026 is defined less by the instrument and more by how traders use gold to respond to volatility, macro risk, and portfolio exposure. With gold holding above $5,200/oz and price swings driven by rates, geopolitics, and currency moves, three strategies dominate: day trading, swing trading, and smart hedging.
Day trading focuses on short-term price moves driven by intraday volatility, often around US economic data, Fed communication, or geopolitical headlines. Swing trading targets multi-day or multi-week moves as gold trends between support and resistance during shifts in rate expectations or dollar strength. Smart hedging uses gold as a defensive overlay, reducing portfolio drawdowns during risk-off periods, equity sell-offs, or currency weakness, rather than as a pure directional bet. Together, these strategies reflect gold’s dual role in 2026 as both a high-liquidity trading asset and a strategic risk-management tool.
1. Day Trading Gold to Capture Short-Term Price Movement
Day trading gold works because gold consistently produces large intraday ranges compared to most forex pairs, making it ideal for intraday trading strategies. In 2025, it was common for XAU/USD to move at $25–50 per ounce in a single session, driven by dollar moves, bond yields, and macro headlines. That level of price volatility creates repeatable short-term trading opportunities.
Effective day trading strategies focus on capitalizing on high intraday volatility, especially during the London-New York session overlap.
Liquidity is concentrated in specific hours. The most reliable moves occur during:
• The London session, when European liquidity enters. The best times to trade gold are during the London session and the first 90 minutes after the New York market opens.
• The New York session, particularly the first 60–90 minutes after the US open, when futures, ETFs, and macro traders are most active. Outside these windows, gold often slows and becomes less predictable.
Liquidity is concentrated in these specific hours, with the most reliable price moves occurring during the London and New York sessions.
Best Gold Day Trading Strategies
Optimizing day trading strategies involves adjusting key strategy parameters, such as entry and exit rules, to suit current market conditions. The most reliable time for trading gold is usually within the first 90 minutes after the New York market opens.
Two intraday approaches dominate gold trading:
Option 1: Breakout Trading, Momentum Setup
Used when gold is coiling near a key level.
• Identify session highs/lows or prior day levels
• Wait for price to break with strong momentum
• Enter on the breakout or on a shallow pullback
• Targets are usually 2–3x risk, with tight stops
In the chart below, gold spent several sessions consolidating inside a defined range between roughly $3,900 and $4,025, forming a clear balance zone where buyers and sellers were evenly matched. This type of compression often precedes strong directional moves.
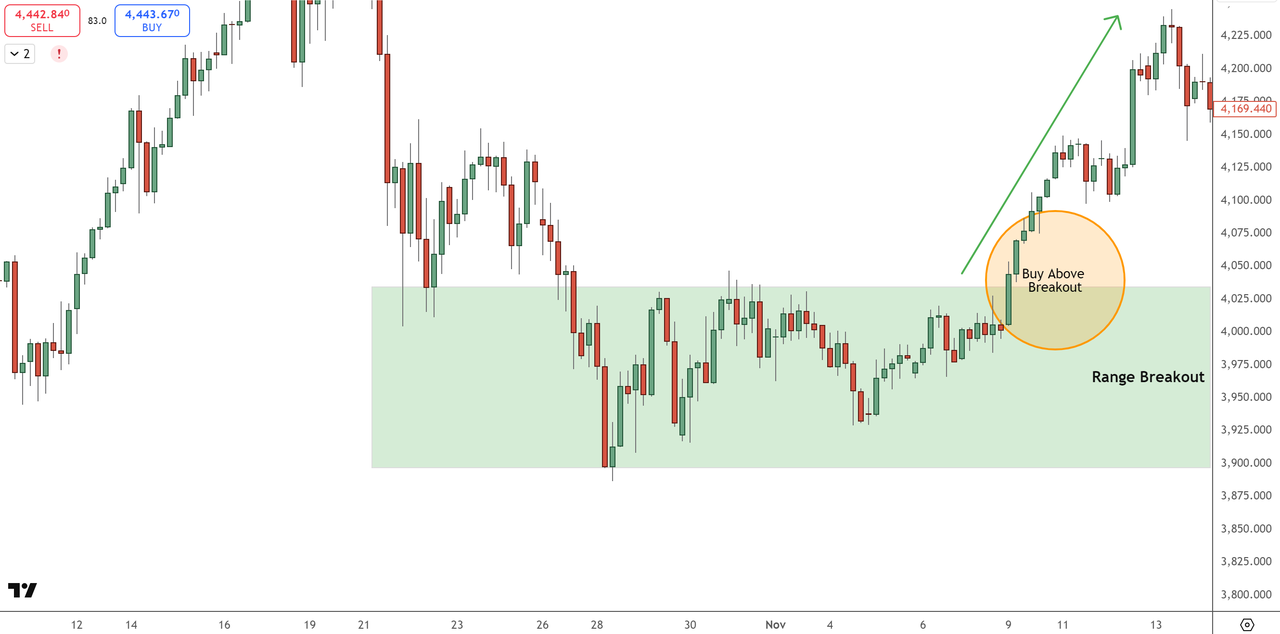
Gold (XAU/USD) Price Chart - Source: Tradingview
• The range high near $4,025–$4,030 acted as key resistance, repeatedly capping price.
• During the New York session, gold broke above $4,030 with strong bullish candles, signaling fresh momentum rather than a false spike. A sharp rise in price, often driven by strong market drivers, can create a fair value gap—a price imbalance visible on the candlestick chart. Smart money, or institutional traders, often engineer these moves by absorbing liquidity and creating optimal entry points, which is central to smart money concepts trading methodology.
• A breakout entry was triggered above the range high, as highlighted by the “Buy Above Breakout” zone on the chart.
• After the breakout, gold accelerated quickly toward $4,150–$4,200, delivering a clean momentum move.
Identifying fair value gaps and understanding smart money concepts can help traders spot high-probability breakout setups by revealing where institutional activity is likely to drive price action.
Risk and trade management:
• Stop-loss is typically placed back inside the range, just below $4,000.
• With a $25–$30 risk, upside targets of $60–$80 offer a 2–3x risk-to-reward profile.
This setup works best on high-liquidity sessions or news days (CPI, NFP, Fed speakers), when volume expands and breakouts are more likely to follow through instead of fading.
Option 2: Range Trading, Mean Reversion Setup
This trading strategy is used after a strong move when gold stalls.
• Mark clear intraday pivot point, support and resistance
• Buy near support, sell near resistance
• Avoid trading the middle of the range
• This works best during low-news, balanced sessions.
Gold (XAU/USD) Price Chart - Source: BingX
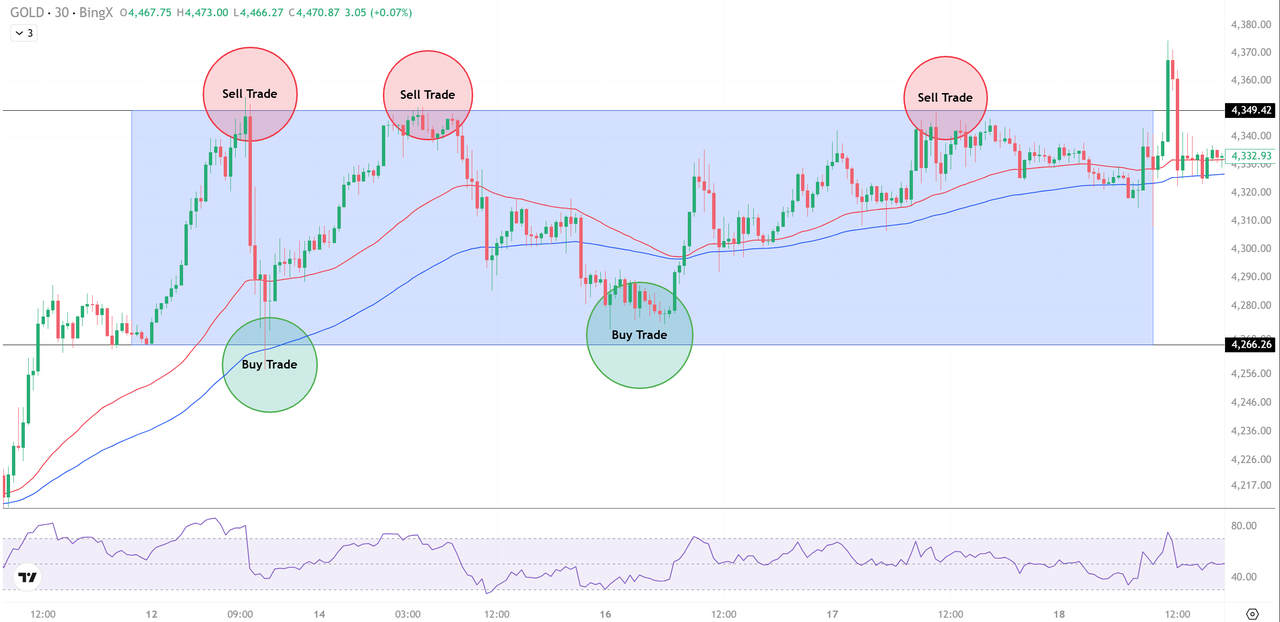
In this example, gold entered a clear consolidation phase after a strong rally, trading inside a well-defined range between roughly $4,266 support and $4,349 resistance (highlighted by the shaded zone). During this phase, momentum slowed and price repeatedly reverted back toward the middle of the range rather than trending.
How the range trades were executed:
• Sell trades were taken near the upper boundary, around $4,340–$4,350, where prices repeatedly stalled and rejected.
• Buy trades were executed near range support around $4,265–$4,275, where downside moves consistently failed.
• The middle of the range ($4,305–$4,315) was avoided, as risk-to-reward is poor when price lacks directional bias.
Trade management logic:
• Stops are placed just outside the range, above resistance for shorts or below support for longs.
• Targets aim for the opposite side of the range, typically offering 2:1 or better risk-to-reward.
Range trading works best during low-news sessions, when volatility is contained and gold respects technical levels rather than breaking out impulsively.
2. Swing Trading Gold to Trade the Gold Trend
This swing trading strategy aims to capture multi-day to multi-week moves in gold by aligning technical structure with macro conditions. Swing trading strategies may involve both buying and selling gold, allowing traders to capitalize on both upward and downward price movements over multiple days. It works best in clear trending markets and should be avoided during choppy or range-bound price action.
Step 1: Define the Gold Trend in a Higher Timeframe
Every swing trade starts by identifying the trend on a daily or 4-hour chart, where noise is reduced and structure is clearer.
A bullish gold trend has three key features:
• Higher highs and higher lows
• Price holding above the 50- and 100-period moving averages
• Pullbacks that find buyers near those averages
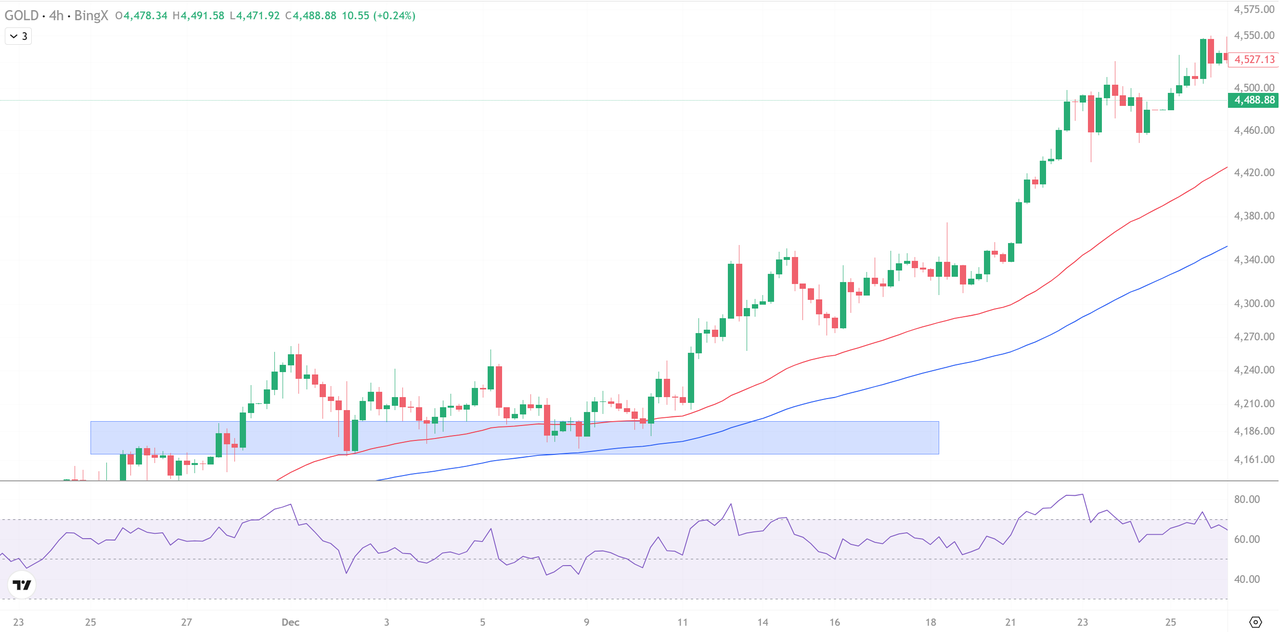
Gold (XAU/USD) Price Chart - Source: BingX
In the example above, gold consolidated around $4,170–$4,200, then held above rising moving averages before rallying toward $4,500–$4,550. This type of structure allows swing traders to enter pullbacks with defined risk. A bearish trend shows the opposite: lower highs, lower lows, and failed rebounds below falling averages.
Rule: Only take long swing trades when gold holds above rising moving averages. If the trend isn’t clear, don’t trade.
Step 2: Confirm Macro Alignment
Trends last longer when macro conditions support price structure.
Key checks:
• US Dollar Index (DXY): In 2025, gold rallied as DXY fell from above $105 to $98–$99
• Rates and yields: Falling real yields or rate-cut expectations support gold
• Risk sentiment: Equity stress or geopolitical tension strengthens demand
Rule: If the dollar strengthens or yields rise sharply, reduce exposure or stand aside.
Step 3: Identify High-Probability Swing Entries
With trend and macro aligned, drop to the 4-hour chart and wait for pullbacks.
• Typical retracements range $80–$150
• Look for support zones, moving averages, and rejection candles
• Avoid chasing prices after extended breakouts.
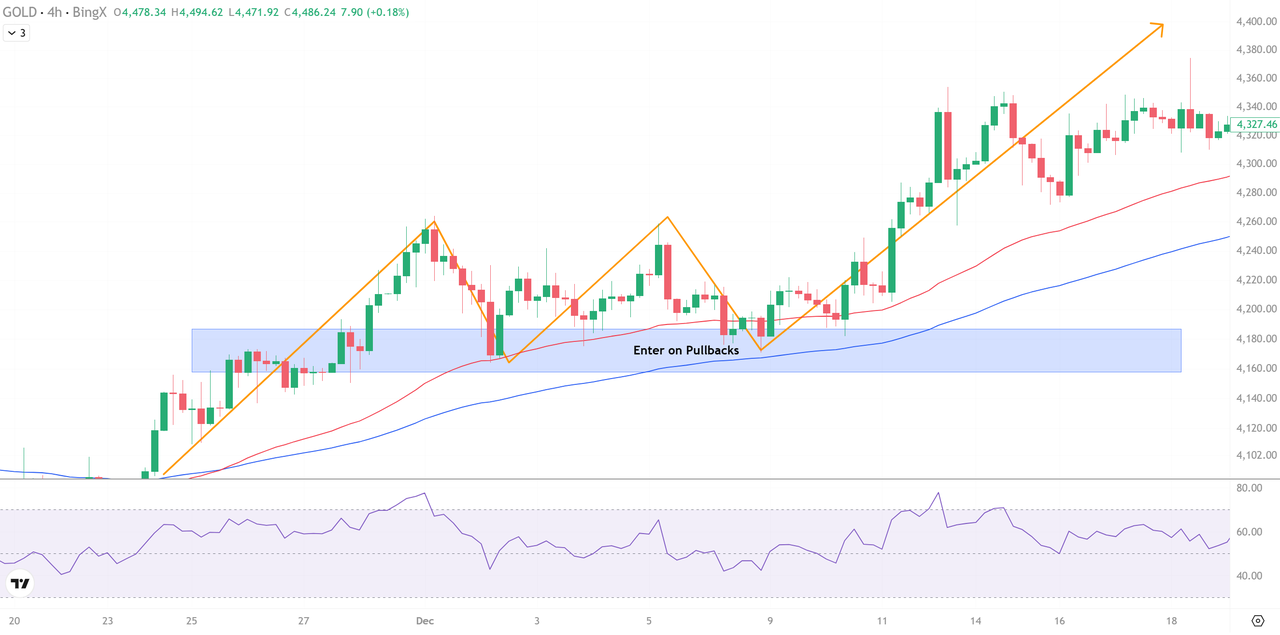
Gold (XAU/USD) Price Chart - Source: BingX
Avoid chasing breakouts after extended runs. Late entries usually offer poor risk-to-reward and increase the chance of being caught in a deeper correction.
Step 4: Structure Risk and Trade Management
Swing trades require room to breathe. Stops are placed below the most recent swing low or structural support, typically risking $60–$120, depending on volatility.
Targets are set at:
• Prior highs
• Measured trend extensions
• Key psychological levels
Traders should set take profit levels at key liquidity pools or major order blocks, and consider using trailing stops to secure gains as the trade moves in their favor.
A minimum 2:1 risk-to-reward is required, with 3:1 preferred in strong trends. Trades are held across multiple sessions and remain open through scheduled data releases.
It is important to implement risk management parameters, such as setting stop-loss orders, to mitigate potential losses.
Step 5: Define Clear Exit Conditions
Exits are triggered by structure, not emotion. Close the trade if:
• Gold closes below key trend support on the daily chart
• Macro drivers reverse decisively, such as a sharp dollar rally
• Momentum fades after an extended move, signaling exhaustion
This disciplined exit process protects capital while allowing winners to run.
3. Smart Hedging with Gold in Volatile Markets
Not every gold position needs to be directional. In volatile markets, gold is often used as a hedging tool to reduce risk when other assets come under pressure. This approach becomes especially relevant during stock market drawdowns or periods of stress in the forex market.
Option 1: Hedging During Stock Market Sell-Offs
When equity markets fall sharply, gold often behaves differently from risk assets. The chart above illustrates this clearly. Since the early 2000s, gold has gained roughly +1,500%, while the S&P 500 is up about +500% over the same period. More importantly, gold’s strongest relative performance occurred during periods when equities faced repeated drawdowns and elevated volatility.
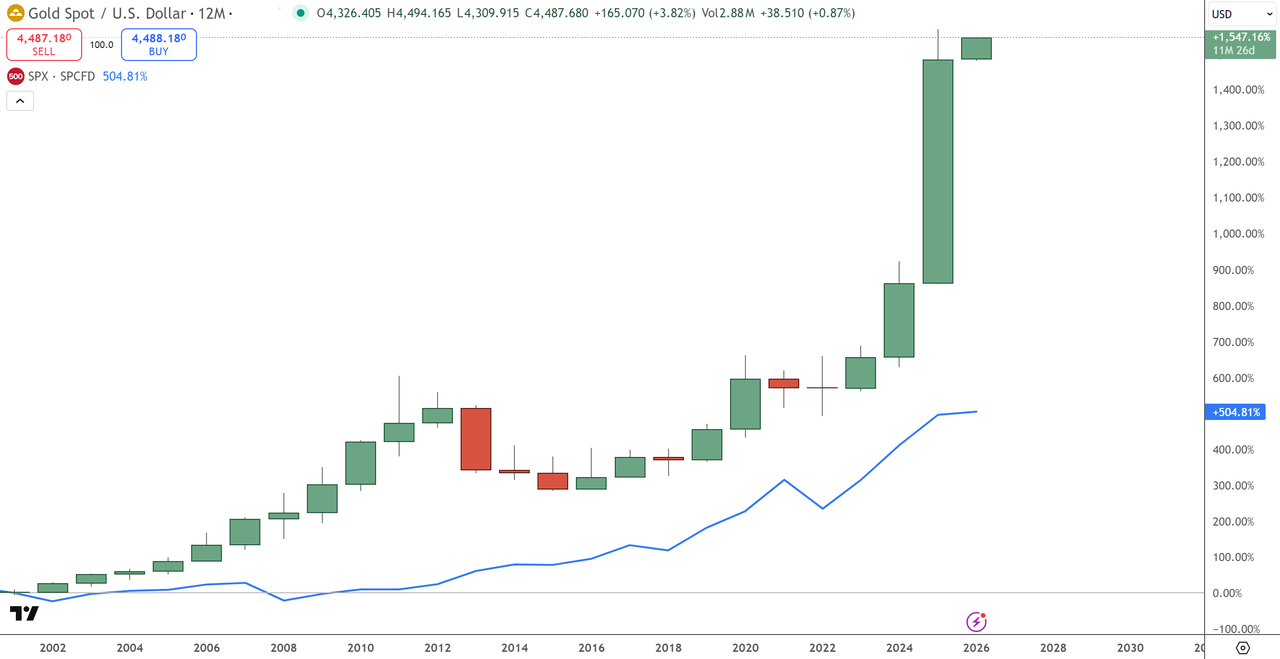
Gold (XAU/USD) and S&P500 (SPX) Comparison - Source: Tradingview
During typical stock market sell-offs of 10–20%, investors tend to reduce equity exposure and rotate into defensive assets. This shift helps explain why gold has often remained stable or moved higher while equities struggled, reinforcing its role as a hedge rather than a high-risk trade.
For traders, this creates a practical risk-management tool. Instead of exiting equity positions during market stress, exposure can be partially offset by adding a long gold CFD or futures position. If equities continue to decline, gains in gold can help reduce overall portfolio drawdowns.
How traders typically hedge with gold:
• Add a small long gold position when equity volatility rises
• Keep hedge size smaller than core equity exposure
• Reduce the hedge once stock markets stabilize
This approach focuses on balancing risk, not predicting market tops or bottoms.
Option 2: Hedging Forex Market Stress
Gold is commonly used to hedge currency risk, particularly during periods of US dollar weakness. The chart above shows this clearly. Since the early 2000s, gold has risen by over 1,500%, while the US Dollar Index (DXY) is down around 15%, highlighting gold’s role as an alternative store of value when fiat currencies weaken.
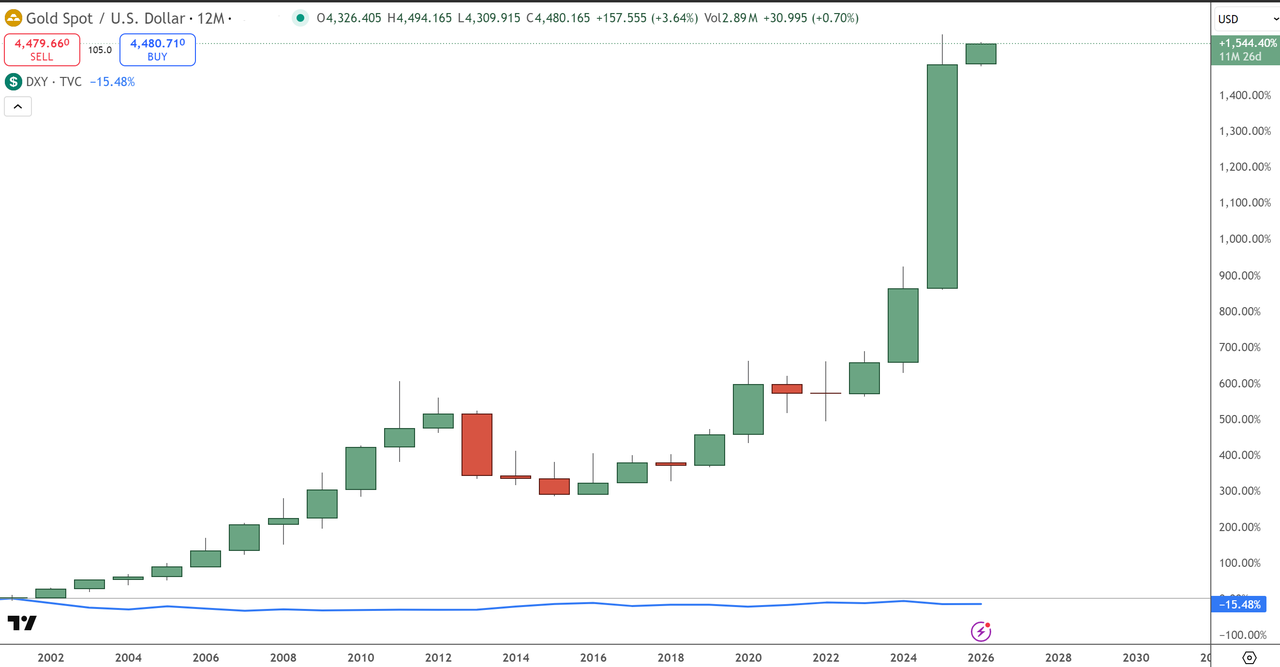
Gold (XAU/USD) and Dollar Index (DXY) Comparison - Source: Tradingview
As the dollar declines, gold typically attracts demand, helping traders offset FX-related risk. This is especially useful during periods of elevated volatility across major and emerging-market currencies.
How traders hedge FX exposure with gold:
• Use gold CFDs for flexible, short-term hedges
• Use gold futures for larger or longer-term protection
Hedging positions are kept smaller than trading positions and focus on reducing drawdowns rather than generating profits.
How to Start Trading Gold on BingX
BingX lets you trade gold through spot tokenized gold assets like Tether Gold (XAUT) and Pax Gold (PAXG), tokenized gold perpetual contracts, and gold futures, giving beginners and active traders flexible ways to gain gold exposure.
Trade Gold Futures with Crypto on BingX TradFi
To start trading gold-linked futures on BingX, open and fund a trading account, then go to Futures, select USDⓈ-M Perpetual Futures, and search for GOLD. Choose your position size and leverage carefully, then place a long or short trade using market or limit orders.
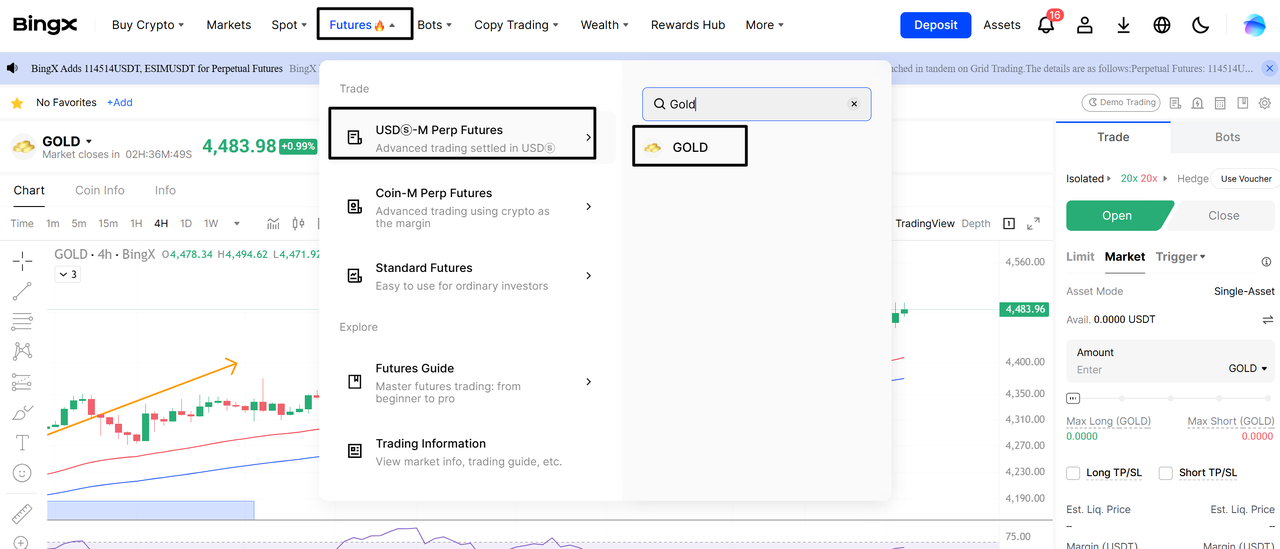
Gold (XAU/USD) Futures - Source: BingX
Beginner mistakes to avoid:
• Using high leverage too early
• Trading without a stop-loss
• Entering trades without a clear plan
Start small, focus on risk control, and learn the platform before scaling up.
Learn more about how to trade gold futures with crypto in our comprehensive guide.
Trade Tokenized Gold on BingX Spot and Futures Markets
BingX also allows traders to access gold through tokenized gold, which combines physical gold backing with blockchain efficiency.
1. Buy and Sell Tokenized Gold on the Spot Market
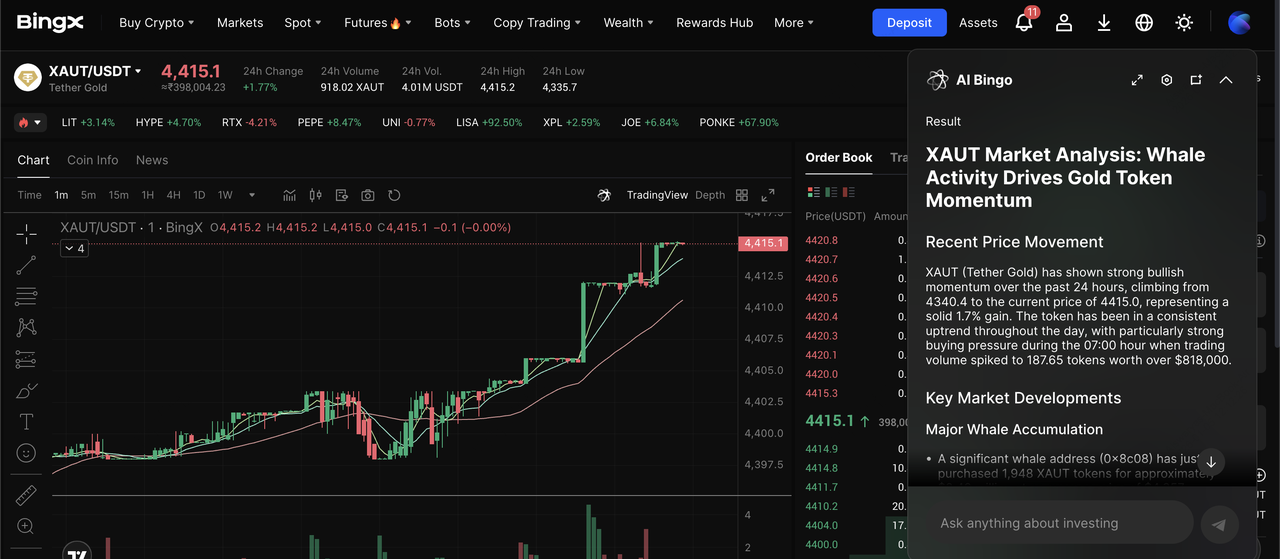
XAUT/USDT trading pair on the spot market powered by BingX Ai insights
On the spot market, tokens like XAUT and PAXG are backed 1:1 by physical gold stored in accredited vaults. This option suits traders and investors looking for long-term exposure, diversification, and fractional ownership without dealing with physical storage.
• Log in to your BingX account
• Go to Spot Market from the top menu
• Search for XAUT/USDT or PAXG/USDT
• Open the pair and choose Market or Limit order
• Enter amount and confirm Buy or Sell
2. Trade and Hedge Tokenized Gold Futures with Leverage
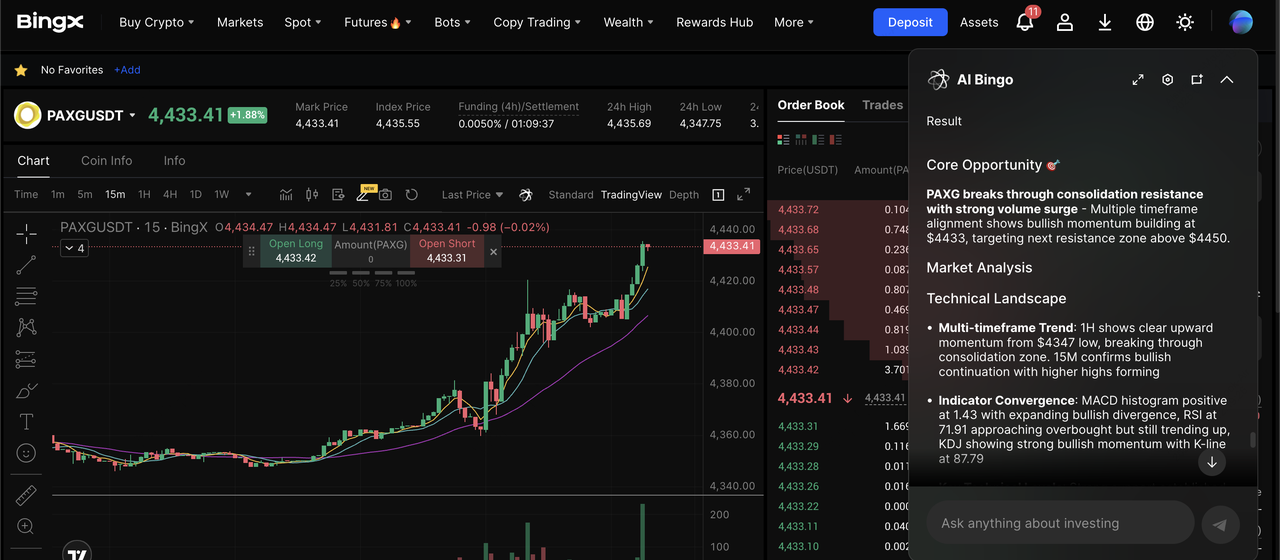
PAXG/USDT perpetual contract on the futures market powered by BingX AI
Tokenized gold futures, such as XAUT/USDT Futures and PAXG/USDT perpetuals, allow traders to speculate or hedge using leverage. You can go long or short without owning the asset, making futures better suited for active trading and short-term risk management.
1. Open and fund account: Create a BingX account and deposit USDT to your futures wallet.
2. Go to futures: Navigate to USDⓈ-M Perpetuals and search XAUT/USDT or PAXG/USDT.
3. Set size and leverage: Choose position size carefully; beginners should use 1×–3× leverage.
4. Add risk controls: Set stop-loss and take-profit before entering the trade.
5. Go long or short: Long to benefit from rising gold prices, short to hedge or profit from declines.
6. Monitor the trade: Track margin, liquidation price, and funding rates, and adjust if needed.
Demo Account Trading: Practice Gold Strategies Risk-Free
Before committing real capital to the gold market, it’s wise to practice your trading strategy using a demo account. A demo account allows you to simulate live gold trading conditions without risking any actual funds, making it an invaluable tool for both beginners and experienced traders. With a demo account, you can test different technical analysis techniques, experiment with various trading strategies, and refine your risk management approach—all in a risk-free environment.
Practicing with a demo account also helps you become familiar with your trading platform’s features, reducing the likelihood of costly mistakes when you start trading live. You can track your performance, identify areas for improvement, and build the confidence needed to execute trades effectively in real market conditions. By dedicating time to demo trading, you lay the groundwork for a disciplined, well-tested approach to gold trading that can help you succeed when you transition to a live account.
Top Gold Trading Tips for 2026: Best Practices for All Traders
Trading gold well in 2026 takes more than just expecting prices to rise. You need to know what drives gold, how it reacts at important price points, and how to manage risk when the market gets volatile.
• Keep Up with Major Market Events: Gold often moves quickly when big events happen, like changes in Fed rates, new inflation numbers, or major news from around the world. For instance, unexpected inflation data or hints of lower rates can cause gold to jump or drop near important prices like $5,000 or $5,200.
• Use Technical Tools to Find Good Entry Points: Apply trendlines, moving averages, and Fibonacci levels to identify high-probability zones. In 2026, traders have closely watched areas like former resistance near $4,900–$5,000 turning into support, and extension targets around $5,275 and above.
• Prioritize Risk Management at All Times: Gold prices can swing $50 to $100 in one day when things get volatile, so how much you trade is important. Set your stop-loss orders based on the chart, not your feelings, and only risk a small part of your money on each trade.
• Choose the Right Trading Instrument: Gold CFDs and futures give you flexibility and leverage, which can work well for short-term trades, but remember that leverage can increase losses as much as gains. If you prefer holding trades longer, spot gold or products without leverage might be safer since you avoid the risk of being forced out of your position.
• Adapt to Volatility, Don’t Chase It: Gold often breaks out after moving sideways for a while, but jumping in after a big move can be risky. It's usually better to wait for a pullback to support or for a clear break above resistance before entering a trade.
• Track Monetary Policy and Real Yields: Gold usually gets stronger when real yields drop and when there is more uncertainty about policy. By keeping an eye on Fed updates, bond yields, and the US dollar, you can spot trends early instead of reacting after the fact.
If you stay aware of big-picture events, use technical tools, and manage your risk carefully, you’ll be better prepared to handle gold’s ups and downs in 2026 and avoid common trading mistakes.
Conclusion
Gold remains a core asset across global markets, offering opportunities for traders who focus on structure, risk control, and market awareness. Successful gold trading strategies are built on discipline, not prediction. Whether day trading, swing trading, or hedging, consistency comes from following a plan. Start small, manage risk carefully, and explore gold markets confidently on BingX.
Related Articles
FAQs on Top Gold Trading Strategies
1. Is gold good for day trading or swing trading?
Gold is suitable for both. Day traders benefit from gold’s high intraday volatility, while swing traders focus on multi-day trends driven by macro factors like interest rates and the US dollar.
2. What moves gold prices the most?
Gold prices are primarily influenced by US monetary policy, real yields, the US dollar, inflation expectations, and risk sentiment during market stress.
3. Is gold a safe hedge during market crashes?
Historically, gold has acted as a hedge during stock market sell-offs and currency stress, often holding value or rising when risk assets decline.
4. Should beginners trade gold with leverage?
Beginners should use low leverage and strict stop-losses. Gold can move quickly, so risk control is more important than position size.
5. Can I trade gold on BingX?
Yes. BingX allows retail traders to trade gold in the form of gold-linked futures as well as tokenized gold cryptos like XAUT and PAXG on spot and futures markets, enabling both long and short positions.
