
The global capital markets in mid-2026 are closely monitoring the emerging market technology and financial ecosystem as the lines between traditional legacy equity brokerages and decentralized trading networks permanently dissolve. NIFTY 50 serves as a primary vehicle for global growth investors aiming to capture a massive secular shift toward institutional South Asian equity exposure.
By anchoring its core portfolio operations in high-margin enterprise blue chips rather than niche localized assets, the prominent index vehicle presents a unique tactical allocation for the current macroeconomic climate. The Nifty 50 is a benchmark stock market index that tracks the performance of 50 of the largest, most established companies listed on the National Stock Exchange of India (NSE). While it is not an investment fund itself, you can invest in index funds (or Exchange-Traded Funds) that are specifically designed to mirror the Nifty 50.
As alternative asset platforms scale their product frameworks to compete directly with classic equity brokerages, institutional desks are re-evaluating global index multiples to protect net investor yields. Wall Street analysts indicate that the traditional tracking parameters for high-growth emerging market indices are undergoing a thorough re-rating throughout the second half of 2026. For international traders monitoring secular shifts in decentralized infrastructure, sovereign financial ecosystems, and industrial output rails, tracking the performance metrics of the index has become a core strategic imperative.
Read more: Direxion Daily Semiconductor Bear 3X Outlook 2026: Can SOXS Cross $12 on Chip Cycle Contraction?
Key Highlights: Top 5 Things for Nifty 50 Investors to Know in 2026
- The Flagship Emerging Market Footprint: Operating as the definitive benchmark for the National Stock Exchange (NSE) of India, the index tracks the weighted average of 50 of the largest, most actively traded corporate enterprises across the region.
- Free-Float Market Capitalization Methodology: Moving past historical full market capitalization metrics, the index structure relies entirely on a free-float framework, meaning values are derived strictly from shares actively available for public trading.
- Heavy Financial and Technology Concentration: Capitalizing on rapid economic development, the index allocates substantial weight to core structural sectors, led heavily by major financial services, banking channels, and global IT service conglomerates.
- A Massive World-Class Derivatives Moat: Supported by an expansion in active options and futures contracts across both onshore rails and offshore hubs like GIFT Nifty, the ecosystem has established its position as one of the world's most liquid derivative trading pools.
- Semi-Annual Rebalancing Rigor: To ensure only highly liquid blue chips remain in the basket, automated filtering routines re-evaluate constituents every six months, maintaining strict eligibility metrics around trading history and impact costs.
What Is the NIFTY 50 Index?
Source: Google
The NIFTY 50 is India's premier diversified stock market index, representing the float-weighted average of 50 of the largest and most stable domestic companies listed on the National Stock Exchange. Launched on April 22, 1996, by NSE Indices, a wholly owned subsidiary of the NSE, the benchmark established its baseline tracking structure using a historic base date of November 3, 1995, set alongside a base value of 1,000. Originally calculated using a full market cap framework, the underlying engine transitioned to an efficient free-float methodology on June 26, 2009.
Today, the asset ecosystem operates as a highly liquid financial gateway across two distinct focus disciplines:
- The Core Equity Barometer Segment: The index covers 13 distinct sectors of the domestic economy, allowing fund managers to secure comprehensive exposure to the region's top corporate performers through a single unified portfolio wrapper.
- The Global Derivatives Ecosystem: This pillar underpins an interconnected network of index funds, mutual funds, exchange-traded funds (ETFs), and liquid futures and options contracts clearing locally as well as on international exchange systems.
With its prominent position as a pioneer in institutional emerging market access, the index has built a massive presence. In 2026, it operates as a deeply integrated financial asset where major banking infrastructure, global software development houses, and modern trading terminals function side by side.
Read more: iShares MSCI South Korea ETF (EWY) 2026 Outlook: Can Semiconductor Supercycle Drive EWY to 250+?
Core Details and Key Nifty 50 Index Metrics
- Primary Exchange Position: National Stock Exchange of India (NSE) / Flagship Index Segment
- Inception Date: Launched April 22, 1996 (Providing foundational emerging market tracking)
- Index Management House: Owned and administered actively by NSE Indices Limited
- Global Headquarters Location: Mumbai, Maharashtra, India
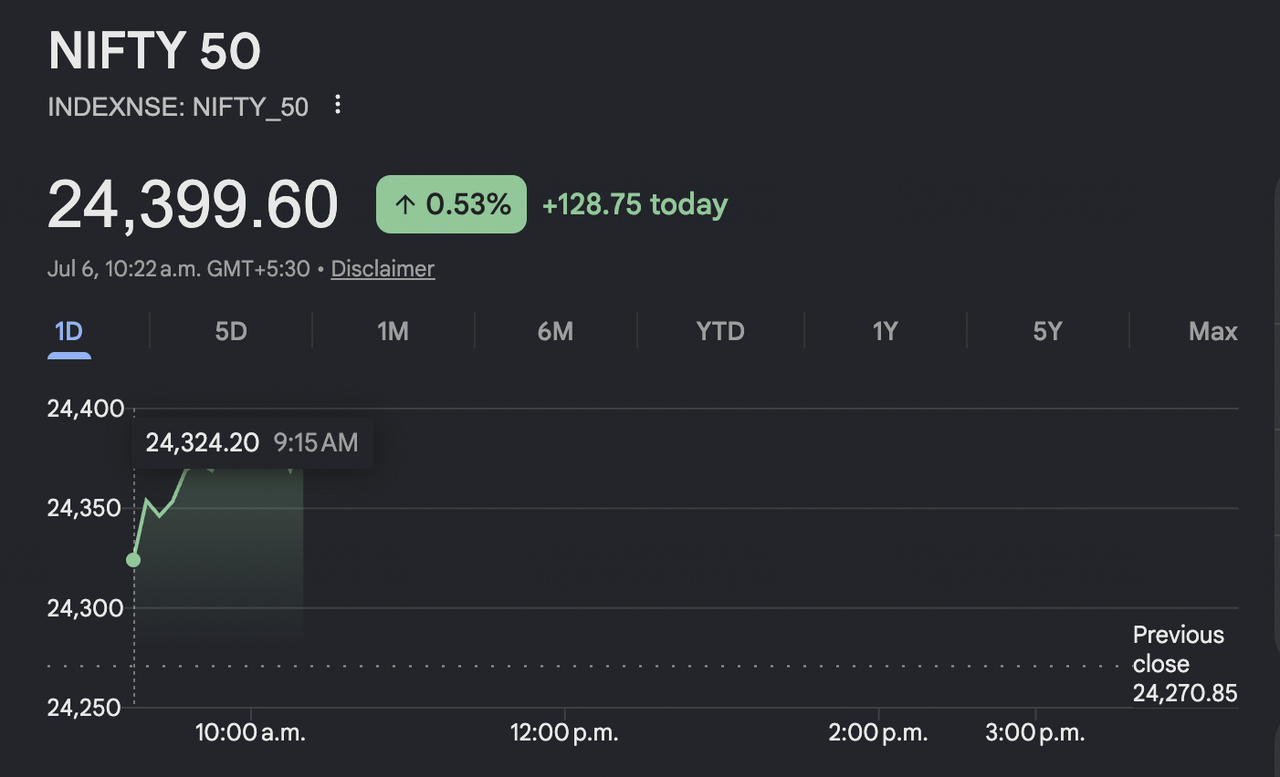
- Current Market Price: As of the July 6, 2026 morning session closing, the index finished trading at a market valuation reflecting a baseline price of $24,399.60 (denominated in Indian Rupees).
Nifty 50's Key Financial and Operating Metrics
The fundamental data tracking the index's capital allocation growth highlights its operational footprint heading into the second half of the 2026 fiscal year:
|
Financial & Operating Metric Category |
2026 Stated Value Status |
|
Current Index Price |
$24,399.60 |
|
Baseline Index Valuation Multiplier |
Base Value of 1,000 Established at Inception |
|
Index Intraday Performance Change |
Up 0.53% (+$128.75 today) |
|
Stated Historical Base Capital Level |
₹2.06 Trillion at Index Initiation |
|
Financial Services Sector Weighting |
Approx. 36.84% |
|
Oil and Gas Sector Weighting |
Approx. 10.39% |
|
Information Technology Sector Weighting |
Approx. 10.23% |
|
Automotive Sector Weighting |
Approx. 6.81% |
|
Consumer Goods Sector Weighting |
Approx. 6.49% |
NIFTY 50 Selected Industry Leading Constituents
The index's aggregate market performance is driven directly by the weighted market capitalization moves of top-tier domestic enterprises across various sectors:
|
Index Component Company Name |
Primary Business Sector Status |
|
Reliance Industries |
Diversified / Energy |
|
HDFC Bank |
Banking & Financial Services |
|
Infosys |
Information Technology |
|
Tata Consultancy Services (TCS) |
Information Technology |
|
Eicher Motors |
Automotive Manufacturing |
|
Hindustan Unilever |
Consumer Goods |
|
Titan Company |
Consumer Durables |
|
Cipla |
Pharmaceuticals & Healthcare |
|
Bharat Petroleum |
Energy and Oil Refining |
2026 Tech Sector Investment Comparison
The table below contrasts the financial parameters, underlying attributes, and structural tailwinds defining the flagship emerging market index, high-leverage technology derivatives, and broad application networks in the 2026 market cycle.
|
Asset Class / Strategy |
Implied Focus Sector |
Primary Revenue Driver |
Primary Growth Tailwinds |
Structural Risks & Roadblocks |
|
NIFTY 50 Index |
Emerging Market Blue Chips & Financial Services |
Free-Float Capitalization Growth & Global Inflows |
Accelerating domestic industrial expansion; rising international institutional asset allocations. |
Highly sensitive to global capital flight; emerging market currency volatility pressures. |
|
Direxion Daily Semi Bear 3X |
Leveraged Inverse Technology Derivatives |
Triple-Inverse Daily Index Swap Agreements |
Short-term hardware cyclical corrections; rapid downside technological re-ratings. |
Severe compounding volatility decay; structural drag during long-term tech bull runs. |
|
iShares Expanded Tech-Software ETF (IGV) |
Enterprise Application & Cloud Systems Software |
Pure-Play Software Licensing Contracts |
Rapid deployment of enterprise software; predictable recurring SaaS revenue. |
High dependency on compute pricing; zero defense against stock multiple compression shocks. |
Recent Developments and Strategy for Nifty 50 Traders
Rather than relying purely on simple localized retail trading models, the index's mid-2026 layout focuses on international institutional liquidity and clearing efficiencies.
1. Integration of Cross-Border Liquidity Hubs
In a milestone development for emerging market accessibility, the trading frameworks linking domestic clearing systems to international derivatives pools via GIFT City were significantly expanded. This integration enables global institutional traders to optimize complex cross-asset derivative strategies and execute high-volume hedges without navigating localized onshore capital barriers.
2. Rebalancing Safeguards and Impact Cost Optimization
Refining its inclusion criteria, the index management council enforced a strict 0.50% or lower average impact cost threshold over rolling six-month observation windows. This structural modification isolates the index from illiquid asset shocks, lowering tracking deviations for international index funds and stabilizing performance across high-volume market sessions.
Read more: What Is the U.S. CHIPS and Science Act? Its Impact on Semiconductors, Technology, and Crypto in 2026
The Nifty 50 Investment Thesis for 2026: 5 Pillars of Market Valuation
Source: Investing.com | Nifty 50 Buy Analysis
1. The Institutional Blue-Chip Moat
By aggregating 50 of the largest, most financially sound enterprises in the country, the index presents a highly secure investment environment. This framework isolates corporate portfolios from sudden counterparty failures and liquidity risks often associated with unlisted or lower-tier equities.
2. Diversified Macroeconomic Balancing
Spanning 13 key industries, the index functions as an all-inclusive barometer of regional economic growth. This structure balances cyclical infrastructure swings against steady technology exports, stabilizing the long-term capital trajectory for multi-asset investors.
3. Seamless Capital-Efficient Inflow Vehicles
The index serves as the foundational architecture for hundreds of domestic and international passive investment products. This structural role ensures steady, automated inflows from regular retirement accounts, exchange-traded funds (ETFs), and institutional index strategies.
4. Massive Options and Futures Liquidity Pools
Following the consolidation of weekly contract expiries, the index commands deep, highly efficient derivatives liquidity. This deep market allows income-focused traders to construct advanced risk mitigation models, covered call overlays, and defined spread systems to generate consistent premium returns regardless of general market directions.
5. Disciplined Capital Selection Frameworks
With strict listing tenure mandates, active futures and options eligibility requirements, and semi-annual rebalancing rules, the index automatically purges lagging performers. This automated rebalancing process ensures that the portfolio continuously holds only the most efficient large-cap entities.
Read more: TSMC (TSM) Price Prediction 2026: AI Monopoly or Geopolitical Trap at $480?
Nifty 50 Valuation and Performance Forecasts for 2026: Bull vs. Bear Outlook
Institutional research desks maintain an active dialog regarding the index's trajectory, balancing its high-growth macroeconomic tailwinds against global equity multiple risks.
|
Institution / Analyst Desk |
2026 Target Valuation Range |
Market Outlook / Stance |
|
Mumbai Capital Advisory |
28,500 |
Highly Bullish: Driven by accelerating domestic manufacturing expansion and substantial international institutional inflows into financial rails. |
|
Kotak Institutional Equities |
27,000 |
Bullish: Supported by strong credit growth in the financial services sector and expanding margins across IT service exporters. |
|
Motilal Oswal Financials |
26,000 |
Moderate Bull: Expects corporate earnings to compound steadily on stable consumer demand and optimized impact cost guidelines. |
|
Nomura Emerging Markets |
24,500 |
Neutral / Market Perform: Constructive on long-term structural tailwinds, but cautious on short-term multiple extension relative to global peers. |
|
JPMorgan Equity Strategy |
24,000 |
Neutral / Hold: Believes robust banking infrastructure will keep valuations stable, but notes potential friction from shifting macro interest rates. |
|
Macquarie Capital Division |
22,500 |
Hold / Cautious: Cautious stance keeping targets close to historical support levels due to potential export pullbacks and currency fluctuations. |
|
CLSA Global Research |
21,000 |
Underweight: Concerned about premium valuation multiple compression shocks if global liquidity shifts back to alternative developed sovereign assets. |
The Bull Case: Structural Inflows Accelerate Premium Multiples
Bulls argue that as domestic corporate earnings compound and global pension capital shifts toward high-growth regions, the index will see rapid multiple expansion. This consistent demand from index funds and passive institutional allocations would trigger sustained capital growth, lifting the benchmark well past historical highs.
The Bear Case: Macro Valuation Strains and Currency Headwinds
Bears emphasize that emerging market indices carry premium multiples that are highly sensitive to global liquidity shifts. If central banks tighten international monetary policies, sudden capital outflows combined with local currency pressures could weigh on large-cap valuations, keeping the index closer to its historical support levels.
Competitive Risks and Sector Pressures for Nifty 50 Investors
While the index benefits from deep liquidity and strong institutional structure, its component mix faces several structural headwinds:
- Sovereign Capital and Liquidity Sensitivity: As an emerging market asset class, the index remains sensitive to sudden shifts in international fund flows. When global risk aversion rises, foreign institutional investors can pull capital rapidly, straining local asset prices.
- Banking and Financial Services Concentration: Holding a heavy concentration in banking and financial services makes the index highly dependent on regional credit conditions. Any sudden spike in non-performing assets or unexpected shifts in domestic monetary policy can cause index-wide performance drag.
- Export and Global Technology Demand: The index's prominent IT and services sectors rely on stable enterprise spending from Western economies. If major international software markets experience corporate budget cuts or economic slowdowns, technology revenues could face compression.
Read more: Direxion Daily SOXL ETF Forecast 2026: $200 Moonshot or Michael Burry’s Return to Earth Trap?
How to Trade the NIFTY 50 Index on BingX
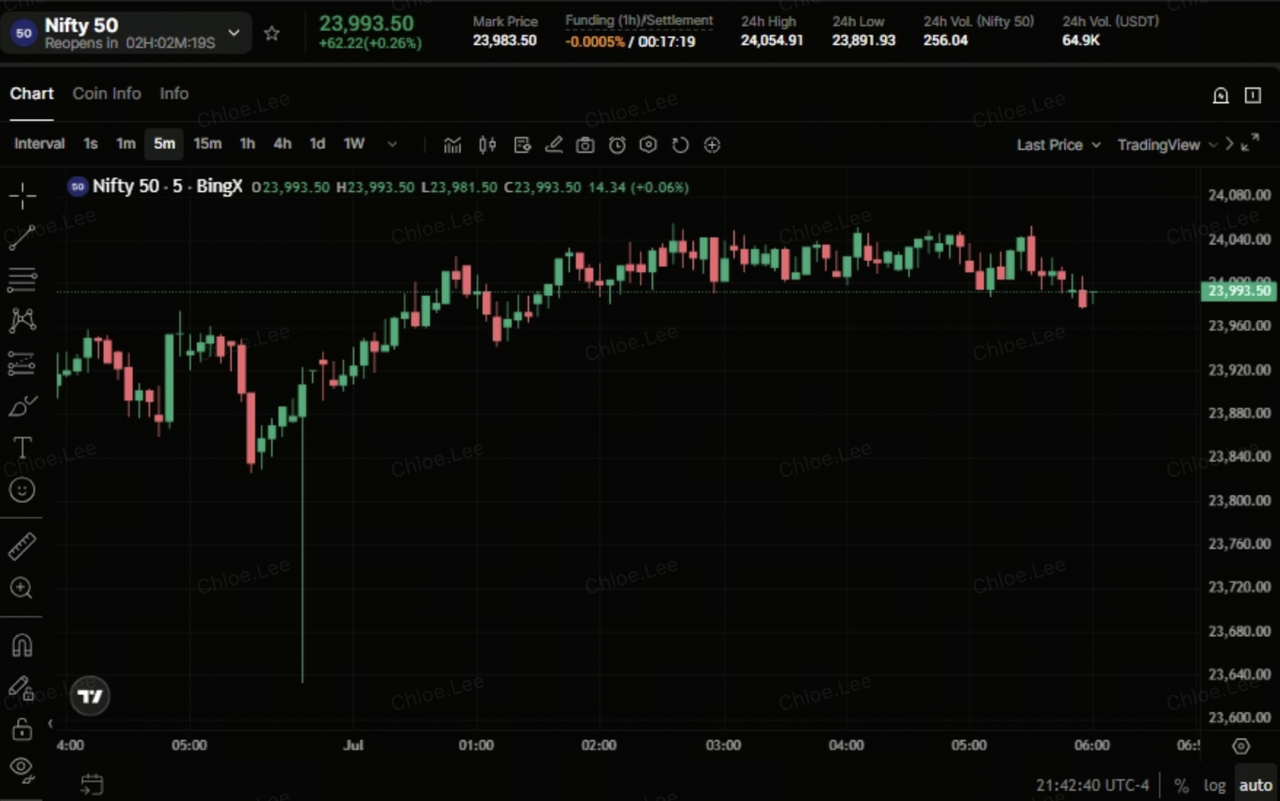
For global market participants looking to take advantage of the volatility surrounding emerging market growth cycles and index rebalancing periods, trading derivative contracts offers a highly flexible, capital-efficient alternative to traditional asset ownership. This vehicle allows active traders to manage risk or target short-term price movements around major economic milestones, much like how tech investors track updates across traditional finance (TradFi), semiconductor leaders like NVIDIA, or core digital assets like Bitcoin.
- Go to the BingX TradFi section and select Stock Futures.
- Search for the Nifty-50-USDT perpetual contract.
- Check the trading session before placing your order. Liquidity is typically lower during extended sessions, which can result in wider spreads and higher volatility.
- Select your Margin Mode (Isolated or Cross) and set your leverage.
- Choose Open Long if you expect momentum. Choose Open Short if you anticipate margin pressures or valuation pullbacks.
- Set Take-Profit (TP) and Stop-Loss (SL) levels immediately to manage risk against Nifty-50's price swings driven by earnings, news, or global semiconductor production milestones.
Conclusion: Navigating the Emerging Market Frontier with BingX
The global index sector in 2026 is moving through a major evolution. The investment tools positioned for sustainable utility are those that successfully bridge traditional regional manufacturing with modern high-volume financial tools. The strategic role of this index as a fully regulated free-float vehicle, complete with deep international derivatives liquidity and rigorous constituent selection filters, demonstrates a clear tactical role.
While investors must monitor shifting global capital trends and regional credit cycles, the structural convenience of its passive fund tracking model and strong corporate growth fundamentals continue to support its market presence. For short-term derivatives traders and macro asset allocators alike, tracking the vehicle provides a direct way to participate in the future of alternative finance as global benchmarks and modern trading terminals establish a new global standard.
Risk Reminder: Derivative and leveraged investment contracts carry high market risk. Rapid shifts in central bank interest rates, sudden adjustments to futures clearing regulations, and unexpected margin requirement updates can cause sharp capital movements. Always deploy strict risk-management and stop-loss protocols to shield capital against sudden shifts in market sentiment.
Related Reading
- Top AI Semiconductor Stocks to Buy in 2026: AI Chips and Supply Chain Complete Guide
- Top 10 AI Infrastructure Stocks to Buy in 2026: Chip Manufacturing and Design Leaders
- Top AI Compute and GPU Stocks to Buy in 2026: The Shift to Inference and Custom Silicon
- Top AI Cloud Infrastructure Stocks to Buy in 2026 Amid Hyperscaler Capex and the Neocloud Boom
- Roundhill Memory ETF (DRAM) Forecast 2026: $1.5B AI Supercycle or 'RAMmageddon' Trap?
