Evaluating your BingX copy trading performance in 2026 requires looking past surface-level profit summaries to understand how different data endpoints interact. With over 700 million copy trading orders processed on the platform, BingX offers a data-rich environment via its upgraded Copy Trading Plaza. However, users often face data discrepancies when comparing their actual wallet balance with a lead trader’s public profile due to mismatched fee tiers, calculation delays, and execution overhead.
In the 2026 financial markets, master social trading requires a dual-track perspective: distinguishing between position-level data and individual order-level data. By understanding how performance tracking variables like the Sharpe Ratio, Max Drawdown (MDD), and Weekly Profit Sharing are calculated, you can optimize your capital efficiency and stay protected against market volatility.
This guide explores how to break down your performance metrics on BingX, giving you the practical tools needed to audit your account with maximum accuracy and financial clarity.
Why Is It Important to Analyze Copy Trading Performance Data?
Evaluating a copy trading portfolio based strictly on gross numbers can be misleading. For instance, an unverified snapshot of a high ROI might hide massive floating liabilities, while mismatched trading fee structures between your account and the trader can generate slightly different net returns. In 2026, BingX’s optimized fee calculation rules minimize position discrepancies by using your account's actual fee rate rather than a fixed estimate, making tracking far more precise.
Conducting a performance review means knowing where to look on your dashboard. Mismatches can happen if you copy via Per Order mode and a trader closes a position in multiple partial tranches, as your data tracking updates differently than theirs. Mastering these technical calculation rules ensures you can judge a trader's efficiency without being misled by temporary visual distortions on your trading panel.
What Are the Top Metrics to Track on Your BingX Copy Trading Dashboard?
To accurately evaluate your portfolio's progress, you must cross-reference different data streams. Relying on a single data point like raw profit can create a blind spot around structural risk exposure.
|
Metric |
Tab Location |
Calculation Engine |
Operational Purpose |
|
Unrealized PnL |
Copied Orders (Order level) |
Based on fixed Open Price |
Tracks live profit/loss per individual trade contract. |
|
Realized PnL |
Trade History (Position level) |
Based on moving Avg. Position Price |
Tracks finalized performance after closing trades. |
|
30D/180D ROI |
Trader Card / Overview |
Compounded Weekly Interval Formula |
Measures long-term strategy efficiency over multiple cycles. |
|
Sharpe Ratio |
Trader Card / Analytics |
Excess Return ÷ Volatility Unit |
Quantifies how much risk a trader takes to capture profits. |
1. ROI vs. Realized PnL: The Calculation Mechanisms
To eliminate logical mismatches and align percentage yields directly with absolute profit movements, BingX utilizes an optimized, industry-standard formula to calculate a futures trader's ROI. This updated mechanism removes the old time-weighted, weekly compounding engine and evaluates performance using a single, clear structural layout:
ROI = (Current Balance - Initial Principal - Cumulative Deposits + Cumulative Withdrawals) ÷ Historical Highest Benchmark Principal
Where the Benchmark Principal is defined as Initial Principal+Cumulative Deposits−Cumulative Withdrawals.
To ensure maximum tracking integrity during active capital movements, if a trader makes significant withdrawals that exceed their cumulative deposits, the benchmark principal does not decrease; instead, it anchors to its historical high. This mathematical ceiling ensures that a trader cannot artificially manipulate or inflate their public ROI percentages by drastically shrinking their account balance after a string of losses.
Practically, this structural shift means that a trader's ROI and actual PnL will always move in the exact same direction, providing a highly transparent and easily verifiable metric for copiers. However, you must remember that your personal Realized PnL represents the absolute, uncompounded net dollar amount returned directly to your Standard or Perpetual Futures subaccount.
Because your actual financial return is dictated by your specific margin-per-order or position ratio parameters, a high public ROI on a trader's profile must always be cross-verified with your personal dashboard's Total Revenue ledger to confirm that the lead trader's strategic edge is translating into tangible, net dollar growth in your own wallet after accounting for localized fee structures.
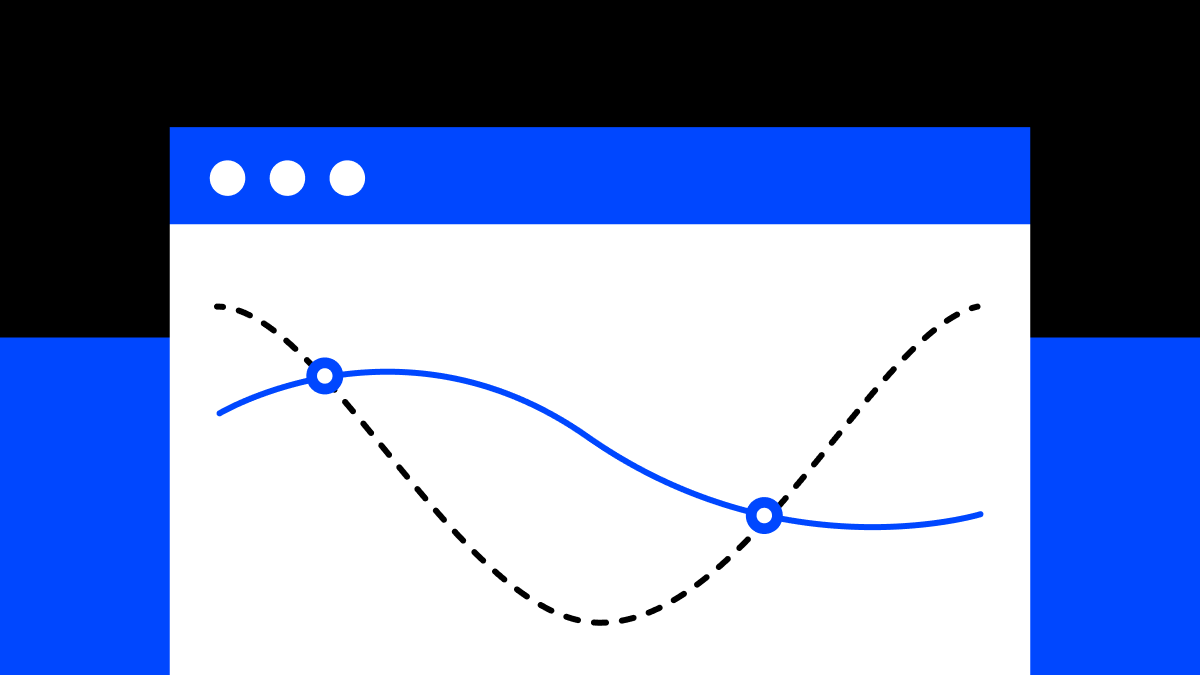
2. Resolving the Position vs. Copied Orders Inconsistency
The visual mismatch between the Position tab and the Copied Orders tab is a frequent source of confusion, but it is simply a byproduct of two distinct accounting data streams: position-level aggregation vs. order-level tracking. In Perpetual Futures, the Position tab condenses all active contracts of the same trading pair and direction into a single, unified position block governed by a fluid Average Position Price. When a trader executes a partial close to lock in incremental rewards, the total position size shrinks, but the average entry baseline stays fixed, which recalculates the remaining layout's Unrealized PnL across the aggregate contract mass.
Conversely, the Copied Orders panel acts as a line-item ledger, tracking each individual trade block based on its static, historical entry price. For example, if you copy three separate long entries at $20,000, $25,000, and $30,000 USDT, the Position tab averages your entry to $25,000 USDT, while the Copied Orders tab preserves the raw data for all three entries. If the trader closes the first order at $25,000 USDT, the Copied Orders tab will show a realized profit of $5,000 USDT for that specific contract.
Meanwhile, the Position tab, now averaging the remaining entries to $27,500 USDT, will reflect a temporary, calculated paper loss of −$2,500 USDT. This is a display variation that does not impact your actual wallet equity; when all positions are fully cleared, the total net profit across both sections reconciles perfectly.
3. Understanding the Profit Sharing Ledger
The BingX Elite Copy Traders Program enforces a strict performance-based incentive framework where lead traders can claim a 10% to 32% profit share based on their tier ranking - Bronze, Silver, Gold, or Diamond. This ledger operates on a clear weekly settlement cycle that finalizes every Monday at 00:00 (UTC+8). The critical compliance rule to understand here is that profit-sharing deductions are calculated strictly on fully closed, net-profitable positions within that specific week.
This creates a vital tracking nuance for copiers: if a lead trader closes ten profitable orders but leaves five massive losing trades running as open floating losses, the system will still deduct the profit share for the closed winners on Monday morning. Those active paper losses are completely excluded from the profit-sharing calculation pool until they are officially closed.
To protect your capital from traders who deliberately delay closing losing positions to protect their weekly payout, you should regularly cross-reference a trader's Realized PnL history against their live Unrealized PnL data on their public profile before continuing to copy them.
4. Quantitative Performance Reviews via Sharpe Ratio
The integration of the Sharpe Ratio into the Copy Trading Plaza provides a math-driven metric to analyze a lead trader's historical efficiency. Representing the excess return earned per unit of asset volatility, the Sharpe Ratio answers a crucial risk question: is the trader's ROI driven by genuine strategic skill, or are they taking dangerous risks with your capital? A Sharpe Ratio above 2.0 serves as an institutional green light, indicating that the trader maximizes capital efficiency while keeping portfolio drawdowns highly controlled.
When conducting your regular weekend performance review, tracking the trend of the Sharpe Ratio is far more valuable than simply looking at a static win rate. If a trader's 30-day ROI remains stable but their Sharpe Ratio shows a steady decline alongside an expanding Max Drawdown (MDD), it provides an early warning that their strategy is decaying. This trend line signals that the trader is likely over-allocating to volatile altcoins or increasing their average leverage to maintain their public ROI metrics, giving you the perfect cue to adjust your risk settings or reduce your subaccount exposure before a market shift occurs.
5. Advanced Factors Impacting Your Copy Trading Performance
Understanding performance means looking at external execution variables that can alter your net profit margins.
i. Execution Price Deviations or Slippage
Even if you match a trader's moves perfectly, extreme market volatility or changes in order book depth can cause execution delays, leading to slippage. Your entry or exit price might be slightly worse than the lead trader's, causing your realized PnL to deviate from their public profile. To eliminate this friction, advanced users enable BingX's "Copy with 0 Slippage" feature, which guarantees exact price matching at entry and exit.
ii. Mismatched Fee Tier Realities
Your trading fees are calculated using your personal VIP tier status on BingX, while the lead trader’s fees are bound to theirs. Because the platform's position sizing formula utilizes your actual account fee rate:
Copier Opening Amount=Order Price×(Leverage1+Taker Fee Rate)Copier Opening Margin
Any difference in fee structures can cause small, natural variations in final position sizes and overall performance compared to the lead trader.
How to Analyze Copy Trading Performance: A Practical Checklist for Beginners
Before committing significant capital to an automated strategy, running a systematic audit on a lead trader's data history is essential to ensure long-term portfolio survival.
- Audit the 180-Day Curve: Verify that the trader's equity growth is linear and steady over six months, rather than driven by a single high-volatility profit spike.
- Calculate the Calmar Ratio: Ensure the trader's cumulative ROI is at least double their Max Drawdown (an ROI divided by MDD ratio of 2.0 or higher) to confirm a healthy risk-adjusted return profile.
- Cross-Reference Live Floating Positions: Open the trader's Positions tab to check for hidden, deeply underwater trades that are being held open to artificially protect a high public win rate.
- Analyze Asset Concentration Metrics: Review the Top Traded Assets pie chart to ensure the trader focuses on high-liquidity majors like BTC and ETH rather than volatile, low-cap altcoins.
- Match Average Holding Times: Check if the trader's holding duration, e.g., 2-hour scalps vs. 5-day swing trades, matches your personal liquidity needs and fee tolerance.
- Test via Position Ratio First: Initialize the copy relationship using Position Ratio mode with a small test allocation to observe execution alignment before deploying larger capital.
5 Key Considerations When Analyzing Copy Trading Performance on BingX
Evaluating social trading data within the BingX platform requires an understanding of specific execution rules, structural upgrades, and account-level dynamics that naturally differentiate your wallet's net performance from a lead trader's public profile.
- Actual Fee Rate Optimization: Remember that BingX's 2026 fee rule calculates your copy position size using your actual account VIP tier fee rate, which eliminates artificial position drift but causes minor sizing variations if your tier differs from the trader's.
- Weekly Commission Deductions: Factor in the Monday 00:00 (UTC+8) settlement cycle, which deducts a profit share of up to 32% solely on closed, net-profitable trades, occasionally creating a divergence between your gross dashboard curve and net wallet equity.
- Tranche-Closing Synchronization Delays: Be aware that if you use Per Order mode and a trader closes a position using multiple partial trades, your copy order will remain active at an aggregate price until the trader's position is 100% finalized.
- Slippage Overhead in Fast Markets: High-volume or rapid-fire scalping strategies can suffer from localized network execution delays; utilize the platform's Copy with 0 Slippage feature to protect your fill prices during extreme volatility.
- Subaccount Isolation Benefits: Leverage the structural architecture of Copy Trading 2.0, which completely isolates each active copy relationship into its own subaccount to track individual metrics cleanly without cross-margin contamination.
Final Thoughts: Conducting a Data-Driven Copy Trading Performance Review
A professional copy trading review focuses on consistency and capital preservation. Check your My Trades overview panel weekly to compare today's earnings against your total revenue trendline, and use the performance data to balance your allocations across multiple traders.
By treating copy trading as a data-informed asset allocation practice rather than short-term speculation, you can utilize BingX’s built-in metrics to build a resilient, diversified social trading portfolio.
Risk Reminder: Digital asset trading carries high market risk and price volatility. Past performance records are for reference only and do not guarantee future returns.
Related Reading
- How to Choose the Right BingX Lead Trader: ROI and Risk Metrics Explained
- How to Set Up BingX Copy Trading Parameters: Fixed Amount vs. Position Ratio
- Understanding Copy Trading 2.0 and Isolated Subaccount Protections
FAQs on Reading BingX Copy Trading Performance
1. Does a high copy trading ROI always mean the strategy is good?
No. A high short-term ROI can be artificially inflated by an aggressive trader using extreme leverage during a brief market rally. If their high ROI is accompanied by a Max Drawdown (MDD) exceeding 30%, the strategy carries a high risk of sudden liquidation. Always evaluate performance across a 180-day lens to ensure long-term stability.
2. Can I withdraw my copy trading profits?
Yes. When your copied trades are successfully closed, the realized profits are credited directly to your dedicated Copy Trading 2.0 subaccount. You can transfer these funds back to your Standard Futures, Perpetual Futures, or Fund account at any time without disrupting your active copy relationships.
3. When are BingX copy trading profits settled?
While your trading profits are realized in real-time as soon as a position closes, the profit-sharing commission paid to the lead trader settles once a week on Mondays at 00:00 (UTC+8). The platform calculates this fee based on your net weekly profits from fully closed positions.
4. What does it mean if copy trading returns decline?
A decline in returns usually indicates a shift in macro market conditions that no longer aligns with the lead trader's specific edge (e.g., a trend-following strategy stuck in a choppy, range-bound market). It can also indicate that the trader is experiencing an extended drawdown or using poor risk-reward parameters.
5. Should I continue copying after a loss?
It depends on whether the loss falls within the trader's historical boundaries. Review their profile's Max Drawdown history; if the current loss is within their typical risk parameters and they maintain a high Sharpe Ratio, it may be wise to remain patient. However, if the loss was caused by emotional "revenge trading" or a sudden spike in leverage, you should consider stopping the copy relationship.
6. What does ROI mean in BingX copy trading?
ROI stands for Return on Investment. It represents the percentage of profitability generated by a trader or your subaccount over a specific timeframe (7d, 30d, 90d, or 180d), calculated using a time-weighted compounding formula to filter out the distorting effects of capital deposits and withdrawals.
7. What does PnL mean in BingX copy trading?
PnL stands for Profit and Loss. It tracks your absolute dollar earnings or losses in USDT. Your dashboard separates this into Unrealized PnL, live paper gains/losses of open positions, and Realized PnL, finalized profit or loss after positions are securely closed.
8. What does maximum drawdown mean in BingX copy trading?
Maximum Drawdown (MDD) measures the largest historical peak-to-valley equity drop an account has suffered before reclaiming a new high. It serves as the ultimate metric for risk tolerance, showing you the worst-case loss scenario a trader has experienced during a bad market streak.
9. What fees are involved in BingX copy trading?
BingX copy trading does not add any hidden platform surcharges. Copiers only pay standard trading fees (standard spot or futures taker/maker fees based on their account's VIP level) and a profit-sharing commission, typically 8% to 32%, depending on the trader's level, paid to the lead trader solely on net-profitable closed trades.
10. Why are my returns different from the lead trader’s returns?
Your returns can deviate from the lead trader's profile due to execution variables like market slippage, variations in account opening times, and minimum position size thresholds. Differences can also emerge from the profit-sharing deductions or if either party executes manual fund transfers while positions are actively open.
