


Walmart (WMT) operates one of the world's largest retail networks through Walmart U.S., Walmart International and Sam's Club U.S. Its stores and clubs remain the foundation of the business, while eCommerce, marketplace services, advertising, memberships and fulfillment are becoming more important to growth and profitability.
The latest quarter showed both sides of that transition. Walmart Q2 FY2027 revenue rose 5.9% to $187.937 billion, adjusted EPS reached $0.81, global eCommerce sales grew 23% and advertising grew 38%. Walmart U.S. comparable sales excluding fuel increased only 2.6% versus the 3.8% tracked consensus, leaving investors to weigh faster digital growth against slower near-term store momentum.
The WMT stock forecast for 2026 now centers on two competing views:
- The digital-margin case: eCommerce, advertising, marketplace and membership growth allow operating income to rise faster than sales as U.S. comparable sales recover.
- The valuation-pressure case: weak comparable sales, pharmacy deflation, inventory growth and softer Q3 guidance prevent earnings from supporting a premium multiple.
This guide breaks down the WMT stock forecast, 2026 price scenarios, key risks and analyst outlooks, drawing on Walmart's August 20 Q2 FY2027 earnings release, subsequent filing and market data through September 4, plus how to trade WMT stock futures on BingX TradFi with USDT collateral.
Top 5 Things for Walmart Investors to Know in September 2026
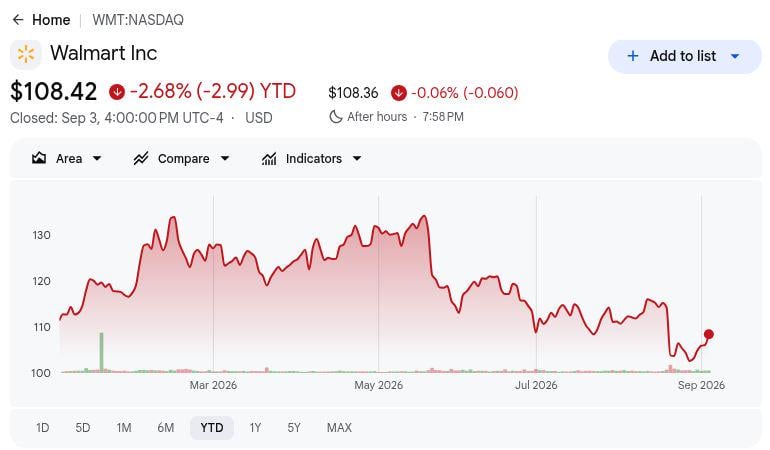
- WMT closed at $108.42 and was down 2.68% YTD through September 3: The shares stood about 19.8% below their $135.16 52-week high after falling 9.2% on earnings day. That reset reflects concern about comparable sales and near-term guidance even as Walmart's digital businesses continue to grow.
- Quarterly revenue reached $187.937 billion and grew 5.9% year over year: Revenue exceeded the $186.75 billion tracked consensus by about $1.19 billion, while adjusted EPS of $0.81 beat the $0.74 estimate by seven cents. The headline results remained stronger than the U.S. comparable-sales response implied.
- Global eCommerce sales grew 23% and advertising increased 38%: Walmart U.S. eCommerce rose 24%, Walmart Connect excluding VIZIO expanded 43% and store-fulfilled delivery grew 40%. These higher-growth activities are broadening the revenue mix beyond merchandise sales and improving the economics of Walmart's digital ecosystem.
- Management raised FY2027 sales growth to 4.0% to 5.0% and adjusted EPS to $2.80 to $2.87: The previous ranges were 3.5% to 4.5% and $2.75 to $2.85, while adjusted operating-income growth was lifted to 7.0% to 8.5%. The stronger annual view contrasts with Q3 EPS guidance of only $0.62 to $0.64.
- Selected post-earnings analyst targets span $114 to $137: A wider group of 39 analysts carries an average target of $131.88, with estimates ranging from $113 to $155 and 35 bullish ratings against four holds. The dispersion captures confidence in Walmart's long-term model alongside uncertainty about comparable-sales recovery and valuation support.
What Is Walmart (WMT)?

Walmart is a global omnichannel retailer operating Walmart U.S., Walmart International and Sam's Club U.S. across stores, clubs and eCommerce sites. Its revenue comes from merchandise and grocery sales as well as memberships, advertising, marketplace commissions, fulfillment and financial services. Around 280 million customers and members visit more than 10,900 locations and numerous online properties each week across 19 countries, and the company generated $713 billion in FY2026 revenue with approximately 2.1 million employees. In Q2 FY2027, Walmart U.S. produced $125.2 billion of net sales, compared with $35.2 billion internationally and $25.7 billion at Sam's Club U.S.
Walmart's current strategy is to combine its physical store footprint with faster delivery, marketplace expansion, fulfillment services, memberships and higher-margin advertising. Almost 50% of marketplace volume flowed through Walmart Fulfillment Services in Q2, strengthening the link between third-party assortment and logistics revenue. The company has partnered with OpenAI to support Walmart and Sam's Club purchases through ChatGPT and with Google to surface products in Gemini through the Universal Commerce Protocol. Its announced acquisition of Vibe.co would also extend Walmart Connect into self-service connected-TV advertising, building on VIZIO and integrations involving Magnite, Yahoo DSP and Google DV360.
Read More: Amazon (AMZN) Price Prediction 2026: Can AWS AI Re-acceleration Offset a $200B CapEx Gamble?
Walmart (WMT) Q2 FY2027 Earnings Overview: Revenue, EPS and Digital Growth
Walmart delivered $187.937 billion of Q2 FY2027 revenue versus the $186.75 billion tracked consensus, representing 5.9% year-over-year growth, while adjusted EPS of $0.81 beat the $0.74 estimate. Global eCommerce and advertising grew 23% and 38%, respectively, and management raised FY2027 sales growth to 4.0% to 5.0% and adjusted EPS to $2.80 to $2.87. The main weakness was Walmart U.S. comparable sales of 2.6% versus 3.8% expected, followed by Q3 EPS guidance of $0.62 to $0.64.
Read More: Walmart (WMT) Q2 FY2027 Earnings Overview: 2.6% U.S. Comp Miss Triggers a 9.15% Price Selloff
|
Financial Metric |
Guidance / Consensus |
Reported / Actual |
Surprise |
|
Q2 FY2027 total revenue |
$186.75B consensus |
$187.937B |
Beat. About $1.19B above consensus; up 5.9% YoY. |
|
Q2 adjusted diluted EPS |
$0.74 consensus |
$0.81 |
Beat. Seven cents or roughly 9.5% above consensus. |
|
Q2 GAAP diluted EPS |
— |
$0.80 vs. $0.88 a year earlier |
Declined. Down 9.1% as investment losses offset operating growth. |
|
Q2 GAAP net income attributable to Walmart |
— |
$6.366B |
Declined. Down 9.4% from $7.026B. |
|
Q2 operating income |
— |
$9.383B; +28.8% YoY |
Improved. Tariff refunds and business mix lifted reported profit. |
|
Walmart U.S. comparable sales excluding fuel |
3.8% consensus |
0.026 |
Missed. Pharmacy pricing created a 125 bps headwind. |
|
Global eCommerce sales growth |
— |
+23% YoY |
Accelerated. Pickup, delivery and marketplace remained core growth engines. |
|
Global advertising growth |
— |
+38% YoY |
Improved. Walmart Connect and international ads expanded the higher-margin mix. |
|
Six-month operating cash flow |
— |
$19.710B |
Improved. Increased $1.358B year over year. |
|
Six-month free cash flow |
— |
$5.529B |
Declined. Fell $1.371B as capital spending rose $2.772B. |
|
Q3 FY2027 adjusted EPS outlook |
$0.67 to $0.68 consensus range |
$0.62 to $0.64 |
Below. Near-term reinvestment and timing weighed on the guide. |
|
FY2027 adjusted EPS outlook |
Prior: $2.75 to $2.85 |
$2.80 to $2.87 |
Raised. Both ends moved higher after Q2. |
|
FY2027 net sales growth outlook at constant currency |
Prior: 3.5% to 4.5% |
4.0% to 5.0% |
Raised. Full-year revenue outlook improved by 50 bps at both ends. |
- Revenue of $187.937 billion grew 5.9% and beat consensus by about $1.19 billion: Constant-currency revenue still increased 5.1%, showing that broad top-line momentum remained intact despite the weaker Walmart U.S. comparable-sales result.
- Adjusted EPS of $0.81 beat the $0.74 estimate by seven cents: GAAP EPS declined 9.1% to $0.80 as equity and other investment losses weighed on reported results, separating stronger underlying operations from weaker reported net-income trends.
- Global eCommerce rose 23% and advertising increased 38%: Walmart Connect excluding VIZIO grew 43%, store-fulfilled delivery expanded 40% and marketplace net sales rose more than 50%, increasing the contribution from digital services and third-party commerce.
- Operating income of $9.383 billion increased 28.8%: Adjusted constant-currency operating income grew 17.4% and Walmart U.S. gross profit rate expanded 158 basis points, although operating expenses deleveraged by 72 basis points and tariff refunds aided the comparison.
- FY2027 adjusted EPS guidance rose to $2.80 to $2.87 from $2.75 to $2.85: Q3 guidance of $0.62 to $0.64 remained below the roughly $0.67 to $0.68 Street view, and Flipkart timing is expected to reduce Q3 sales growth by more than 100 basis points.
Walmart (WMT) 2026 Investment Outlook: $155 Bull Case vs. $90 Bear Case
The central test is whether Walmart's digital businesses and improving operating leverage can offset slower comparable sales strongly enough to support its premium valuation.
The Bull Case: Strong E-Commerce and Advertising Growth Push WMT Toward $155
The Bull Case assumes Walmart U.S. comparable sales recover toward 3.5% to 4.0%, global eCommerce growth stays near or above 20%, and advertising remains above 30%. Higher-margin marketplace, membership, and fulfillment revenue helps adjusted operating income grow faster than sales and finish near the 8.5% upper end of FY2027 guidance.
A move toward $150 to $155 would require stronger transactions and ticket growth, stable inventory, and adjusted EPS near the $2.87 upper end of guidance. Continued digital-margin improvement would provide the clearest confirmation, while another meaningful comparable-sales miss would weaken the case.
The Base Case: Steady Sales Growth Keeps WMT Between $120 and $135
The Base Case assumes annual sales grow within management’s 4.0% to 5.0% range as eCommerce and advertising offset slower store growth. Adjusted EPS lands within the $2.80 to $2.87 outlook, while operating income continues to grow faster than revenue without requiring a major valuation re-rating.
Under this scenario, WMT could trade mainly between $120 and $135. Q3 results near guidance, easing pharmacy pressure, and continued digital-margin progress would support the range, while a cut to full-year guidance would weaken it.
The Bear Case: Slower Consumer Spending and Margin Pressure Pull WMT Toward $90
The Bear Case assumes Walmart U.S. comparable sales stay near or below 2.5%, pharmacy deflation persists, and price investment offsets some of the benefit from tariff refunds. Inventory rises faster than revenue, capex weighs on free cash flow, and the premium earnings multiple begins to compress.
A move toward $90 to $100 would become more likely if Q3 EPS falls below $0.62, free cash flow weakens further, or management cuts FY2027 guidance. Walmart could still grow sales in this scenario, but weaker cash conversion and slower earnings revisions would pressure the stock.
WMT Stock Price Forecasts for 2026 By Wall Street Analysts
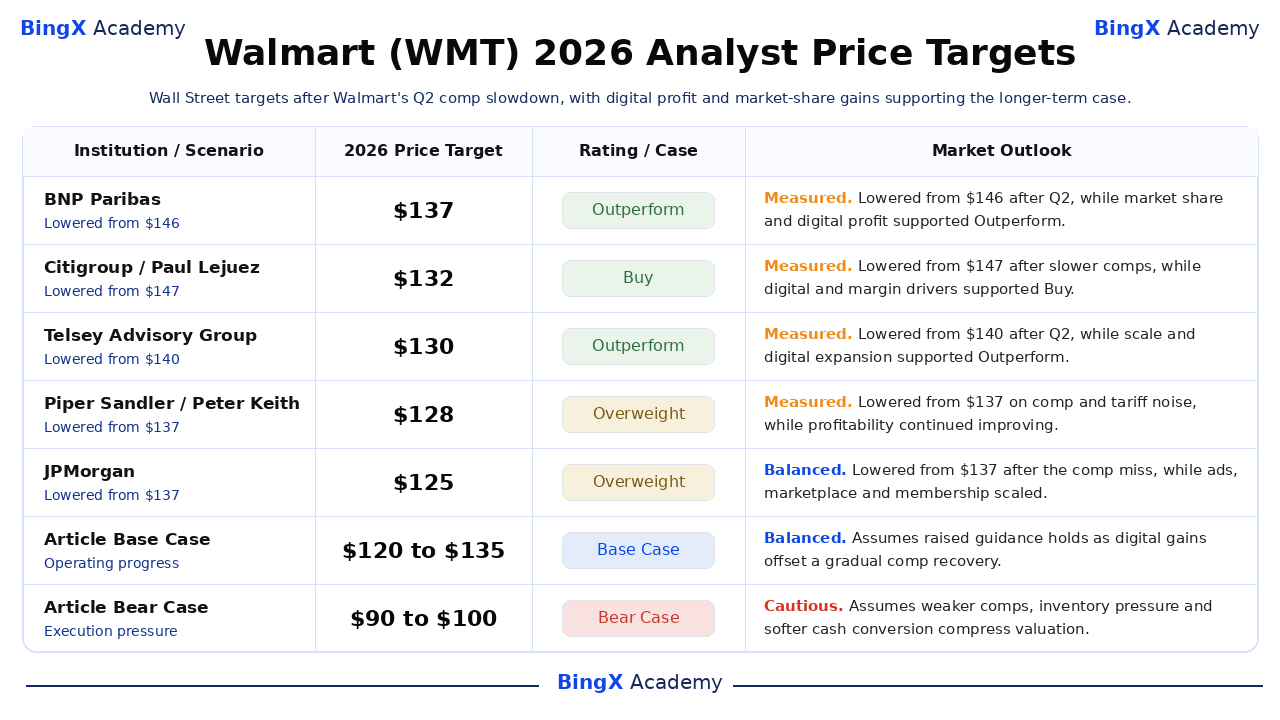
The six selected post-earnings actions are dated, named third-party targets and are presented from highest to lowest. They range from $114 to $137, while the wider 39-analyst set averages $131.88 and spans $113 to $155. The final two rows are BingX Academy editorial scenarios rather than Wall Street forecasts.
|
Institution / Scenario |
2026 Price Target |
Rating / Case |
Market Outlook |
|
BNP Paribas |
$137 |
Outperform |
Measured. August 21: lowered from $146 to $137 after Q2 while retaining an Outperform view on Walmart's market-share and digital-profit potential. |
|
Citigroup |
$132 |
Buy |
Measured. August 21: lowered from $147 to $132 after the comparable-sales slowdown but maintained Buy as digital and margin drivers remained intact. |
|
Telsey Advisory Group |
$130 |
Outperform |
Measured. August 21: lowered from $140 to $130 after Q2 while keeping Outperform on Walmart's scale, market-share gains and digital expansion. |
|
Piper Sandler |
$128 |
Overweight |
Measured. August 21: lowered from $137 to $128 on U.S. comp and tariff-refund noise while noting improving profitability. |
|
JPMorgan |
$125 |
Overweight |
Balanced. August 21: lowered from $137 to $125 after the comp miss but kept Overweight on advertising, marketplace and membership scaling. |
|
Truist Securities |
$114 |
Buy |
Cautious. August 21: lowered from $140 to $114 following the 2.6% U.S. comp result while maintaining Buy. |
|
Article Base Case |
$120–$135 |
Base Case |
Balanced. Assumes 4%–5% annual sales growth, $2.80–$2.87 adjusted EPS, and steady digital gains. |
|
Article Bear Case |
$90–$100 |
Bear Case |
Cautious. Assumes comps stay near 2.5%, inventory outgrows sales, cash conversion weakens, and the multiple compresses. |
How to Trade Walmart (WMT) on BingX
Use BingX TradFi to express a directional view on Walmart while treating leverage as a separate risk decision. WMT can move sharply around earnings, guidance, regulatory decisions, product milestones, and macro news, so the catalyst, position size, and maximum loss should be defined before entry.
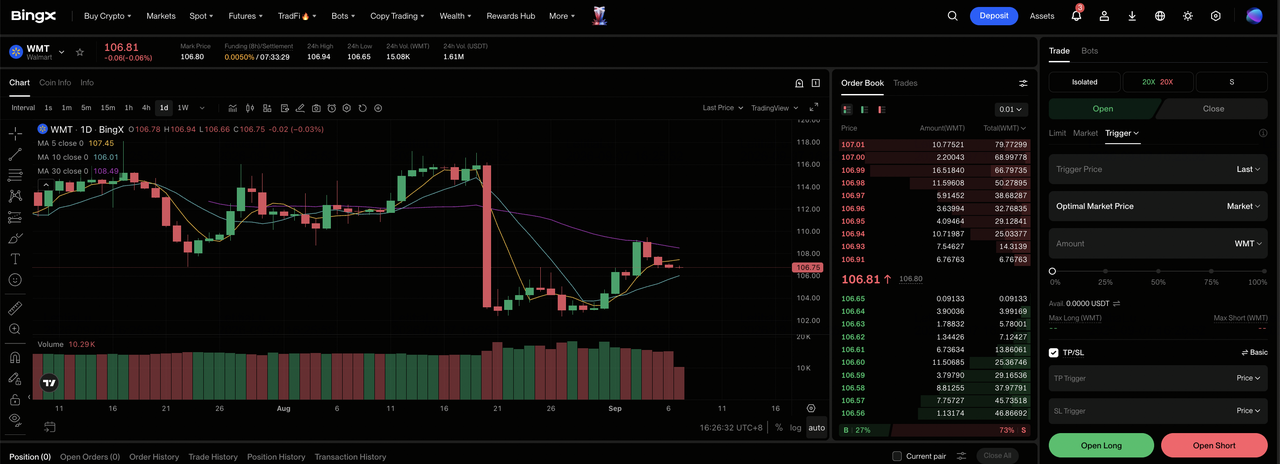
Step 1: Access BingX TradFi. Sign up and navigate to the specialized TradFi section on the BingX exchange dashboard.
Step 2: Select Walmart (WMT). Search for and select the WMTUS-USDT perpetual futures contract.
Step 3: Choose your direction. Select Open Long if comparable sales improve, eCommerce and advertising stay strong, and operating income continues to outgrow revenue. Select Open Short if consumer spending weakens, pharmacy pressure persists, or management cuts guidance.
Step 4: Select leverage and margin mode. Choose Isolated or Cross-Margin based on your risk tolerance. WMT can still move sharply around earnings, guidance changes, consumer-spending data, and margin updates, so conservative leverage and clear position sizing remain important.
Step 5: Execute strict risk protocols. Set Take-Profit and Stop-Loss (TP/SL) levels before or immediately after entering the trade. WMT can react quickly to comparable-sales trends, eCommerce growth, advertising momentum, inventory levels, and changes to full-year guidance.
Top 5 Risks to Watch for WMT Investors in 2026
Walmart's scale reduces dependence on any single category, although the current valuation still leaves the shares sensitive to changes in growth, margins and cash conversion.
- Comparable sales of 2.6% missed the 3.8% expectation: Transactions rose 1.5% and ticket increased 1.1%. Persistently slower traffic and basket growth would reduce operating leverage and make the premium valuation harder to defend.
- Pharmacy deflation reduced Walmart U.S. comps by 125 basis points: Health and wellness lowered the reported company comparison by 80 basis points. Continued regulated price pressure could suppress reported growth even when prescription volumes remain stable.
- Inventory rose 6.7% to $61.6 billion: That increase exceeded the 5.9% growth in quarterly revenue. If demand slows, excess stock could require markdowns, absorb working capital and reverse part of the recent gross-margin improvement.
- Six-month capital expenditure increased $2.772 billion to $14.181 billion: Free cash flow fell $1.371 billion to $5.529 billion despite higher operating cash flow. Omnichannel investment that fails to produce durable growth would weaken cash conversion and future shareholder returns.
- WMT traded at roughly 39 times trailing earnings at $108.42: Q3 adjusted EPS guidance of $0.62 to $0.64 was below the Street view. A premium multiple magnifies the downside if future estimates, comparable sales or digital-margin gains weaken.
Final Thoughts: Should You Invest in WMT in 2026?
Walmart's latest results confirmed broad growth: revenue increased 5.9%, adjusted EPS beat consensus by seven cents, eCommerce grew 23% and advertising rose 38%. Management also raised FY2027 sales and adjusted EPS guidance. The counterweight is a 2.6% Walmart U.S. comparable-sales result versus 3.8% expected, softer Q3 EPS guidance and lower free cash flow after heavier investment.
The $120 to $135 Base Case assumes digital growth and operating leverage offset a gradual comparable-sales recovery. The $150 to $155 Bull Case requires eCommerce and advertising to maintain rapid growth as U.S. comps improve, while the $90 to $100 Bear Case reflects persistent consumer, pharmacy, inventory and valuation pressure. Investors should track U.S. comps, digital contribution, operating-income leverage and free cash flow before treating the post-earnings reset as durable upside.
Risk Reminder: These WMT scenarios are conditional research estimates, not investment advice or guaranteed returns. Walmart shares and WMTUS-USDT perpetual contracts can lose value, and leveraged positions may be liquidated. Review current market data, company filings and BingX terms independently before taking risk.
Related Reading
- Apple (AAPL) Price Prediction 2026: Can Siri AI and the Foldable iPhone Push AAPL Past $400?
- Amazon (AMZN) Price Prediction 2026: Can AWS and AI Growth Push AMZN Past $400?
- Nike (NKE) Price Prediction 2026: $55.00 Turnaround Comeback or $39.00 Value Trap?
- AMC Stock Price Prediction 2026: Fundamental Turnaround or Massive Dilution Trap?
- Ferrari N.V. (RACE) Stock Outlook for 2026: Can An Iconic Brand and EVs Drive RACE Stock to $550+?
- McDonald's (MCD) Stock Outlook for 2026: Value King or Margin Trap?
