
Bitcoin dominance or BTC.D is one of the most critical metrics to watch for crypto traders as it provides insight into Bitcoin’s market share within the entire crypto market. As of July 2025, Bitcoin commands 63.8% of the total cryptocurrency market capitalization, following its rally to a new all-time high above $116,893. That means nearly $64 out of every $100 in crypto market cap is tied up in BTC. This dominance ratio is a key indicator that measures the pulse of the crypto market, signaling where smart money flows when uncertainty strikes or opportunity knocks.
By understanding BTC.D, you can better navigate market cycles, spot altcoin seasons early, and fine-tune your trading strategies. Is capital rotating back into BTC’s relative safety? Or are altcoins stealing the spotlight as altseason gets underway? Whether you’re staging a long-term hold or hunting for the next altcoin breakout, keeping one eye on BTC.D equips you with a high-level view of market sentiment and risk appetite, crucial data for anyone stepping into crypto trading.
Ready to harness this powerful indicator and sharpen your trading edge? Keep reading to learn how Bitcoin dominance can become your go-to metric in the dynamic crypto landscape.
What Is Bitcoin Dominance (BTC.D)?
Bitcoin dominance is the percentage share of Bitcoin’s market capitalization relative to the total crypto market cap, including altcoins and stablecoins.
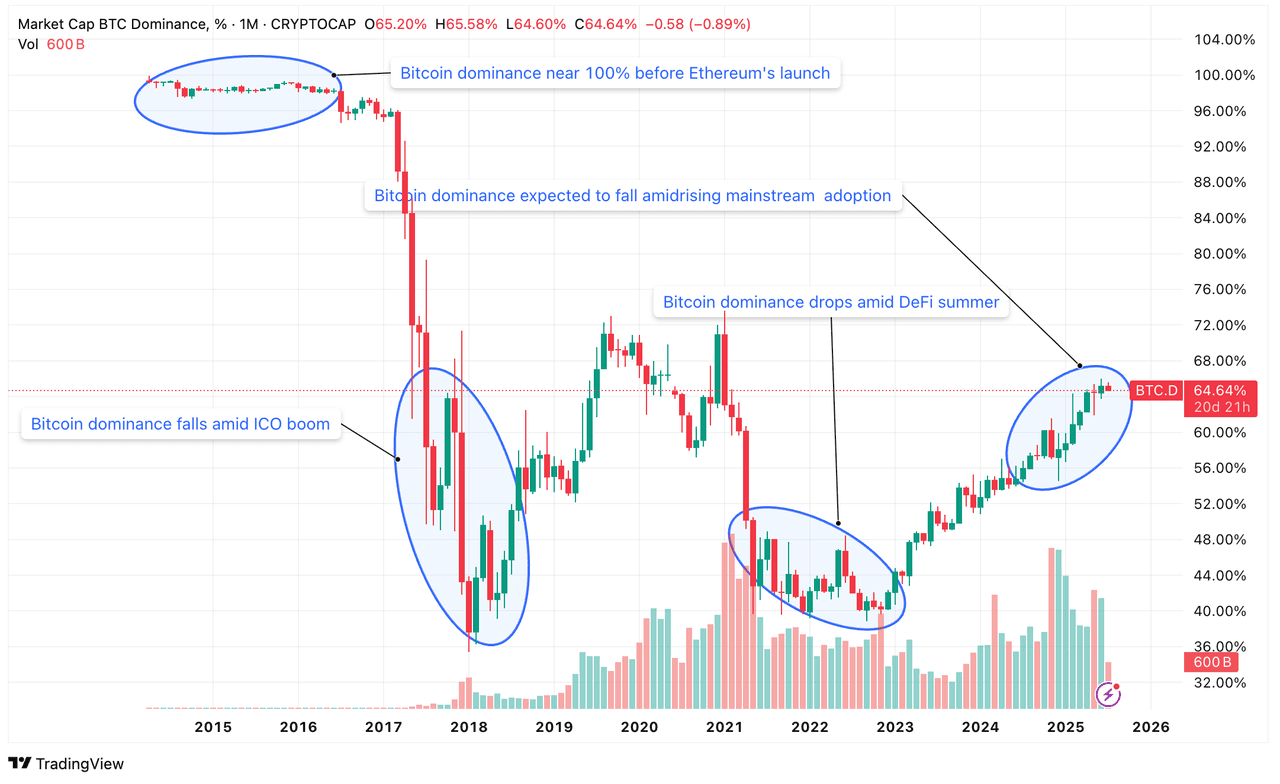
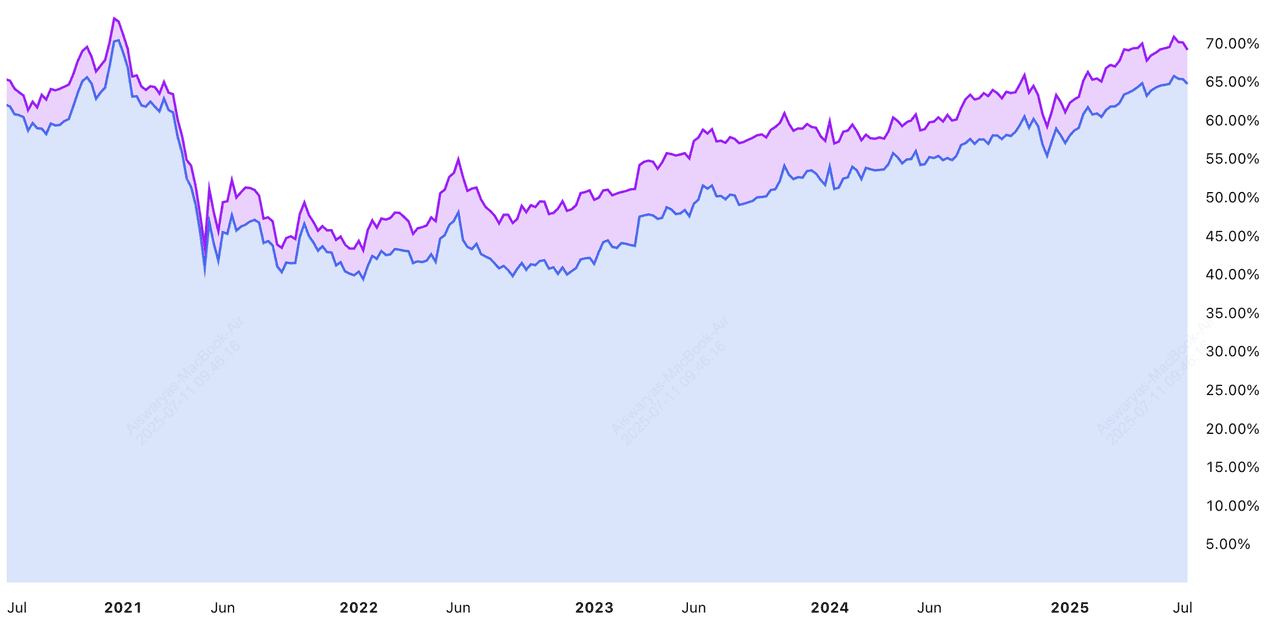
Bitcoin dominance over the years | Source: TradingView
Think of this metric as your market thermometer. It measures whether traders are flocking to Bitcoin’s “digital gold” appeal or splashing into riskier altcoins.
• Rising BTC.D: A rising dominance percentage often indicates that traders are reallocating into Bitcoin’s relative safety, especially during periods of heightened volatility or market uncertainty. For example, Bitcoin dominance surged in early 2025 as U.S. President Trump’s crypto-friendly policies and institutional ETF inflows sent BTC prices soaring.
• Falling BTC.D: Conversely, when BTC.D falls below around 54%, it signals growing risk appetite and often marks the start of an altcoin season (altseason) as traders pour into altcoins - crypto tokens beyond BTC.
CoinMarketCap’s live dominance chart updates this ratio around the clock, making it a go-to sentiment gauge for both beginners and pros.
BTC Dominance and Altcoin Season: What’s the Connection?
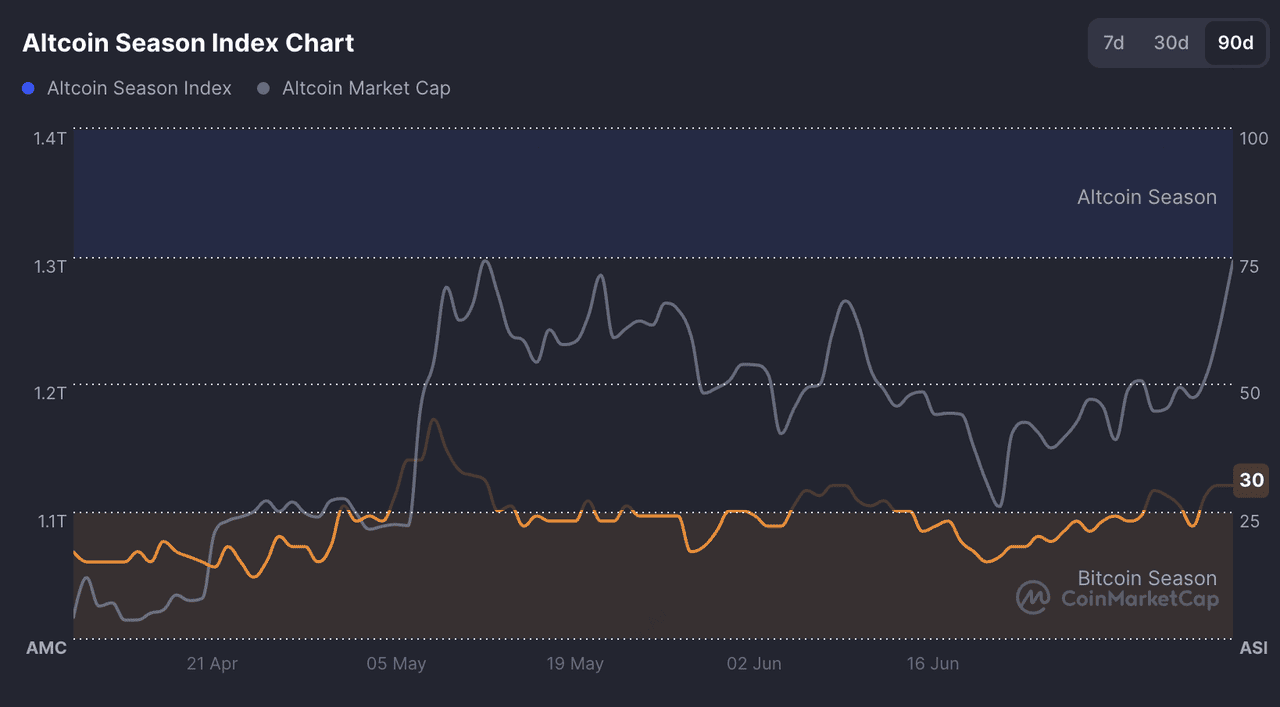
Altcoin season index | Source: Coinmarketcap
On the flip side, declining dominance frequently signals the onset of an altcoin season, when alternative tokens capture the market’s imagination and deliver outsized returns. To date in 2025, only 17% of altcoins have outperformed Bitcoin over a 90-day window, a sign that broad-based alt rallies are still taking shape. Key confirmatory signals include:
Key Altseason Signals
By monitoring these signals alongside BTC.D, you can capitalize on altseason entry points, shifting exposure into high-potential alts before the broader market catches on.
1. BTC.D Breakdown: Watch for Bitcoin dominance falling below 54%, historically a strong cue that altcoin demand is heating up.
2. Rising Altcoin Volume: Look for daily trading volume in the top 20 alts to surpass Bitcoin’s volume on major exchanges, an on-chain confirmation of capital flows.
3. Altcoin Season Index: Tools like the CMC Altcoin Season Index refresh daily, flagging when the broad altcoin market is outperforming BTC.
How to Calculate Bitcoin Dominance
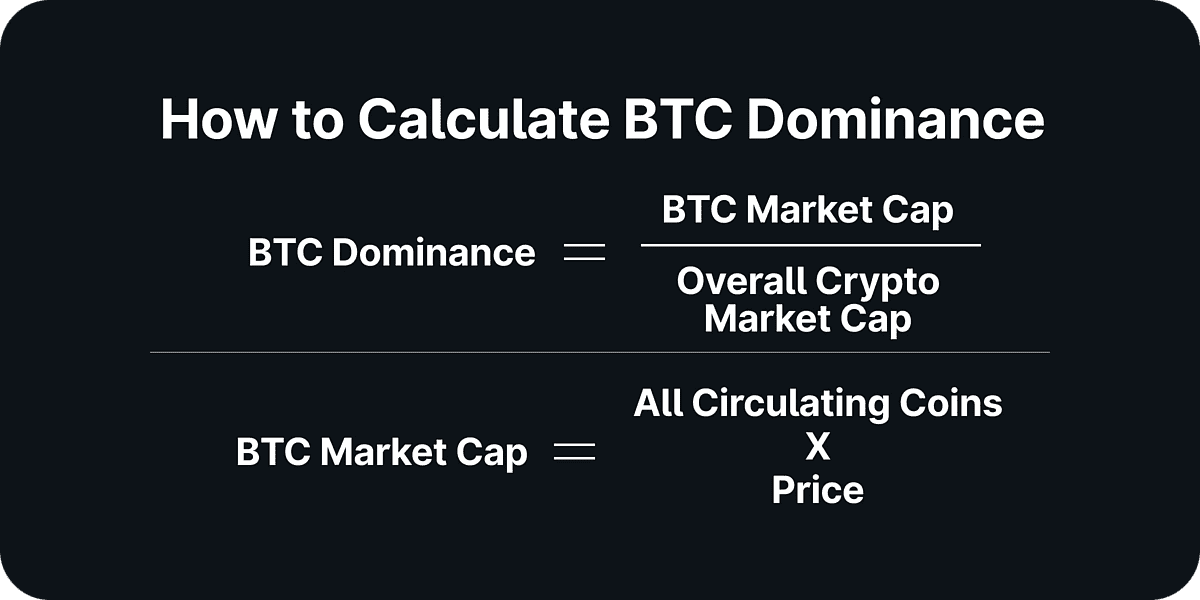
Source: CoinGecko
Before you can use Bitcoin dominance as a trading signal, you need to know exactly how it’s derived. Calculating BTC.D is straightforward; once you have the right data and tools, you’ll be charting market sentiment in minutes.
1. Gather Accurate Market Caps: Head to a reliable data aggregator such as CoinMarketCap or CoinGecko. Note Bitcoin’s market capitalization on its dedicated page, and then locate the “Global Cryptocurrency Market Cap” banner for the combined value of all coins in circulation.
2. Apply the Dominance Formula: Plug your figures into this formula to transform raw figures into an instantly understandable percentage:
BTC Dominance (%) = (Bitcoin Market Cap ÷ Total Crypto Market Cap) × 100
For instance, if BTC’s market cap is $2.1 trillion and total crypto market cap is $3.3 trillion: (2.1 ÷ 3.3) × 100 = 63.6% BTC.D.
3. Leverage Real-Time Charting Tools: Use platforms like TradingView, CoinCodex, or CoinGecko’s integrated charts, which ingest live market-cap feeds and auto-plot BTC.D. These charts refresh every 1-5 minutes and let you:
i. Overlay BTC Price: Compare dominance shifts with Bitcoin’s USD price moves.
ii. Draw Technical Levels: Identify key support and resistance on the dominance curve.
iii. Toggle Timeframes: Switch between intraday, daily, and multi-year views to capture both short- and long-term trends.
4. Interpret the Data for Trading: With your BTC.D chart live, you’ll immediately see whether capital is flocking to Bitcoin’s relative safety or chasing gains in altcoins. Armed with this real-time gauge, you can fine-tune your allocation, time entries and exits, and manage risk more effectively.
Bitcoin Dominance in Each Market Cycle Over the Years
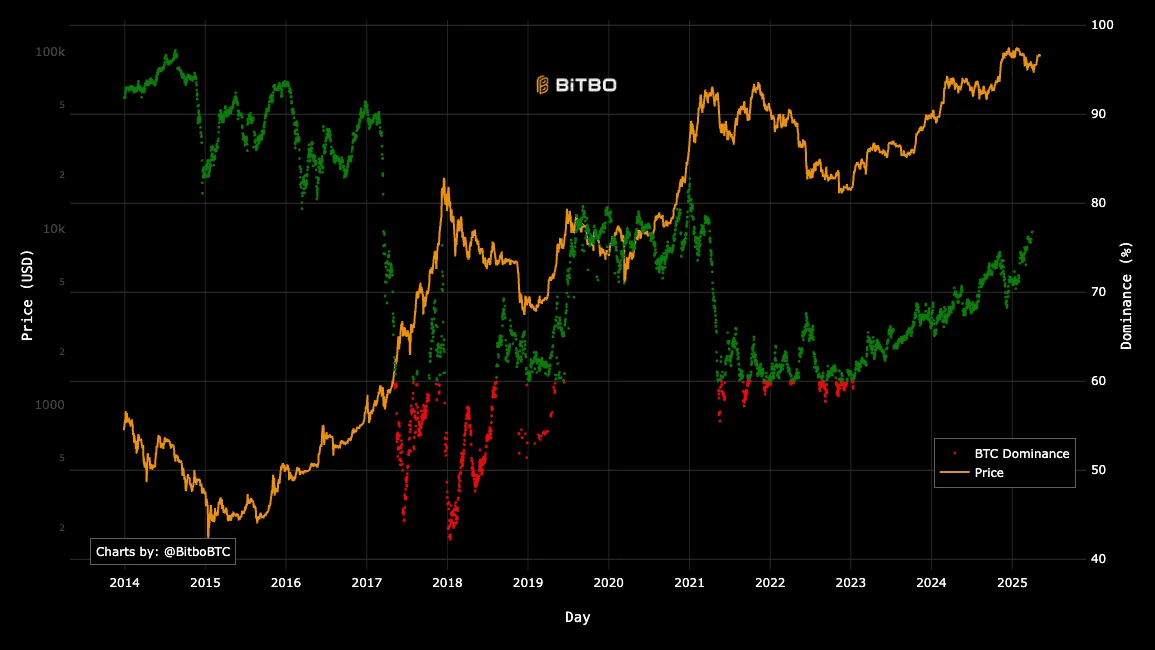
Bitcoin dominance vs. BTC price | Source: BitBo
The following milestones in Bitcoin's journey aren’t just historical footnotes - they’re live barometers. By tracking BTC.D through each major crypto market cycle, you gain clear signals for when to rotate into Bitcoin’s safety or lean into altcoin-driven rallies, sharpening your timing for entries, exits, and portfolio tilts.

Bitcoin dominance over past market cycles | Source: TradingView
Early Days (2009-2016): Near-100% Dominance
When Bitcoin launched in January 2009, it stood alone, controlling 100% of the entire crypto market cap. Even after Ethereum’s mainnet launch in mid-2015, Bitcoin dominance (BTC.D) remained above 94%, underscoring that virtually all investor attention, development activity, and market liquidity was funneled into BTC. This era highlights how BTC.D can reflect technological leadership and the absence of viable alternatives.
ICO Boom (2017): Dominance Plunges Below 40%
The frenzy around 2017’s Initial Coin Offerings (ICOs) ushered in more than 1,500 new tokens in a single year. As capital chased rapid altcoin gains, some projects soaring 100×, BTC.D nosedived to ~38.7% by January 2018. This dramatic fall not only marked the start of a full-blown altcoin season but also signaled a pivot in trader psychology: risk appetite peaked, and speculative bets overtook Bitcoin’s perceived safety.
DeFi Summer (2020-2021): Alt Season Reignites
After the ICO peak in early 2018, the market entered a prolonged crypto winter. Most speculative altcoins cratered, with the total market cap sliding from $830 billion in January 2018 to below $130 billion by December 2018. During this downturn, investors fled failed tokens back into Bitcoin’s deep liquidity, pushing BTC.D back above 70% by mid-2019. Throughout 2019, Bitcoin slowly regained favor: its price recovered from $3,200 lows to around $10,000 by the end of the year, while many altcoins saw only modest rebounds or collapsed entirely. This period of consolidation underscored Bitcoin’s resilience and reinforced its status as the market’s “safe haven.”
By April 2020, just weeks before the May 11 halving, and in the aftermath of the March COVID-19 crash, BTC.D had climbed to around 72%, up from 65% at the start of the year. This consolidation at high dominance levels set the stage for the DeFi-driven capital rotation that kicked off in June 2020, when yield farming and new token models reignited altcoin rallies. Fueled by yield farming, NFTs, and new layer-1 blockchains, the DeFi boom split the limelight. Between March 2020 and May 2021, Bitcoin’s price rocketed from $8,000 to $64,000, yet BTC.D tumbled from 70% to ~38%- a testament to how innovative token use-cases can redirect massive capital flows away from Bitcoin, even during its own bull run.
ETF Approval & 2024 Halving: Dominance Stabilizes at 50-60%
January 2024’s U.S. spot Bitcoin ETF approvals unleashed $1.5 billion of institutional inflows in just 72 hours, reaffirming BTC’s role as a “digital gold.” Coupled with the April 2024 halving, which cut new BTC issuance in half, BTC.D rebounded into the 50-60% band, touching 64% in April 2025 as altcoin fever cooled. This phase illustrates how supply-side shocks and mainstream adoption can anchor Bitcoin’s market share.
July 2025: BTC.D at 63.8%, Altcoins Showing Signs of a Potential Rotation
As of July 2025, Bitcoin dominance (BTC.D) sits at 63.8%, reflecting Bitcoin’s firm grip on market capitalization following its surge to a new all-time high of above $116,893. This level marks one of the highest dominance readings since late 2021, signaling that institutional capital and retail investors alike have favored Bitcoin as a safe haven amid macroeconomic uncertainties and Trump’s crypto-friendly policies.
However, under the surface, subtle shifts hint at an emerging altcoin rotation. Daily trading volumes for several large-cap altcoins, including Ethereum, Solana, and TON, have started to outpace their 30-day averages. Metrics like the Altcoin Season Index have also inched higher from single digits earlier this year to the low 20s, suggesting that risk appetite may be gradually returning to altcoins. If BTC.D begins to lose its upward momentum and dips below key levels like 60%, it could pave the way for a broad-based altcoin rally in the second half of 2025.
How to Use Bitcoin Dominance for Crypto Trading
Bitcoin dominance (BTC.D) is more than a statistic. It’s a real-time barometer of risk appetite across the entire crypto ecosystem. When headlines shake markets, like unexpected regulatory clampdowns or Fed rate surprises, investors often flee altcoins and pile into Bitcoin’s deep liquidity pools. In early May 2025, for example, BTC.D rocketed to 64.98%, its highest mark since 2021, as traders sought refuge from macro uncertainty and lackluster altcoin rallies.
Integrating Bitcoin Dominance into Making Trading Strategies
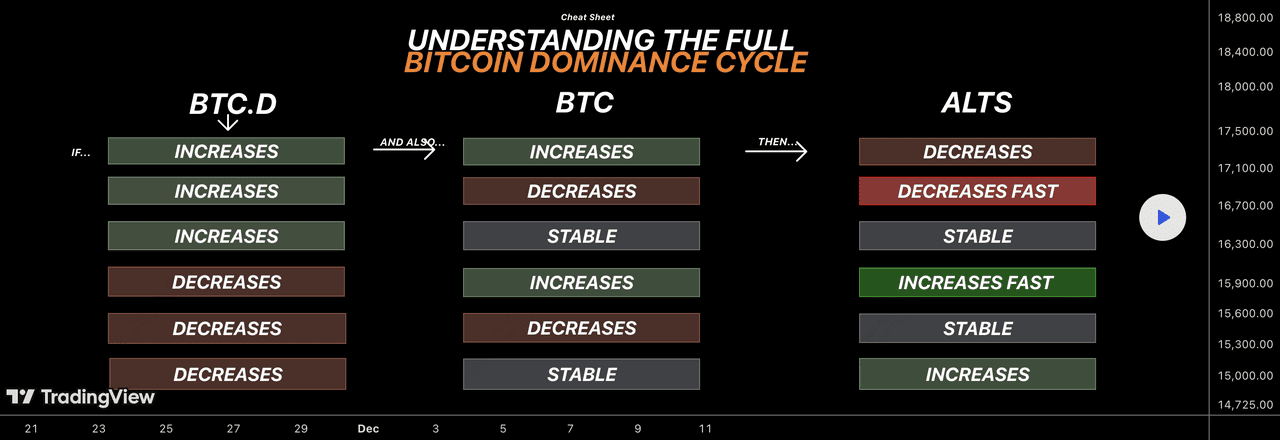
Bitcoin dominance vs. Altcoin season: A flowchart | Source: TradingView
Bitcoin dominance (BTC.D) is an active tool for both high-level portfolio tilts and tactical trade execution. Here’s how to put BTC.D to work across your investment framework:
1. Portfolio Tilts:
• Defensive Allocation: When BTC.D climbs above 60–65%, increase your Bitcoin weighting to harness its resilience in downturns.
• Offensive Shift: As BTC.D falls below key floors (e.g., 54%), and altcoin volumes surge, selectively diversify into high-potential alts, ideally after confirming rotation via rising alt volumes and altseason indices.
2. Trend Confirmation: Pair BTC.D with Bitcoin’s moving averages (50- & 200-day MA). If dominance breaks above its 200-day MA while BTC price dips below its 50-day MA, it often signals a broader market downturn—time to tighten stops or reduce risk.
3. Support-Level Monitoring: Track BTC.D thresholds (60%, 55%, 54%). Drops through these levels on rising volume flag emerging altcoin seasons, guiding you to gradually increase alt allocations with strong fundamentals and momentum.
4. Risk Management: Sudden dominance spikes typically coincide with market-wide sell-offs. In these moments, consider tightening stop losses or hedging with inverse products before corrections deepen.
5. Quantitative Signals: Incorporate BTC.D as a feature in algorithmic models. By backtesting dominance thresholds against historical returns, you can automate systematic entry and exit signals—leveraging BTC.D’s predictive edge in momentum and mean-reversion strategies.
However, traders should now rely on BTC.D alone. Layer in fundamental analysis (network activity, protocol upgrades) and technical indicators such as Relative Strength Index (RSI), Moving Average Convergence Divergence (MACD), and volume profiles, to validate your trades. You can also combine Bitcoin dominance with the ETH/BTC ratio, a rising ETH/BTC ratio alongside declining BTC.D often signals broader altcoin outperformance, while a declining ETH/BTC with rising dominance reinforces a BTC-centric market stance.
What Are the Key Factors Influencing Bitcoin Dominance?
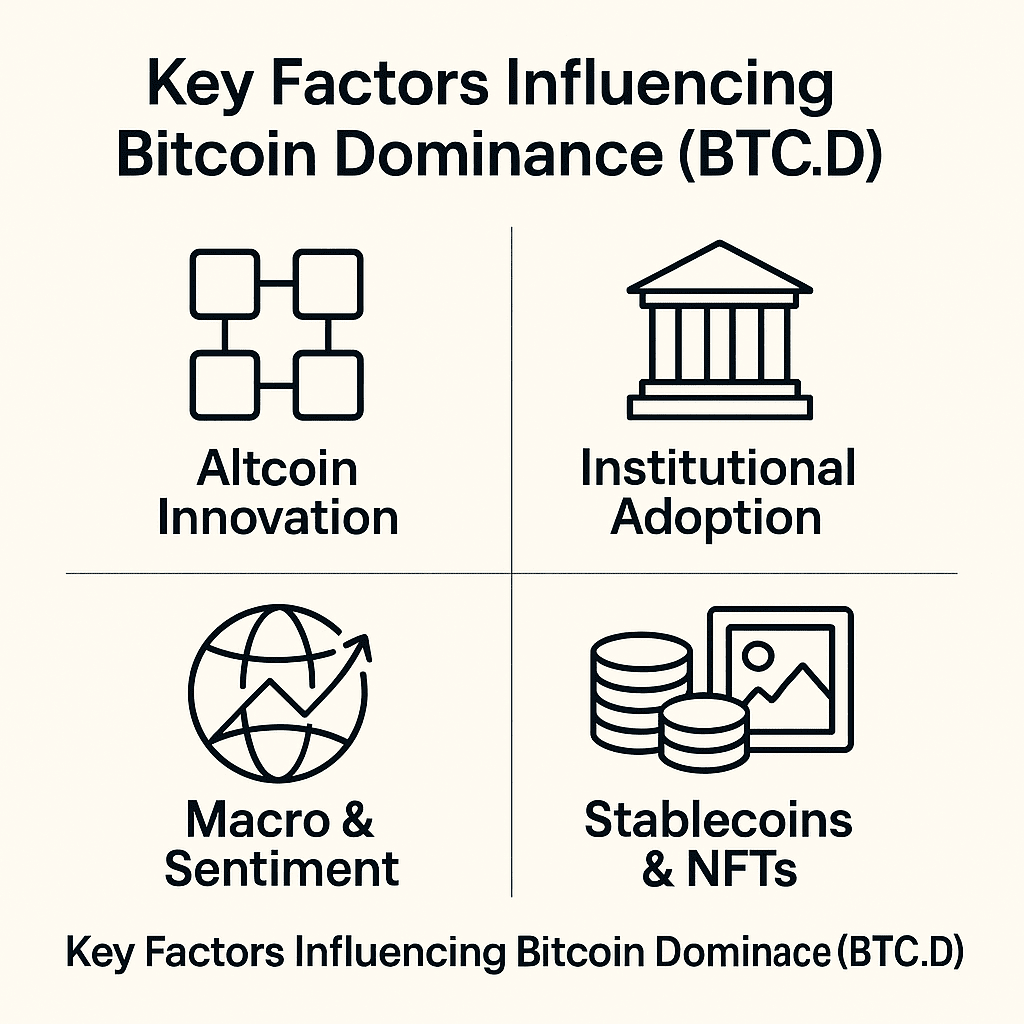
What impacts Bitcoin dominance?
Bitcoin dominance doesn’t move in a vacuum; several external forces tug at BTC’s share of the market. Understanding these drivers helps you anticipate shifts in dominance before they fully play out.
1. Altcoin Growth: Every time a new blockchain or token emerges, whether it’s a layer-1 challenger like Solana or a utility token powering DeFi, capital is siphoned away from Bitcoin’s share of the pie. Fresh use cases (e.g., staking, NFTs, on-chain gaming) can attract speculative flows, driving altcoin market caps higher and pushing BTC.D lower.
2. Rising Institutional Adoption: Landmark approvals, like the U.S. spot Bitcoin ETFs in January 2024, can inject billions of institutional dollars into Bitcoin, lifting BTC.D into the 50-60% range. Conversely, sudden crackdowns or bans on exchanges in major markets can force altcoin liquidations and spike Bitcoin’s relative share as traders seek the “least worst” crypto safe haven.
3. Macro & Sentiment: During global uncertainty, be it inflation jitters, a looming recession, or bearish “crypto winter” headlines, investors often rotate out of riskier alts and back into Bitcoin’s deep liquidity pools. Dramatic shifts in BTC.D frequently coincide with increased volatility and equity-crypto correlations, making dominance a real-time sentiment barometer .
4. Stablecoins & NFTs: The rise of stablecoins, now over $257 billion in market cap as of July 2025, and explosive NFT launches can artificially depress BTC.D without reflecting genuine demand for altcoins as investments. These non-BTC assets have unique utilities, such as payment rails, digital art, metaverse assets, that skew the dominance ratio against Bitcoin.
Limitations & Common Pitfalls of Using BTC.D
Bitcoin vs. USDT dominance | Source: TradingView
While Bitcoin dominance (BTC.D) is a valuable market gauge, it has limitations traders should consider. As of July 2025, stablecoins make up over $257 billion in market cap, inflating the total crypto market cap and slightly lowering BTC.D, even though the impact remains small relative to Bitcoin’s share. Similarly, the constant influx of new tokens, over 5,300 launched daily in early 2024, dilutes BTC’s dominance on paper without reflecting true investor demand, as many of these coins are speculative and short-lived.
BTC.D also doesn’t differentiate between hype-driven projects and high-utility blockchains with modest market caps. This means it can understate the value of smaller networks driving real-world adoption. For a clearer market picture, pair BTC.D with metrics like on-chain activity, trading volumes, and the ETH/BTC ratio.
Looking Ahead
As you navigate the crypto markets, Bitcoin dominance remains a key strategic metric to track, highlighting when capital rotates into BTC’s relative safety or floods into high-beta altcoins. Looking ahead, three key trends will shape BTC.D’s signal strength: ongoing institutional adoption (over $100 billion in spot ETF assets and 95,000 BTC added by corporates in Q1 2025), the rise of Layer-2 networks locking nearly $40 billion in TVL (which may chip away at BTC’s market share), and evolving regulatory clarity (from U.S. stablecoin frameworks to global ETF expansions).
While BTC.D offers a powerful market-phase gauge, it’s most effective when paired with price action, moving averages, and on-chain data like exchange flows or TVL. Use Bitcoin dominance to inform your portfolio tilts, time your entries and exits, and manage risk, then blend it with broader metrics for a truly holistic trading strategy.
Related Reading
FAQs on Bitcoin Dominance (BTC.D)
1. What’s the difference between Bitcoin dominance and BTC price?
BTC price measures Bitcoin’s USD value, while dominance gauges Bitcoin’s share of the total crypto market cap; one is absolute value, the other is market share.
2. Can Bitcoin dominance guarantee a bull run?
No; rising dominance often aligns with market strength but doesn’t guarantee price gains; it’s best used alongside technical and on-chain signals.
3. How often should I check the dominance ratio?
For active traders, checking BTC.D daily (or even intraday on key levels) helps spot rotation; long-term investors can review weekly to monitor broad trends.
4. Which platforms offer real-time Bitcoin dominance charts?
Popular options include CoinMarketCap, CoinGecko, TradingView, and CoinCodex; all update BTC.D every few minutes with interactive chart tools.
5. Is Bitcoin dominance still reliable in a multi-chain world?
It remains a valuable sentiment gauge, but growing stablecoin supply, L2 TVL, and niche tokens mean you should use it alongside other metrics for a complete market picture.