
Crypto markets move quickly, and reversals often appear long before indicators catch up. When price accelerates in one direction and suddenly stalls, traders look for simple signals that reveal whether momentum is fading. The tweezer pattern does exactly that.
It forms when the market rejects the same price level twice, creating a clear sign that buyers or sellers are losing control. In fast conditions, this helps traders spot potential trend reversals early, especially when volatility spikes or support and resistance levels start reacting sharply.
For many traders, tweezer tops and bottoms act as a first alert: a concise candle-based signal that sentiment is shifting and the trend may be preparing to turn.
What Are Tweezer Top and Tweezer Bottom Patterns?
Tweezer top and bottom patterns are two-candle reversal formations that appear when the market rejects the same price level on consecutive candles. A tweezer top forms when two candles share the same high, signalling weakening bullish momentum. A tweezer bottom forms when two candles share the same low, indicating fading bearish pressure.
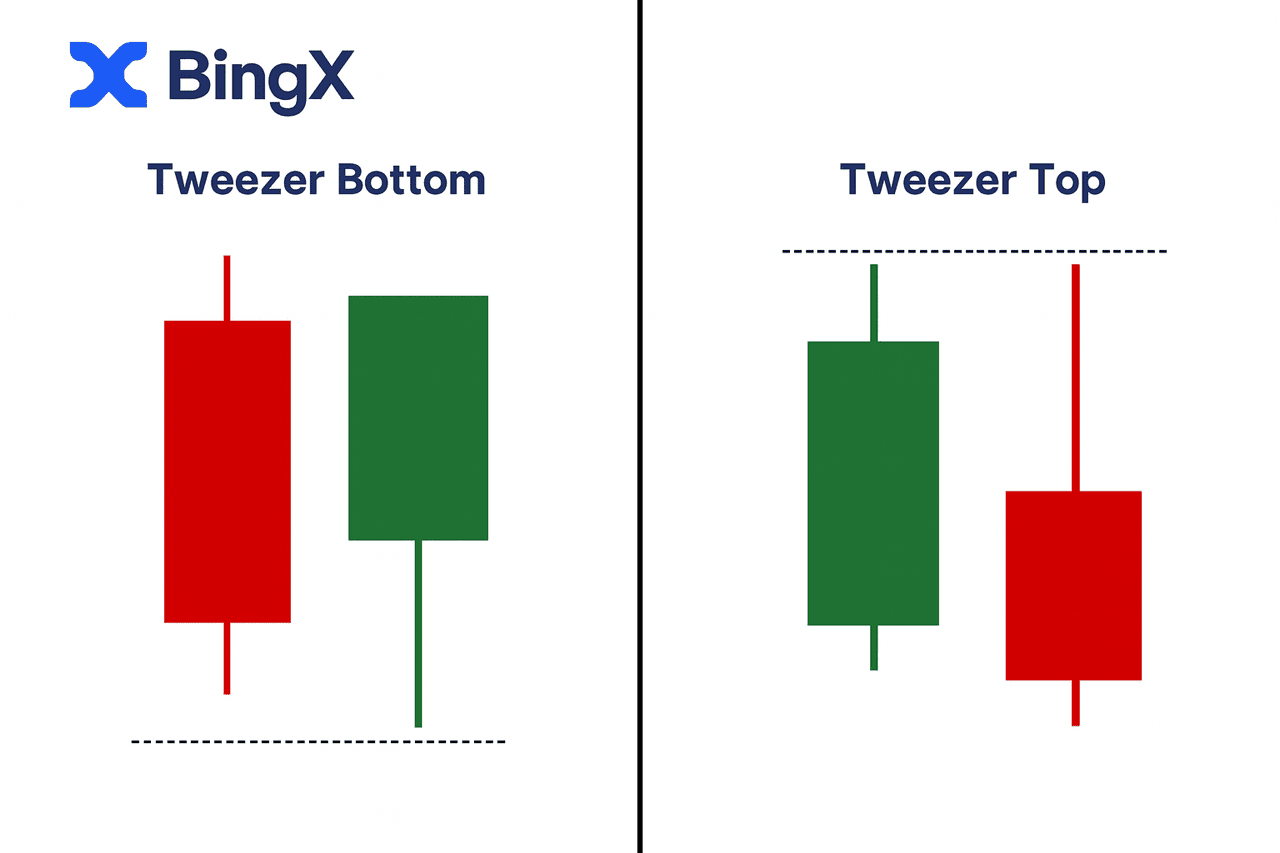
Each pattern consists of two opposite candles, the first showing trend continuation, the second showing immediate rejection. Wick length and real-body size are important: equal highs or lows highlight price rejection, while smaller bodies reflect a loss of control by buyers or sellers.
These setups come from Japanese candlestick charting techniques and are commonly used in crypto technical analysis to identify early reversal signals near support or resistance.
How to Use Tweezer Top Pattern to Spot Bearish Reversals
A tweezer top candlestick pattern stands out because it shows price testing the same high twice and getting rejected both times. The first candle stretches higher, but the second immediately turns lower from the same level. This repeated rejection makes the message clear: buying strength has peaked, and sellers are stepping in with conviction.
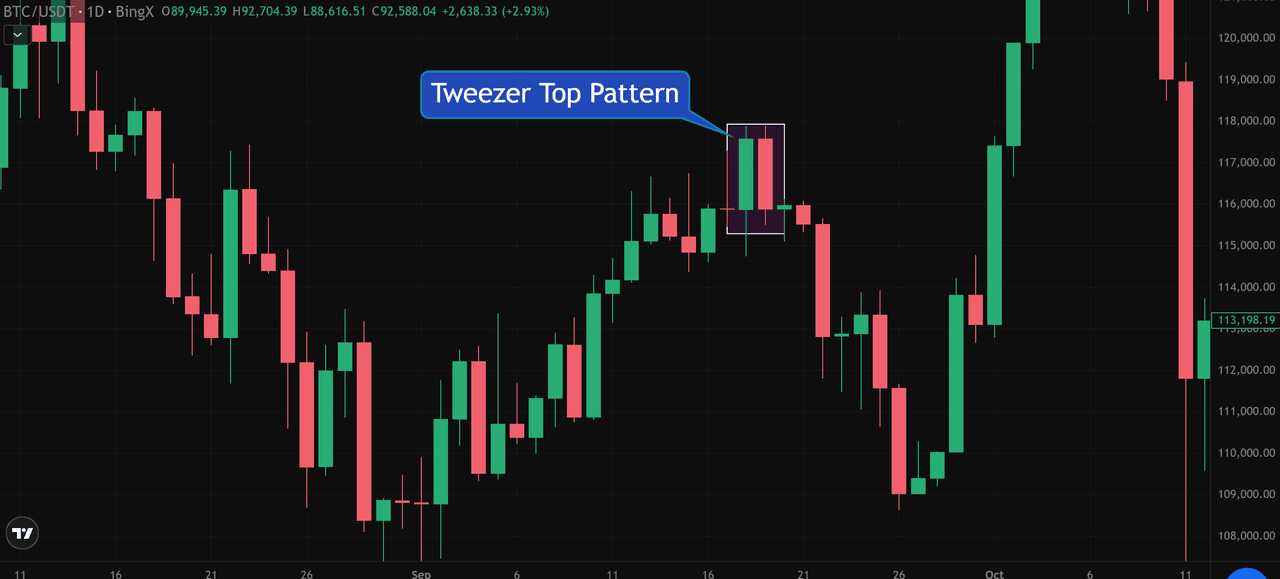
Bitcoin (BTC/USD) Price Chart - Source: BingX
You’ll often see this pattern at strong resistance, in overbought RSI zones, or when a bullish trend starts losing momentum.
In the chart example, Bitcoin printed a tweezer top exactly as the RSI hit 70, signalling stretched bullish conditions.
At the same time, the MACD histogram began shrinking, showing weakening momentum even before the downtrend fully unfolded.
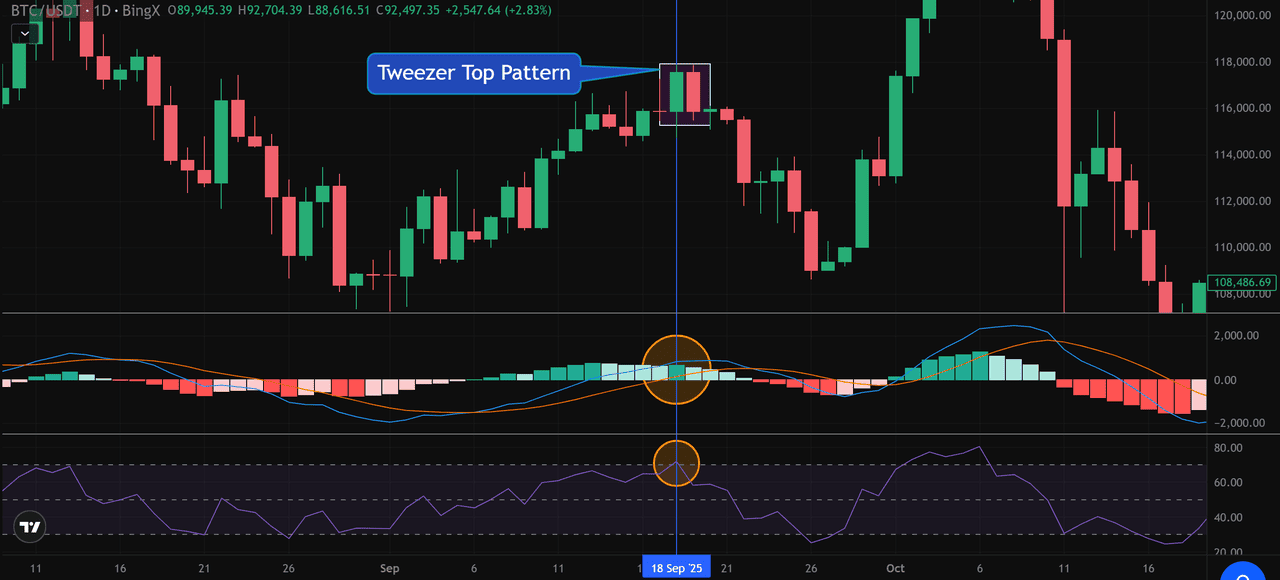
Bitcoin (BTC/USD) Price Chart - Source: BingX
These two signals:
• RSI pushing into overbought territory
• MACD histogram printing smaller bars despite higher price
This makes the tweezer top far more reliable, because they confirm what the candles are already suggesting: momentum is fading.
How to Use Tweezer Bottom Pattern to Identify Bullish Reversals
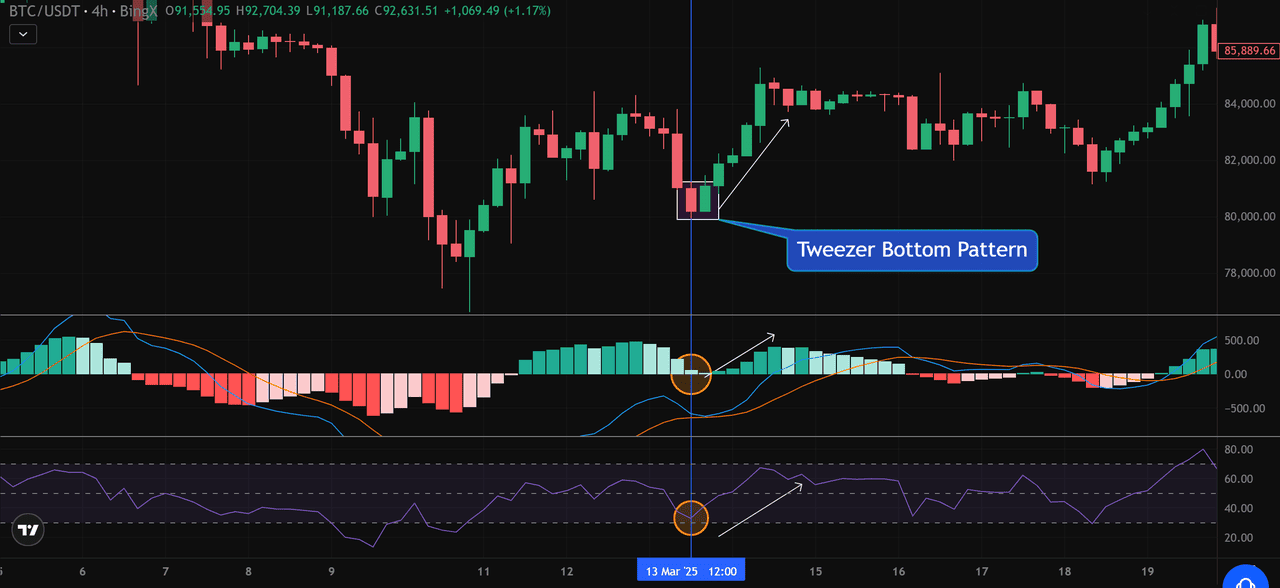
A tweezer bottom candlestick pattern forms when two consecutive candles print the same low, showing that sellers tested the downside twice but failed to push price any lower.
The second candle closing higher is the key shift, it signals that buyers absorbed the final wave of selling and are beginning to take control.
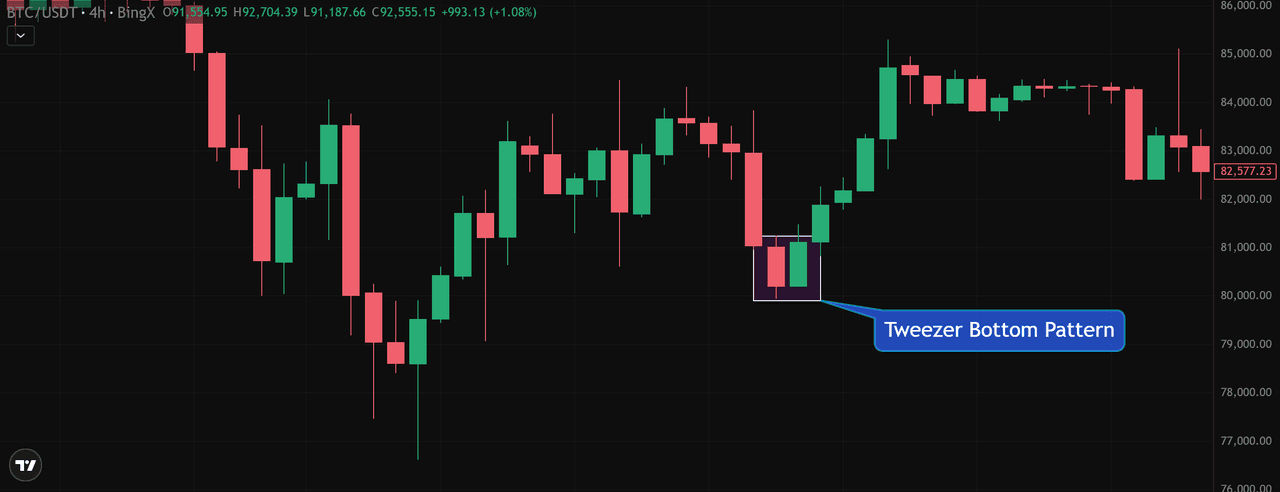
Bitcoin (BTC/USD) Price Chart - Source: BingX
You’ll often find tweezer bottoms at strong support zones, in oversold RSI conditions, or near the end of a heavy selloff. In the example above, Bitcoin formed a clean tweezer bottom exactly as the RSI dipped near 30, indicating oversold territory.
At the same time, the MACD histogram printed its smallest red bars, showing that bearish momentum was fading even before the reversal candle appeared.
Bitcoin (BTC/USD) Price Chart - Source: BingX
These two signals together:
• RSI lifting from oversold levels
• MACD histogram shifting from deep red to lighter red and then green
It gives additional confirmation that bearish pressure is exhausted.
This makes the pattern a strong indicator of bullish reversal potential, especially when the second candle closes firmly green. Traders typically wait for follow-through: a rising MACD line, an RSI uptick above 40, or increasing buy volume. When these elements align with the tweezer bottom, the probability of a trend reversal increases significantly, marking the point where buyers often initiate the next upward leg.
How to Combine Tweezer Patterns with Technical Indicators for Reliability
Technical indicators help confirm whether a tweezer pattern reflects real market pressure. The Moving Average Convergence Divergence (MACD) shows momentum through expanding or shrinking histograms and clear crossover signals.
The Relative Strength Index (RSI) strengthens the reversal when it reaches extreme levels, such as near 70 for a bearish tweezer top or below 30 for a bullish tweezer bottom.
A noticeable increase in trading volume on the confirmation candle provides an additional layer of credibility. When these tools align with the pattern, the reversal signal becomes significantly more reliable.
How to Trade the Tweezer Top Pattern: Bearish Setup
A tweezer top tells you the market tried to break higher twice and failed both times. The second rejection candle is the warning, but the third candle provides confirmation, which is where most traders place their sell entry.
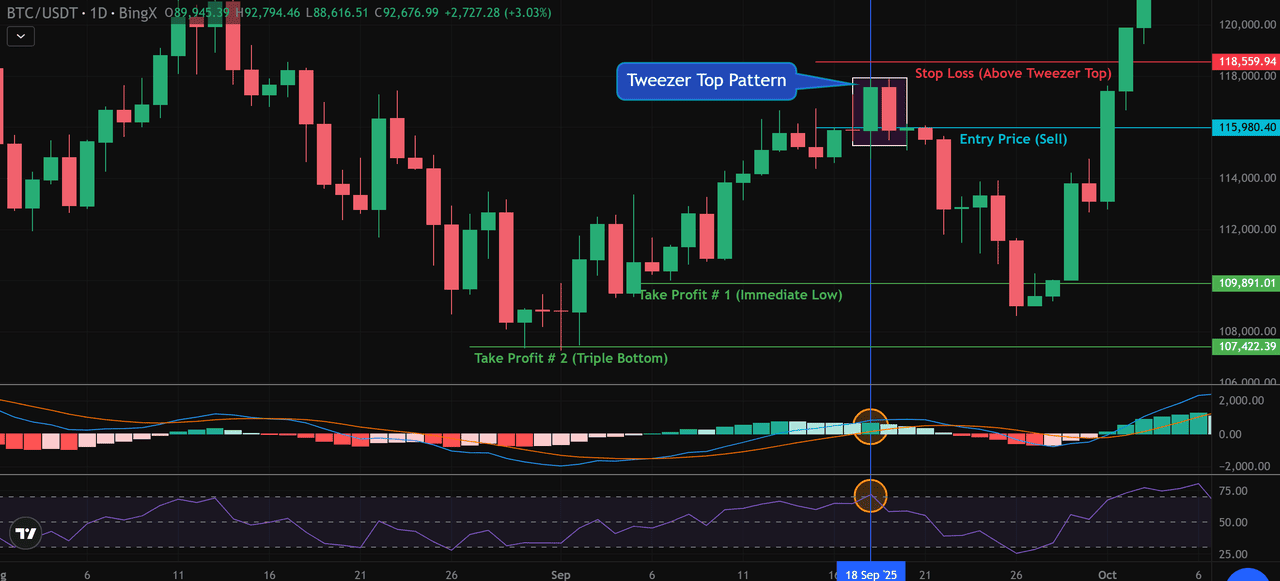
Bitcoin (BTC/USD) Price Chart - Source: BingX
Entry After Confirmation: In the BTC/USDT chart, price tested the $118,500 area twice. The bearish confirmation came on the next candle closing lower around $115,980. This is the safest sell entry, after the pattern is validated.
Stop-Loss Placement: Stops are simple and logical: Place the stop-loss just above the shared high of the tweezer top. In this case, slightly above $118,559. If price breaks above this level again, the pattern is invalid.
Profit Targets: Use recent swing lows for clean profit-taking:
• Take-Profit 1: Immediate support near $109,891
• Take-Profit 2: Deeper support (triple bottom) near $107,422
This gives a balanced plan: secure profits early while leaving room for a bigger move if momentum continues.
Indicator Confirmation: The tweezer top gains strength when RSI drops from 70, the MACD histogram shrinks, and the MACD lines converge, together signalling fading bullish momentum and confirming that the rejection is a genuine bearish shift.
How to Trade the Tweezer Bottom Pattern: Bullish Setup
A tweezer bottom signals that sellers tried to push lower twice but were rejected at the same level. The second candle shows the bounce, but the third candle confirms the shift in control.
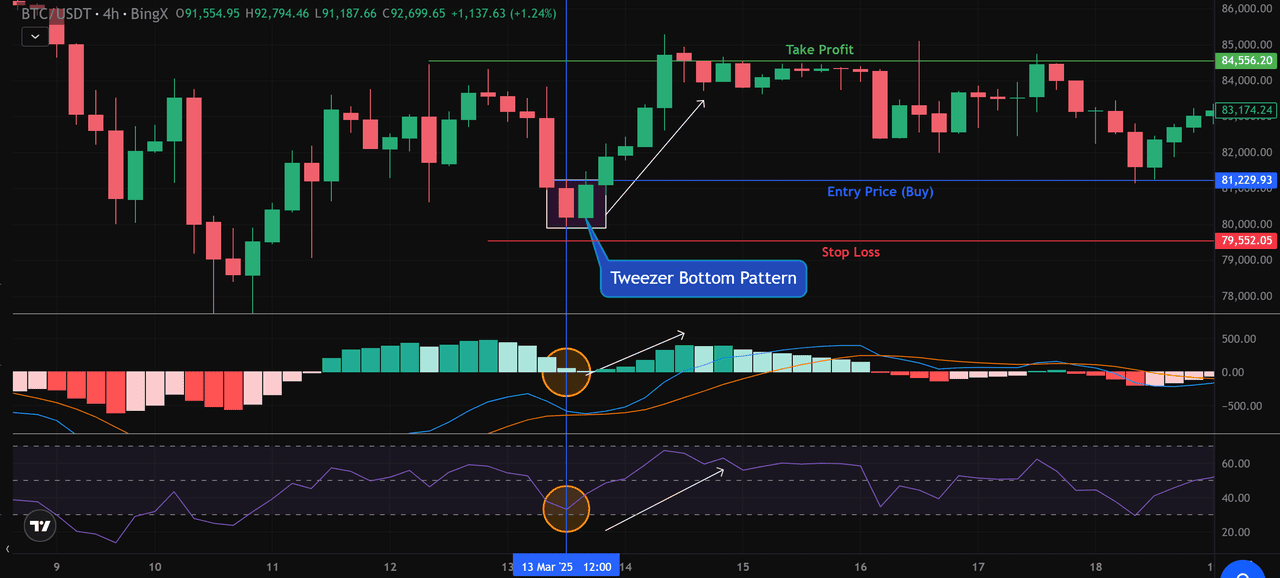
Bitcoin (BTC/USD) Price Chart - Source: BingX
Entry After Confirmation: In the BTC/USDT example, the market rejected the $79,552 zone twice. The bullish confirmation came when the next candle closed higher at $81,229. This is the ideal buy entry, after the buyers clearly step in.
Stop-Loss Placement: Your stop-loss should sit just below the pattern’s shared low. Here, slightly under $79,552. This protects the trade if sellers break the floor again.
Profit Targets: Use logical resistance levels to set targets:
• Take-Profit: First major resistance around $84,556 (Price reacted to this level in previous swings.)
More advanced traders may take partial profits here and let the rest ride if momentum remains strong.
Indicator Confirmation: The tweezer bottom strengthens when RSI rebounds from oversold near 30, the MACD histogram turns green, and the MACD lines cross upward, together signalling a clear shift to bullish momentum and a higher-probability reversal.
Tweezer Patterns vs. Other Reversal Signals
Tweezer tops and bottoms often appear beside other major reversal patterns, but each one tells a slightly different story about market pressure.
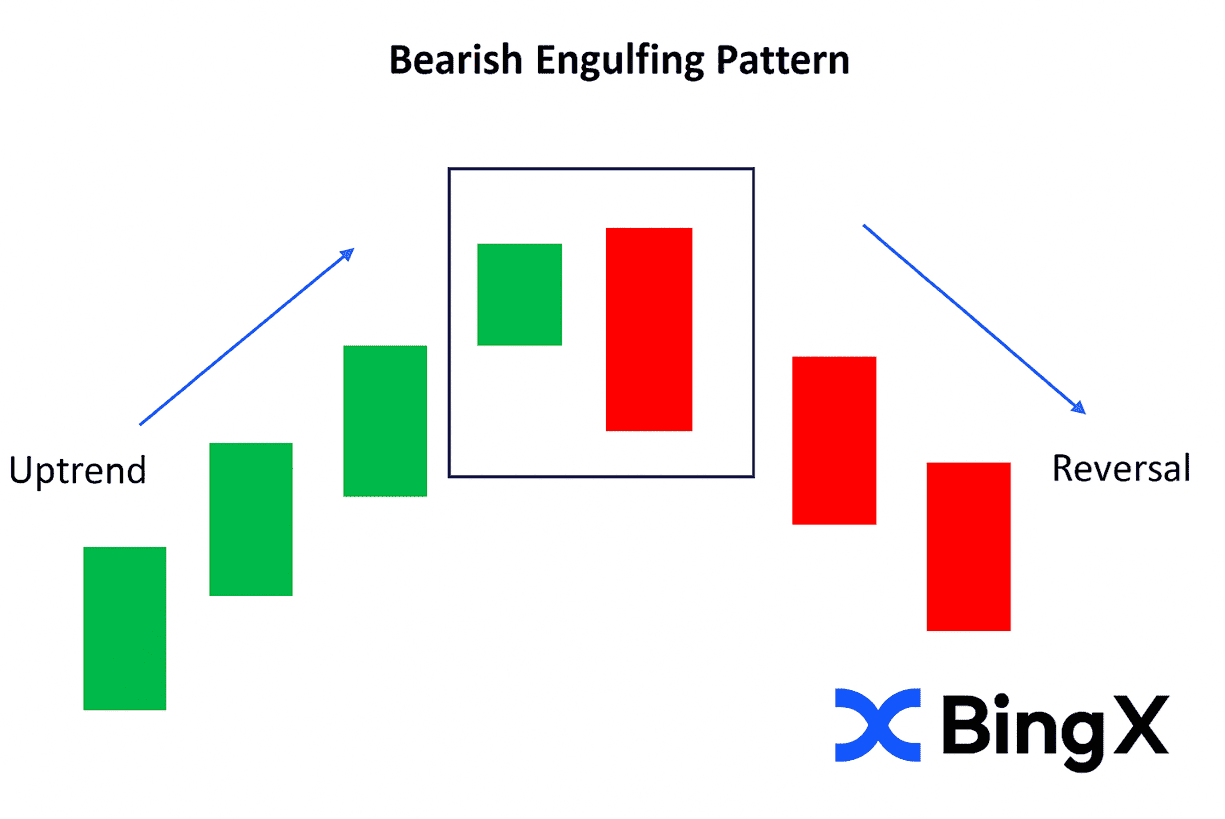
1. Engulfing pattern: An engulfing pattern usually carries more weight because the second candle fully overtakes the first, showing a stronger and more immediate shift in sentiment.
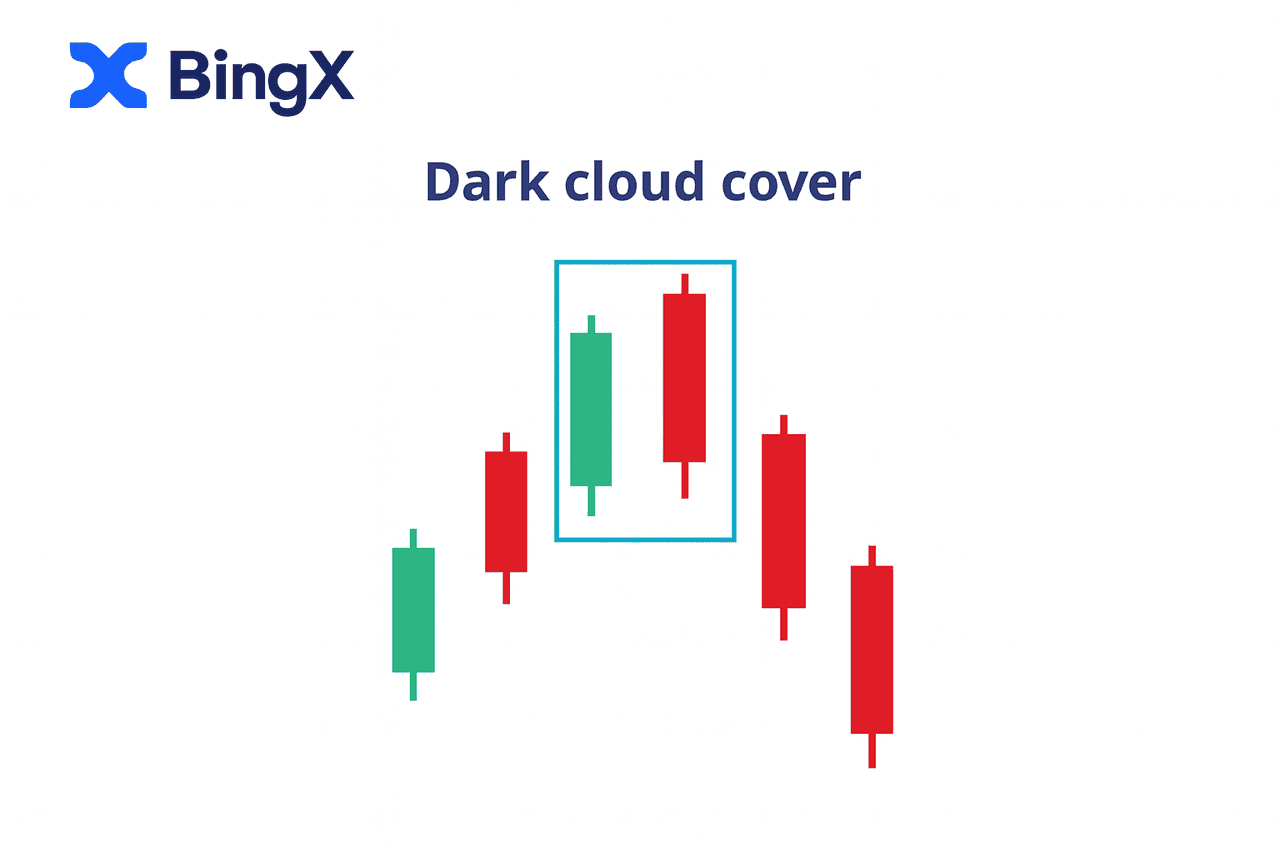
2. Dark Cloud Cover: Dark Cloud Cover and Piercing Line patterns add context through deeper candle penetration levels, which can make their signals more forceful than a simple level rejection.
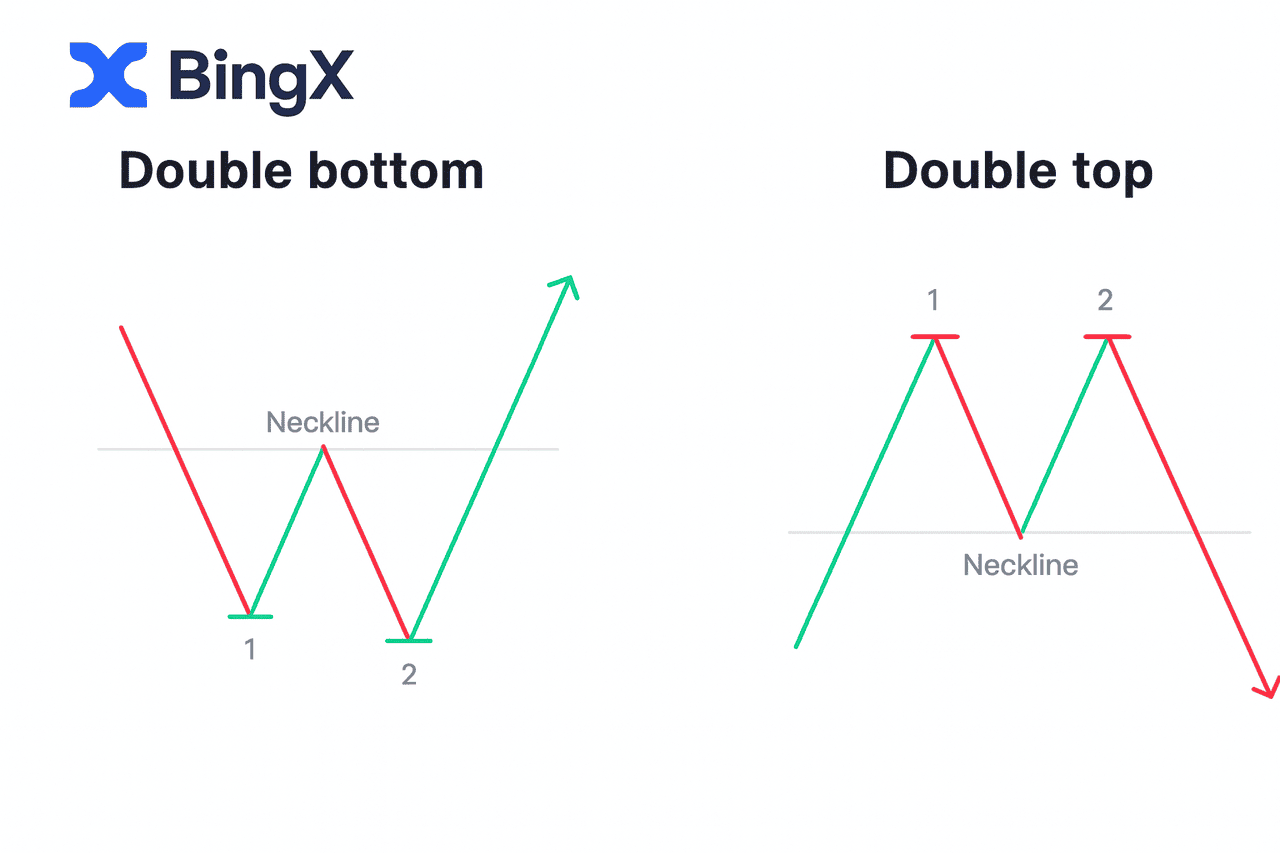
3. Double Top and Double Bottom Patterns: Meanwhile, double tops and double bottoms take longer to form and usually act as higher-confidence reversal structures because the market spends more time testing and failing in the same zone.
Tweezer formations are strongest when they line up with clear support or resistance and when indicators confirm momentum loss. They’re weaker when volatility is low or when the candles form in isolation without support from volume, trend structure, or other signals.
In fast-moving crypto markets, tweezers work best as an early warning rather than a standalone reversal proof.
How to Avoid False Signals and Common Mistakes With Tweezer Patterns
Tweezer tops and bottoms look simple, but most bad trades come from taking the pattern at face value without checking the context. In slow or sideways markets, price often hits the same level several times, so what looks like a tweezer can easily be noise. The pattern only starts to matter when it forms at a clear support or resistance zone and aligns with the overall trend.
Another common mistake is entering as soon as the two candles match. Without waiting for the confirmation candle, the pattern has no real meaning. The third candle is what proves whether buyers or sellers have genuinely stepped in. Many traders also mislabel patterns by forcing tweezer logic onto candles whose highs or lows don’t properly align.
Indicators help here. If the Relative Strength Index and Moving Average Convergence Divergence doesn’t show momentum fading or turning, the rejection is usually weak. Candle structure matters too: shallow wicks or oversized bodies reduce the strength of the signal, while clean rejections usually carry more weight.
By combining the pattern with trend direction, key price levels, indicator confirmation, and proper stop placement, traders avoid chasing false setups and focus on the tweezer formations that actually signal a meaningful shift in sentiment.
Final Tips for Using Tweezer Patterns in Crypto
Tweezer tops and bottoms can be incredibly useful when you treat them as early clues rather than automatic reversal signals. They work best when they appear at meaningful support or resistance levels, line up with the broader trend, and get confirmation from indicators like volume, the Relative Strength Index, or the Moving Average Convergence Divergence.
Higher timeframes also help filter out noise, especially in fast-moving crypto markets where quick rejections can appear all day without leading to a proper reversal. When you combine these patterns with solid structure and momentum analysis, they become a simple but reliable way to spot where sentiment is shifting and where a potential trade may be forming.
Related Reading
6. Simple Moving Average(SMA) vs Exponential Moving Average(EMA) in Crypto Trading: Differences to Know
FAQs on Trading Tweezer Candlestick Patterns
1. What is a tweezer pattern in crypto trading?
A tweezer pattern is a two-candle reversal signal where consecutive candles share the same high or low. Tweezer tops suggest weakening bullish momentum, while tweezer bottoms point to fading bearish pressure.
2. Are tweezer tops and bottoms reliable on their own?
Not always. They work best when confirmed by volume, trend structure, and indicators like the Relative Strength Index or the Moving Average Convergence Divergence. Without context, the pattern can produce false signals.
3. What timeframe is best for trading tweezer patterns?
Higher timeframes such as the 4H and Daily reduce noise and deliver more reliable signals. Tweezers on the 5-minute or 15-minute charts often fail because price rejects levels frequently in low-timeframe noise.
4. Do tweezer patterns always lead to full trend reversals?
No. Sometimes they trigger a short pullback rather than a major reversal. The strength of the move depends on where they form, major support or resistance levels produce stronger outcomes.
5. How do I confirm a tweezer pattern before entering a trade?
Wait for the confirmation candle, check whether the Relative Strength Index shows extreme levels (near 70 or below 30), look for a shift in the Moving Average Convergence Divergence histogram, and verify that volume increases on the breakout or breakdown.