In the fast-paced world of cryptocurrency trading, momentum and trend analysis play a critical role in making informed decisions. The Moving Average Convergence Divergence (MACD), developed by Gerald Appel in the late 1970s, stands out as one of the most versatile indicators.
By blending trend-following and momentum measurements, MACD provides traders with a comprehensive view of market shifts, helping pinpoint potential entry and exit points. Unlike single-purpose indicators, MACD’s dual nature offers clearer signals when markets are about to turn.
This article breaks down how to use MACD effectively in crypto trading, complete with examples, actionable strategies, and tips for maximizing its potential on Bingx markets.
What Is the Moving Average Convergence Divergence (MACD)Indicator?
The Moving Average Convergence Divergence (MACD) is a simple yet powerful tool that helps traders figure out whether cryptocurrency or stock is gaining strength or losing steam. It shows when prices might start rising (bullish) or falling (bearish), making it easier to decide when to buy or sell.
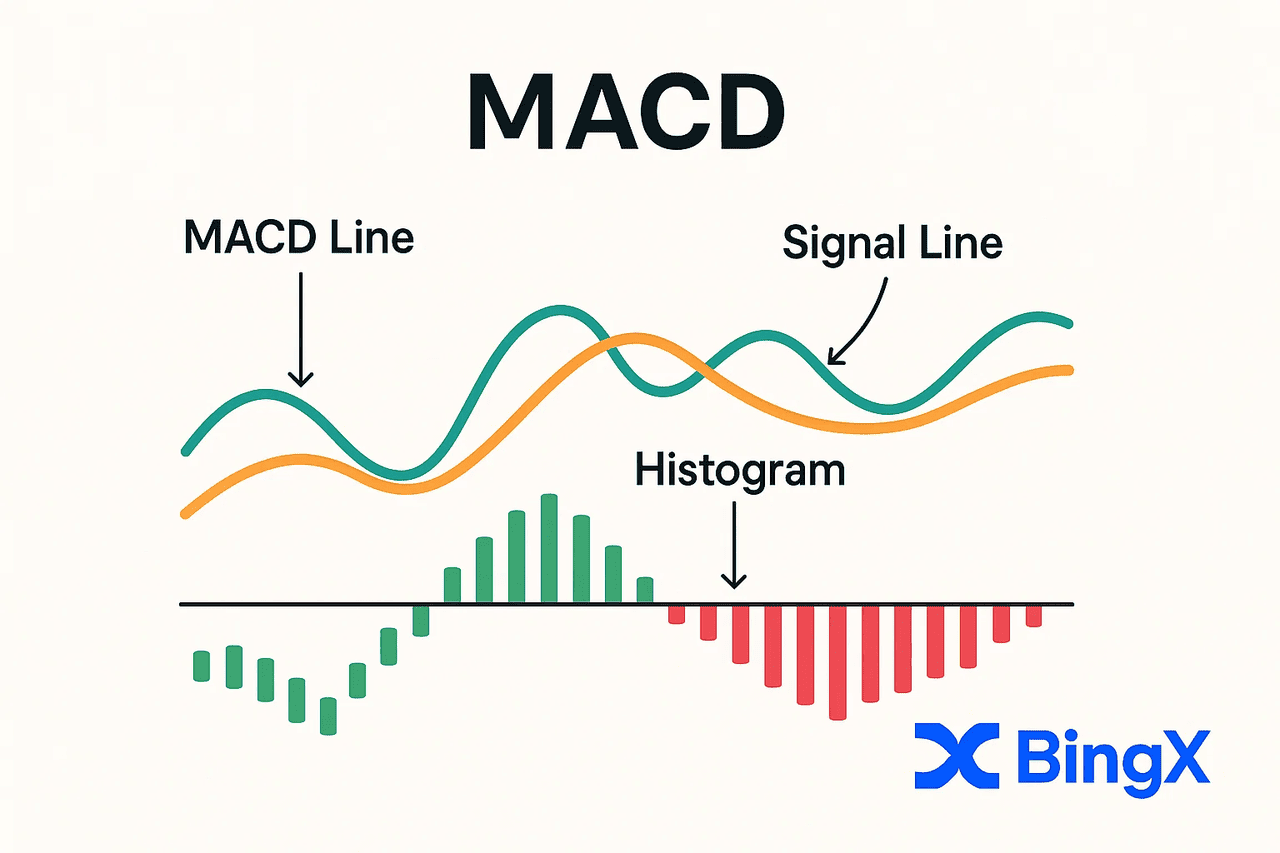
It consists of:
• MACD Line: This shows the difference between recent price movement and the longer-term trend. It helps you see if the price is gaining or losing strength. The MACD Line is calculated by subtracting the 26-period Exponential Moving Average (EMA) from the 12-period EMA.
What’s an EMA? An Exponential Moving Average gives more weight to recent prices, which makes it more responsive to current market moves than a simple average. The 12-period EMA tracks short-term price changes, while the 26-period EMA focuses on the longer-term trend. By comparing the two, the MACD Line highlights momentum shifts.
Source: BTC/USDT Trading Chart on BingX
• Signal Line: This smooths out the MACD Line to make it easier to spot trading signals. When the MACD Line crosses above the Signal Line, it often means the price is gaining upward momentum (bullish). When it crosses below, it could suggest the price is losing strength (bearish).
• Histogram: The histogram plots the difference between the MACD Line and the Signal Line. When the histogram bars grow, momentum is increasing. When they shrink, momentum is fading.
Source: BTC/USDT Trading Chart on BingX
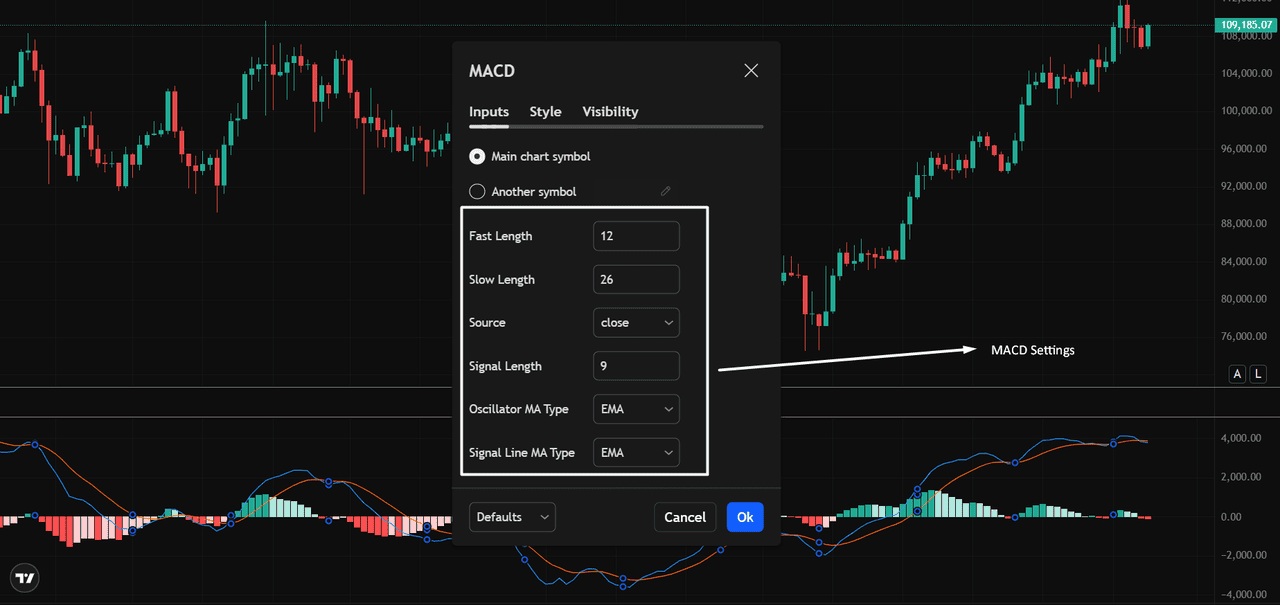
The default MACD settings are 12, 26, 9, optimized for balance across multiple timeframes. These values are commonly used by crypto traders and available by default on most charting platforms.
MACD is typically displayed in a separate panel beneath the price chart, where traders can observe crossovers, histogram growth or contraction, and zero-line shifts.
Key Benefits of Using MACD for Crypto Trading
The Moving Average Convergence Divergence (MACD) offers several advantages that make it a favorite among crypto traders:
• Identifies trend direction and strength: MACD helps traders confirm if a market is trending up or down and how strong that trend is.
• Offers clear bullish and bearish crossovers: The crossover of the MACD Line and Signal Line provides actionable entry and exit signals.
• Works across assets and timeframes: MACD is versatile, applicable to Bitcoin, Ethereum, or altcoins, and works on intraday to long-term charts.
• Combines trend and momentum signals: Unlike simple moving averages, MACD blends price trends and the speed of price movement into a single indicator.
• Beginner-friendly: MACD’s visual format with lines and a histogram makes it easy to interpret, even for traders new to technical analysis.
This blend of simplicity and versatility makes MACD a valuable tool in any crypto trader’s toolbox.
How to Read MACD on a Price Chart
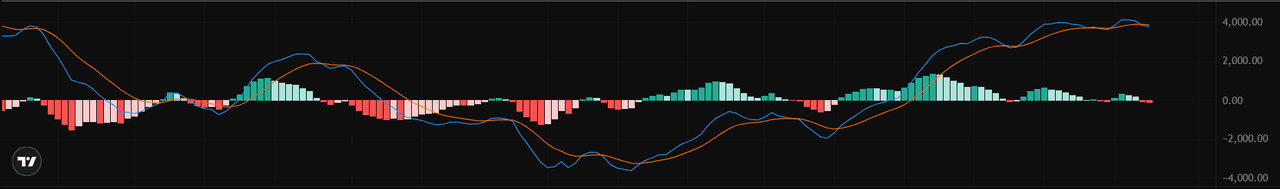
The MACD indicator is displayed below the main price chart and features two key lines along with a histogram, making it easy to track momentum shifts and trend changes.
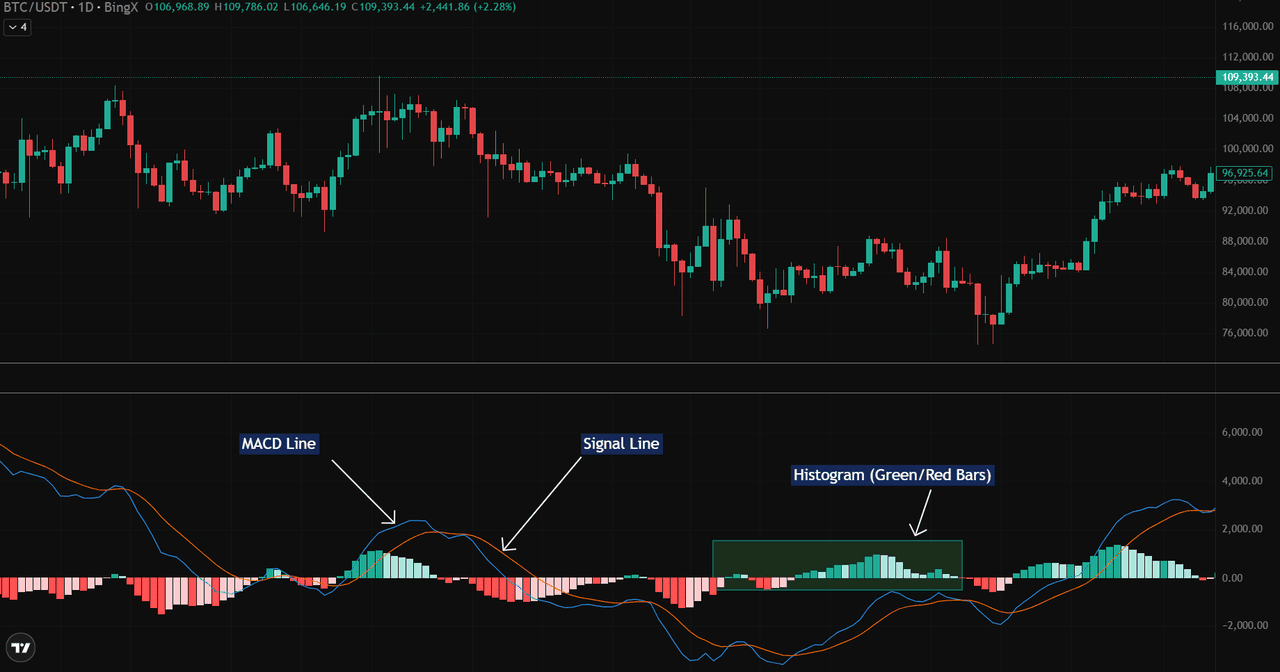
Source: BTC/USDT Trading Chart on BingX
• MACD Line (Blue): This plots the difference between the 12-period and 26-period EMAs, showing momentum changes.
• Signal Line (Orange): A 9-period EMA of the MACD Line, smoothing the signal and clarifying crossovers.
• Histogram (Green/Red Bars): Displays the difference between the MACD Line and the Signal Line.
- Green bars indicate the MACD Line is above the Signal Line, showing bullish momentum.
- Red bars show the MACD Line below the Signal Line, signaling bearish momentum.
- When these bars expand above or below the zero line, it confirms the strength of the move.
- For example, a green histogram rising above zero indicates strong bullish momentum.
MACD Strategies for Crypto Trading
The MACD isn’t just for trend spotting. It’s a practical tool for identifying trading opportunities. Let’s explore four powerful MACD strategies crypto traders can use.
1. Crossover Signals and Histogram Insights
One of the simplest MACD strategies involves watching for crossovers between the MACD Line and Signal Line. These crossovers highlight momentum shifts and can align with price turning points.
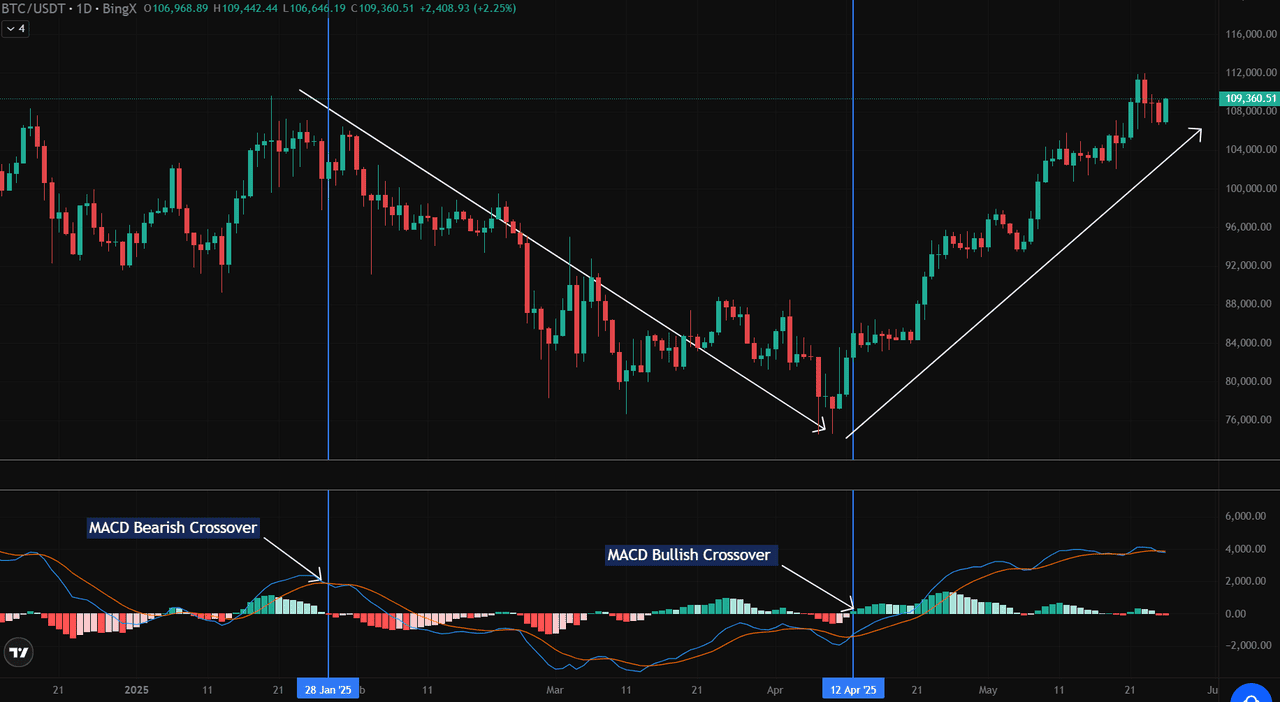
Source: BTC/USDT Trading Chart on BingX
Bullish Crossover: On 12 April 2025, the MACD Line crossed above the Signal Line as BTC traded near $78,000, signaling a potential reversal. This was followed by a rally pushing BTC toward $110,000 by May.
Bearish Crossover: On 28 January 2025, a bearish crossover appeared when BTC was in the $102,000 to $106,000 range, marking the start of a downtrend.
Zero Line Cross: When the MACD Line crosses the zero line (centerline), it indicates a shift in overall momentum. For instance, after the 12 April bullish crossover, the green histogram expanded above zero, reinforcing the upward trend.
Histogram Expansion/Contraction: Expanding green bars above zero show growing bullish momentum, while contracting bars suggest a slowdown. Notably, the histogram peaked around 25 April 2025 as BTC surged past $105,000, reflecting strong momentum.
Grid Trading Bots: These bots use predefined grid levels to execute buy and sell orders. Incorporating MACD can help determine the overall trend direction. For instance, traders might activate or pause a bot when MACD suggests momentum is strengthening or weakening, ensuring the bot trades in sync with broader price trends.
2. Zero Line Crosses for Trend Confirmation
The MACD Line crossing the zero line, also known as the baseline, signals a broader shift in market bias—either bullish or bearish.
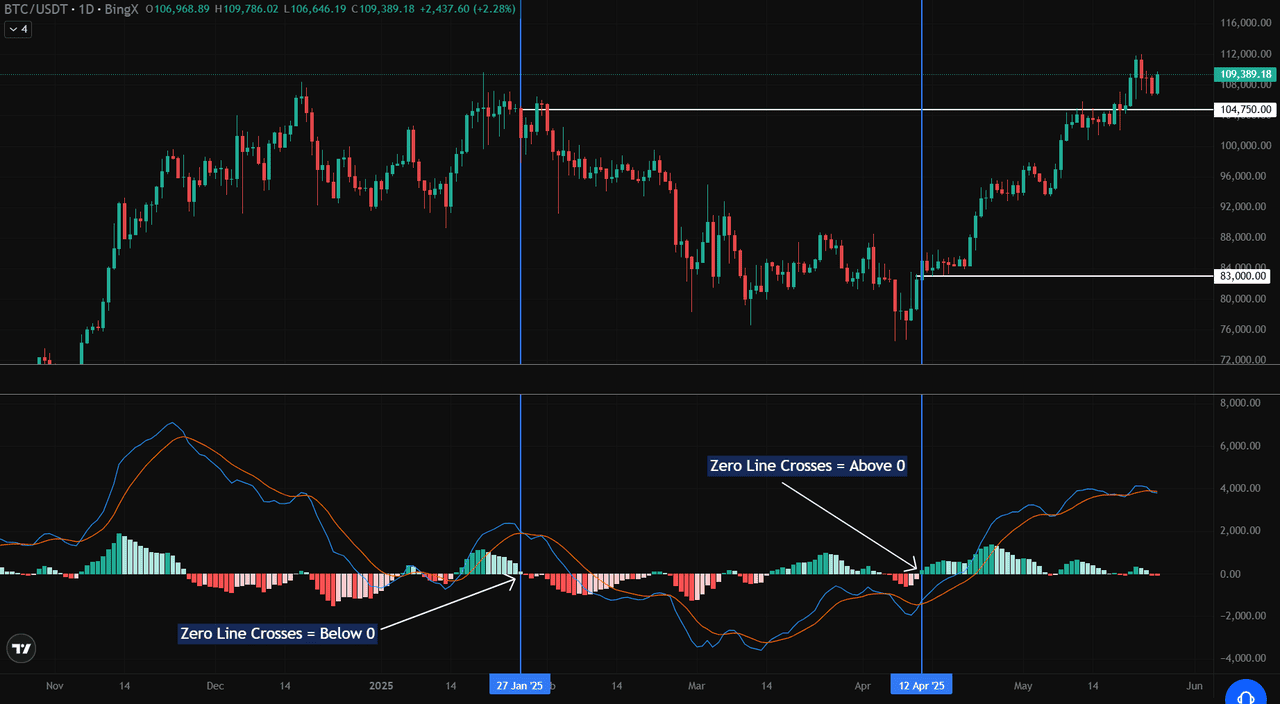
Source: BTC/USDT Trading Chart on BingX
• Above Zero: When the MACD Line crossed above zero on 12 April 2025, BTC was trading near $84,000, signaling a shift into bullish territory. This move coincided with a breakout past $104,750, reinforcing bullish momentum.
• Below Zero: On 27 January 2025, the MACD Line crossed below zero while BTC was trading near $106,000, marking the start of a broader bearish phase. BTC later fell towards $83,000, confirming the trend reversal.
These zero line crosses provide strong confirmation signals when combined with price action and crossover patterns. The upward cross above zero supports bullish setups, while the drop below zero helps confirm bearish reversals.
3. Histogram Momentum Analysis
The MACD histogram’s expansion and contraction provide visual cues about momentum strength and potential shifts in market trends.
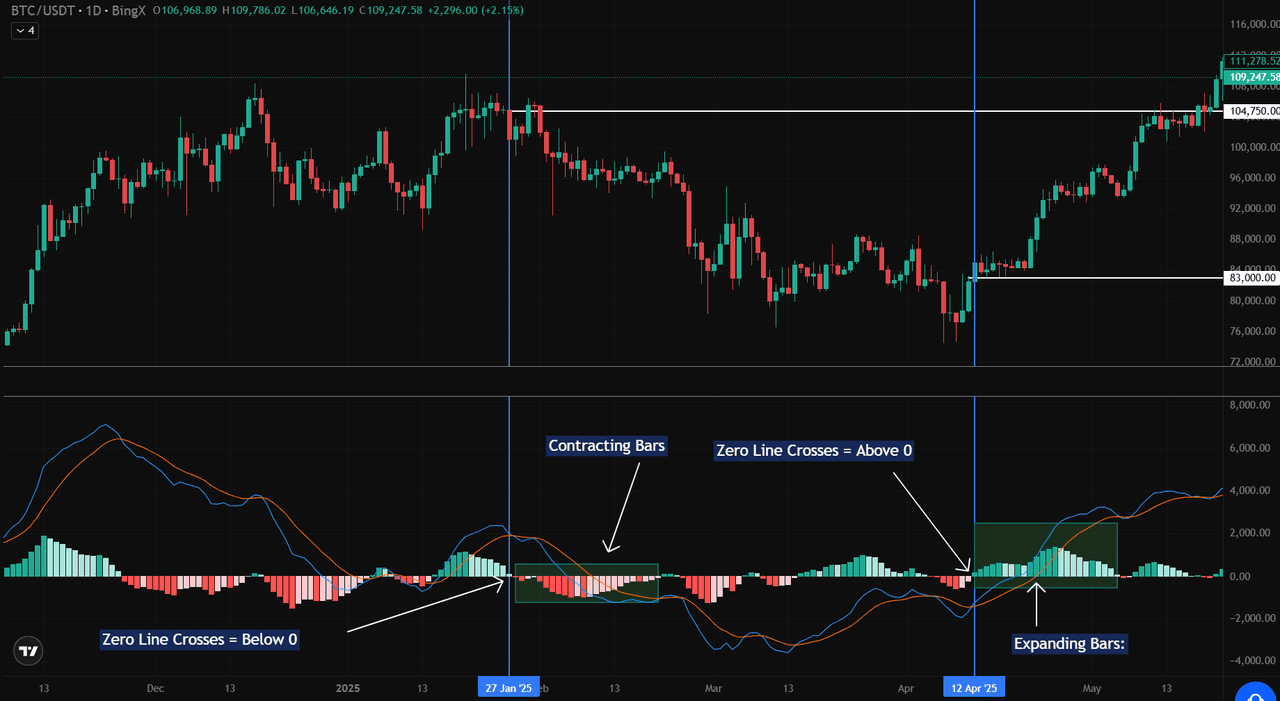
Source: BTC/USDT Trading Chart on BingX
• Expanding Bars: When the MACD histogram’s green bars expand above the zero line, it indicates that bullish momentum is strengthening. For example, in late April 2025, the histogram expanded as BTC surged from around $84,000 to $109,000, confirming the ongoing bullish move.
• Contracting Bars: Conversely, when green bars begin to shrink or red bars appear, it suggests that momentum is weakening. This was evident in early May 2025, as the histogram started contracting while BTC consolidated near $109,000.
• Below Zero: Red histogram bars below zero indicate sustained bearish momentum. In January 2025, as BTC dropped from around $106,000 to $83,000, the histogram expanded downward, signaling strong bearish momentum.
• This helps spot traders confirm directional bias, while futures traders might use it to align leverage with trend strength.
• Grid traders can use the zero line as a filter, only allowing trades in the trend’s direction.
By watching the histogram alongside price action, traders can gain early warnings of potential reversals or momentum slowdowns.
4. MACD Divergence
Divergence between price action and the MACD is a powerful signal that momentum may be shifting, often foreshadowing a trend reversal. When the price and the MACD move in opposite directions, it’s worth paying attention.
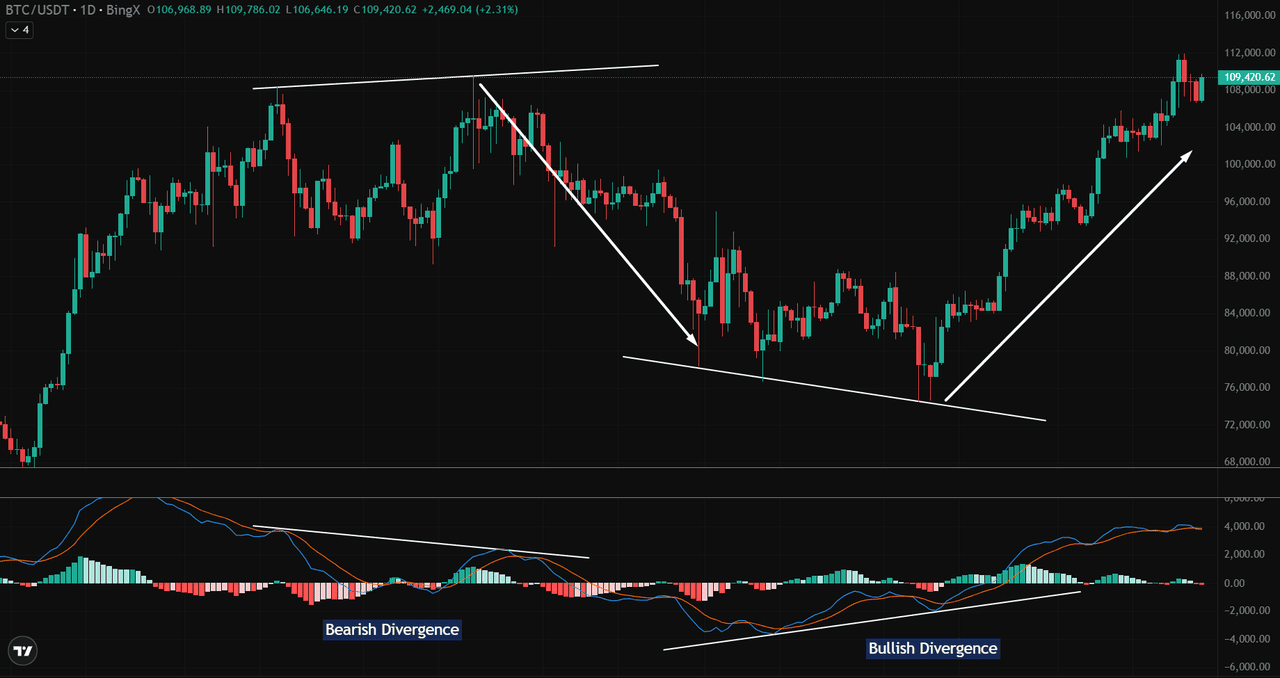
Source: BTC/USDT Trading Chart on BingX
• Bearish Divergence: In late January 2025, BTC made higher highs near $110,000, but the MACD Line formed lower highs during the same period. This divergence indicated weakening bullish momentum. Shortly afterward, BTC’s price reversed downward, eventually falling below $84,000.
• Bullish Divergence: During late March to early April 2025, BTC’s price created lower lows around $76,000, while the MACD Line formed higher lows. This bullish divergence signaled that selling pressure was easing. A strong rally followed, pushing BTC’s price above $109,000 by mid-May.
• Spot and futures traders can use this to anticipate breakouts or breakdowns. For example, if BTC makes higher highs but MACD forms lower highs, it could suggest weakening momentum and a potential pullback.
• Grid trading bots can also benefit: divergence signals might suggest pausing the bot or tightening grid ranges to avoid trading against a reversal.
MACD divergence is a crucial signal for traders to anticipate trend shifts. When combined with trendlines, price structures, and volume analysis, these divergences can enhance trade confidence and timing.
How Can MACD Be Implemented in Trading Strategies
1. Use MACD in Spot Trading
As of May 27, 2025, Bitcoin is trading around $108,566, following a recent peak of $111,332 on May 23. This price movement reflects a period of consolidation, with the market exhibiting a blend of optimism and caution. The MACD (Moving Average Convergence Divergence) indicator, a tool used to assess trend strength and direction, currently shows signs of weakening momentum.
For example, a grid trading bot in the spot market places buy and sell orders at fixed intervals above and below a base price to profit from price swings. However, during strong trends, this strategy can struggle. MACD can help confirm if a trend is forming. If the MACD Line crosses above the Signal Line or moves above zero, traders might pause the bot to avoid countertrend trades.
When momentum slows, exhibiting shrinking histogram bars, traders can adjust the grid spacing and trade size to reduce risk. MACD can also filter trades, letting the bot place only long orders in bullish trends or short orders in bearish trends.
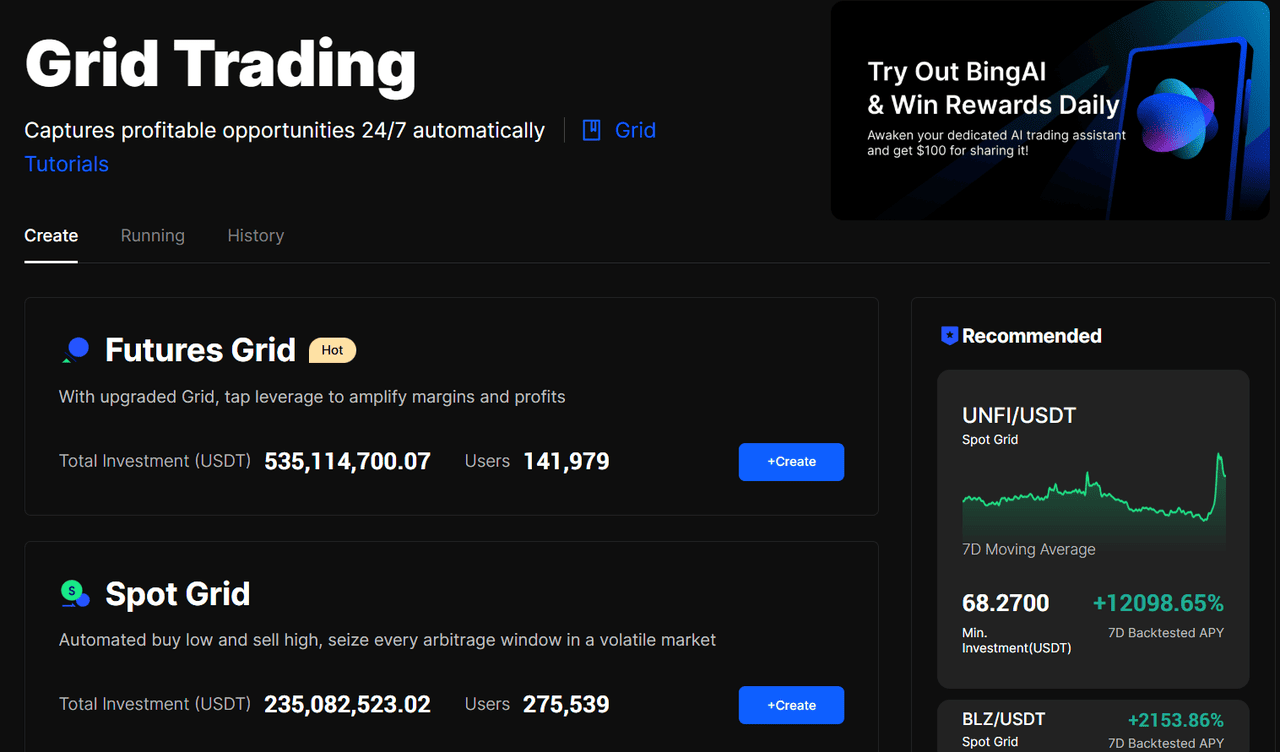
Source: BingX Grid Trading Bot
2. Use MACD in Futures Trading
In futures trading, where leverage magnifies both gains and losses, MACD is crucial for risk management. When MACD shows a bullish crossover, traders might increase leverage slightly to ride upward momentum.
If MACD turns bearish, reducing leverage or even hedging with a small short trade helps manage risk. Futures traders often rely on MACD to confirm strong trends and adjust positions accordingly.
For example, if you see a bullish crossover, you might open a long position to catch the upward trend. If you notice a bearish crossover, you could lower your leverage to manage risk or open a small short position to protect your trade.
Combining MACD with Other Tools
While MACD is powerful on its own, combining it with other indicators enhances reliability. Pair it with moving averages (like the 50-day or 200-day SMA) to confirm trend direction.
Use trendlines or Fibonacci levels to define support and resistance zones for precise entry and exit points. Volume spikes can further validate MACD signals by showing strong market participation.
Example 1: MACD + RSI Alignment
On 12 April 2025, BTC displayed a bullish MACD crossover near $84,000, with RSI rising above 50. This combination led to a rally toward $109,000.
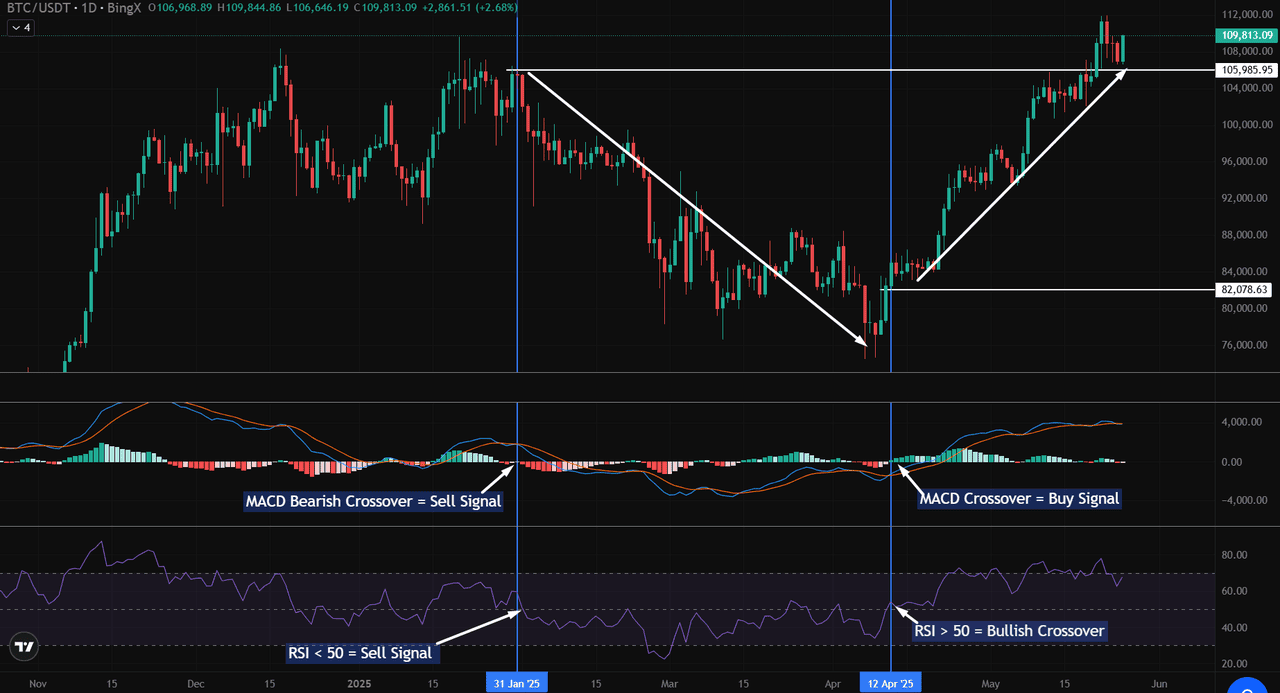
Source: BTC/USDT Trading Chart on BingX
Conversely, on 31 January 2025, BTC presented a bearish setup: MACD crossed below the Signal Line around $102,000, with RSI dropping below 50. BTC subsequently fell toward $84,000.
Example 2: MACD + RSI + Trendline Breakout
On the same date, BTC/USDT exhibited a more comprehensive setup:
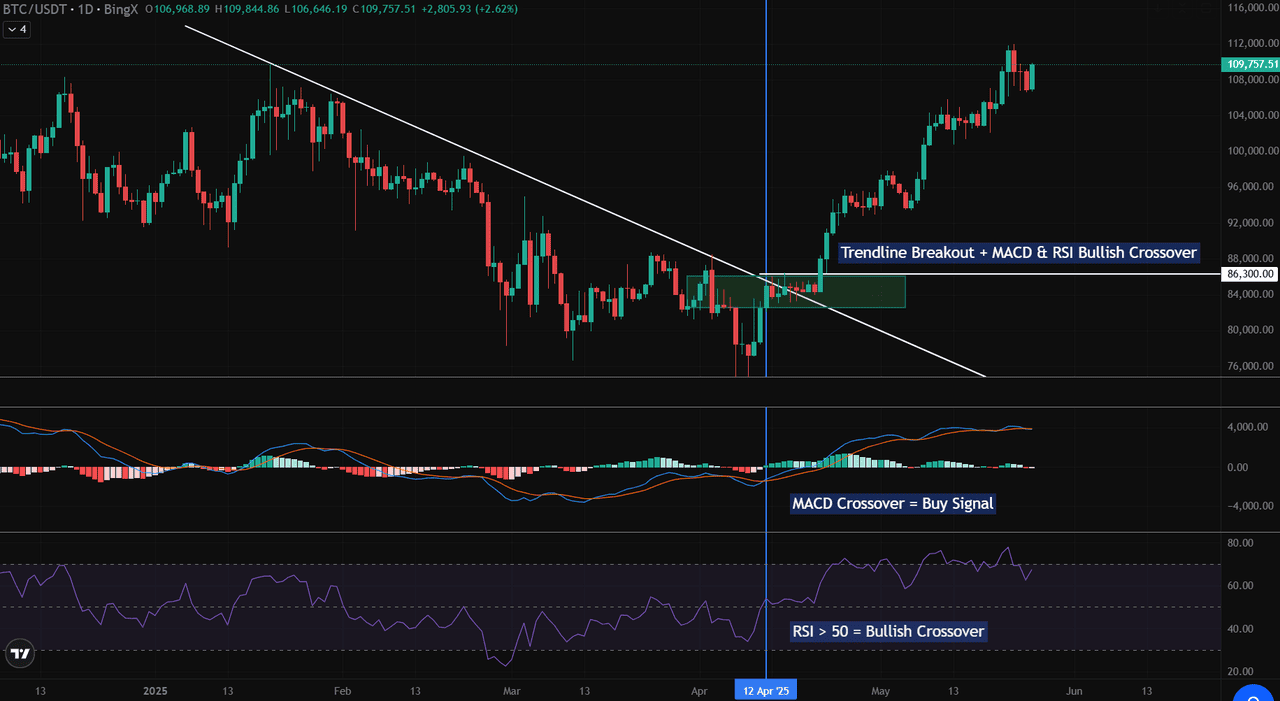
Source: BTC/USDT Trading Chart on BingX
• MACD Bullish Crossover: The MACD Line crossed above the Signal Line, signaling bullish momentum.
• RSI Bullish Crossover: RSI climbed above 50, confirming upward momentum.
• Trendline Breakout: Price broke above a descending trendline near $86,300, reinforcing the trade signal.
• Following this alignment, BTC surged toward $109,000, validating the multi-tool strategy.
Using MACD with trendlines, RSI, and price structure helps filter false signals and increases confidence in trade decisions.
Limitations of Using MACD Indicator in Sideways Markets
MACD can generate false signals in choppy, range-bound markets, causing whipsaws between bullish and bearish setups.
To mitigate this, traders should:
• Use higher timeframe confirmation (e.g., align 1-hour MACD with 4-hour or daily).
• Combine with trend filters like moving averages or price structure.
• Avoid relying solely on MACD during low volatility periods.
Conclusion
MACD blends momentum and trend-following analysis, making it a valuable tool in crypto trading. However, context is key. Combine MACD with RSI, trendlines, moving averages, and price structure for accurate signals and reduced false triggers.
Whether you’re a novice or an experienced trader, practice using MACD on platforms like BingX to refine strategies and confidently navigate volatile markets.
Related Reading
5. Simple Moving Average(SMA) vs Exponential Moving Average(EMA) in Crypto Trading: Differences to Know
Frequently Asked Questions (FAQs) on MACD
1. What are the best MACD settings for crypto trading?
Standard 12, 26, 9 works for most traders. Scalpers might prefer 5, 20, 5 for quicker signals; position traders might use 24, 52, 18 for smoother trends.
2. Can MACD be used for scalping/day trading?
Yes. Use shorter settings and lower timeframes like 5 or 15 minutes. Combine with RSI or trendlines for confirmation.
3. Does MACD work better on Bitcoin or altcoins?
MACD works well on both, but it’s more reliable with high-liquidity assets like Bitcoin and Ethereum.
4. How does MACD compare to RSI?
MACD focuses on trend direction and momentum; RSI highlights overbought/oversold zones. Combining them offers a more complete view.
5. Is MACD reliable in sideways markets?
Not always. In choppy conditions, it may produce false signals. Combine with trend filters and higher timeframe confirmation for better accuracy.