
Market shifts rarely happen in one candle. They often start with subtle changes in price behavior and trader psychology. The Dark Cloud Cover highlights that transition point, when optimism begins to fade and uncertainty creeps in. Used correctly, it improves timing and risk control, especially when combined with support levels, momentum indicators, or volume analysis.
Rather than telling traders where price will go, it helps answer a more practical question: Is the trend losing strength right now?
What Is the Dark Cloud Cover Pattern in Trading Crypto?
The Dark Cloud Cover is a bearish candlestick pattern that helps traders spot early signs of a possible market shift after an uptrend. It does not signal an immediate reversal. Instead, it warns that buying momentum is weakening and selling pressure is starting to build.
The pattern consists of two candles. The first is a strong bullish candle that confirms buyers are in control. The second candle opens higher, suggesting continued optimism, but then reverses sharply and closes deep into the first candle’s body. This failure to hold higher prices is what makes the pattern meaningful.
In fast-moving crypto markets, traders use the Dark Cloud Cover as a risk-management signal. It helps identify moments to tighten stop-losses, reduce long exposure, or prepare for a potential pullback rather than chasing price near local highs.
Anatomy of the Dark Cloud Cover: Candle by Candle
The first candle is a large bullish candle formed during an established uptrend. It reflects strong demand and reinforces bullish confidence. The second candle opens above the previous close, showing an initial attempt to extend the rally. However, sellers quickly take control and push price lower, turning the candle bearish.
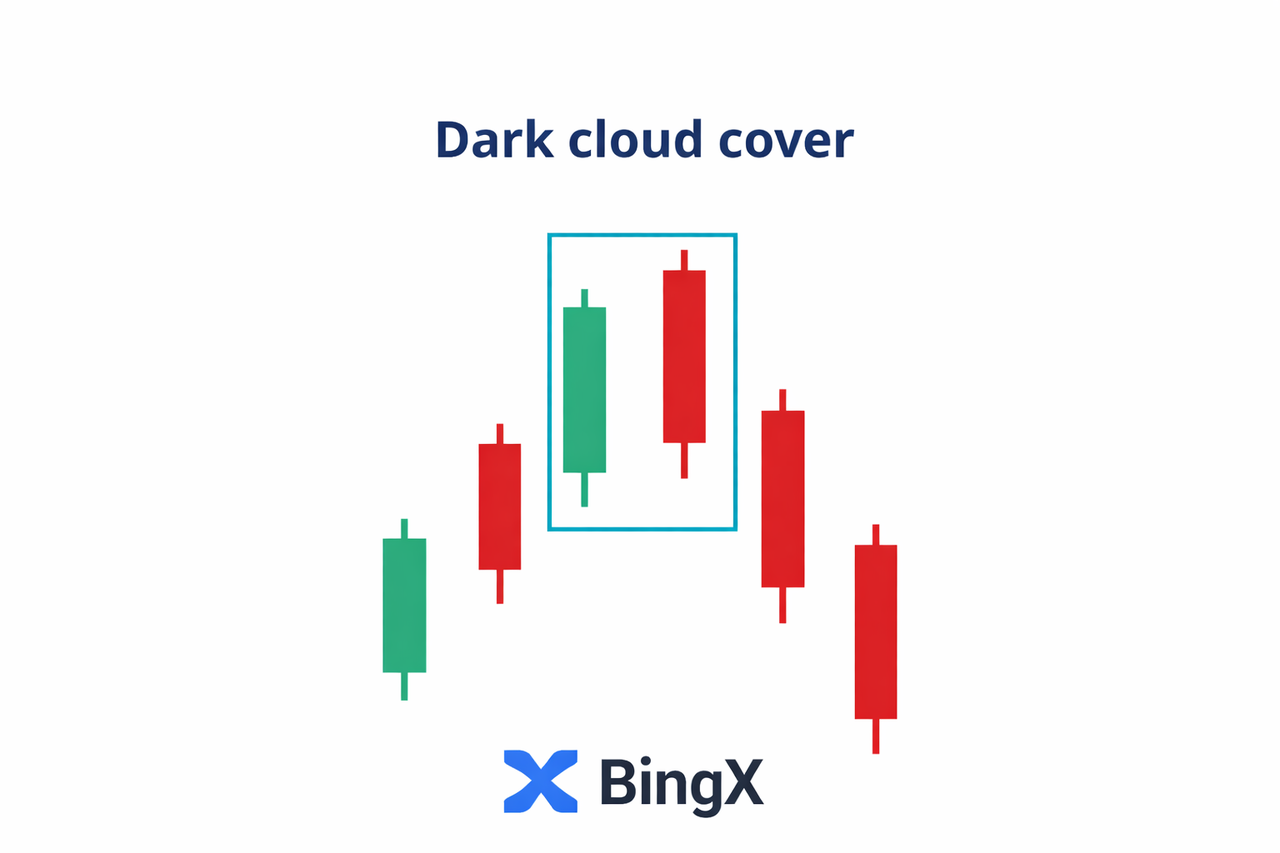
The key rule is the close. The second candle must close below the midpoint of the first candle’s real body. This shows that sellers erased a significant portion of prior gains, signaling a shift in momentum.
A common beginner mistake is confusing this pattern with normal pullbacks. A random red candle is not enough. Without a higher open and a decisive close below the midpoint, the setup lacks structure and should be ignored.
What the Dark Cloud Cover Reveals About Crypto Market Psychology
The Dark Cloud Cover marks a shift from confidence to hesitation. Price opens higher because traders still believe the uptrend will continue. When those higher levels fail to hold, sentiment changes quickly. Buyers struggle to defend higher prices as demand weakens near the top.
Late buyers hesitate to chase the move, while early buyers begin locking in profits. Without strong follow-through buying, selling pressure starts to dominate.
As price turns lower, sellers gain confidence. What begins as profit-taking often attracts short-term traders and momentum sellers, increasing downside pressure and volatility.
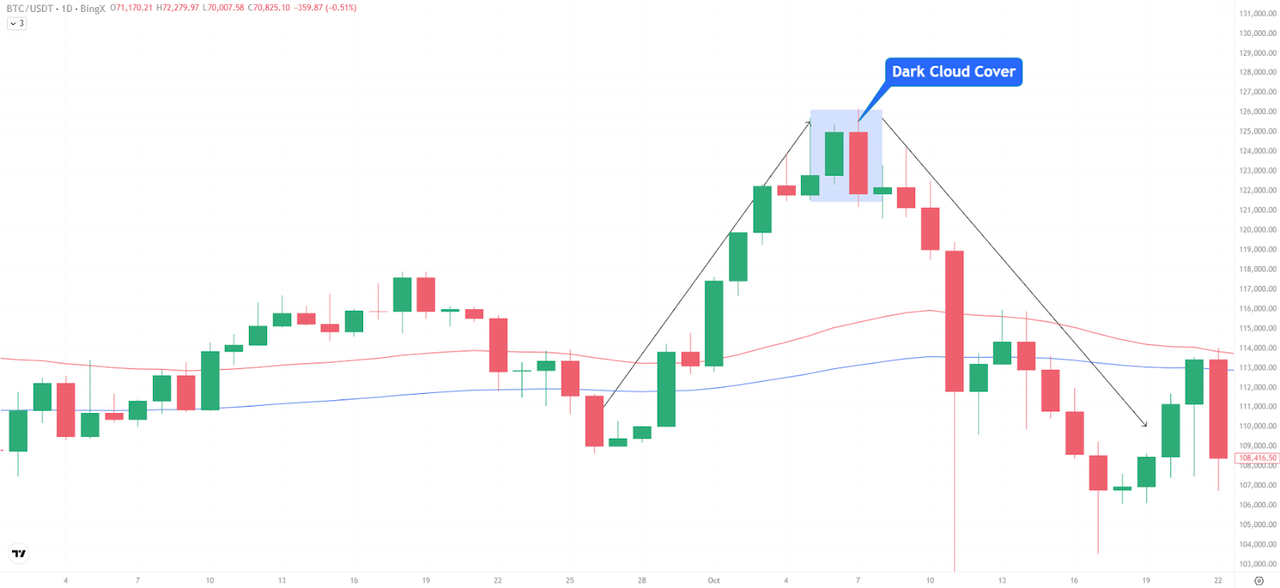
BTC/USDT Daily Chart - Source: BingX
On the BTC/USDT daily chart, Bitcoin rallies strongly into the $125,000–$126,000 resistance zone. The following session opens higher, suggesting continued optimism. However, price fails to sustain the move and closes deep into the previous bullish candle, forming a Dark Cloud Cover.
This price action shows that buyers could not maintain control near resistance. In the sessions that follow, Bitcoin continues lower, confirming that the pattern marked rising downside risk, not just a brief pause.
This highlights the key difference between normal profit-taking and a true momentum shift. Shallow pullbacks suggest buyers remain in control. A Dark Cloud Cover near resistance signals stronger selling intent and a higher probability of a deeper pullback.
How to Trade the Dark Cloud Cover Pattern in the Crypto Market
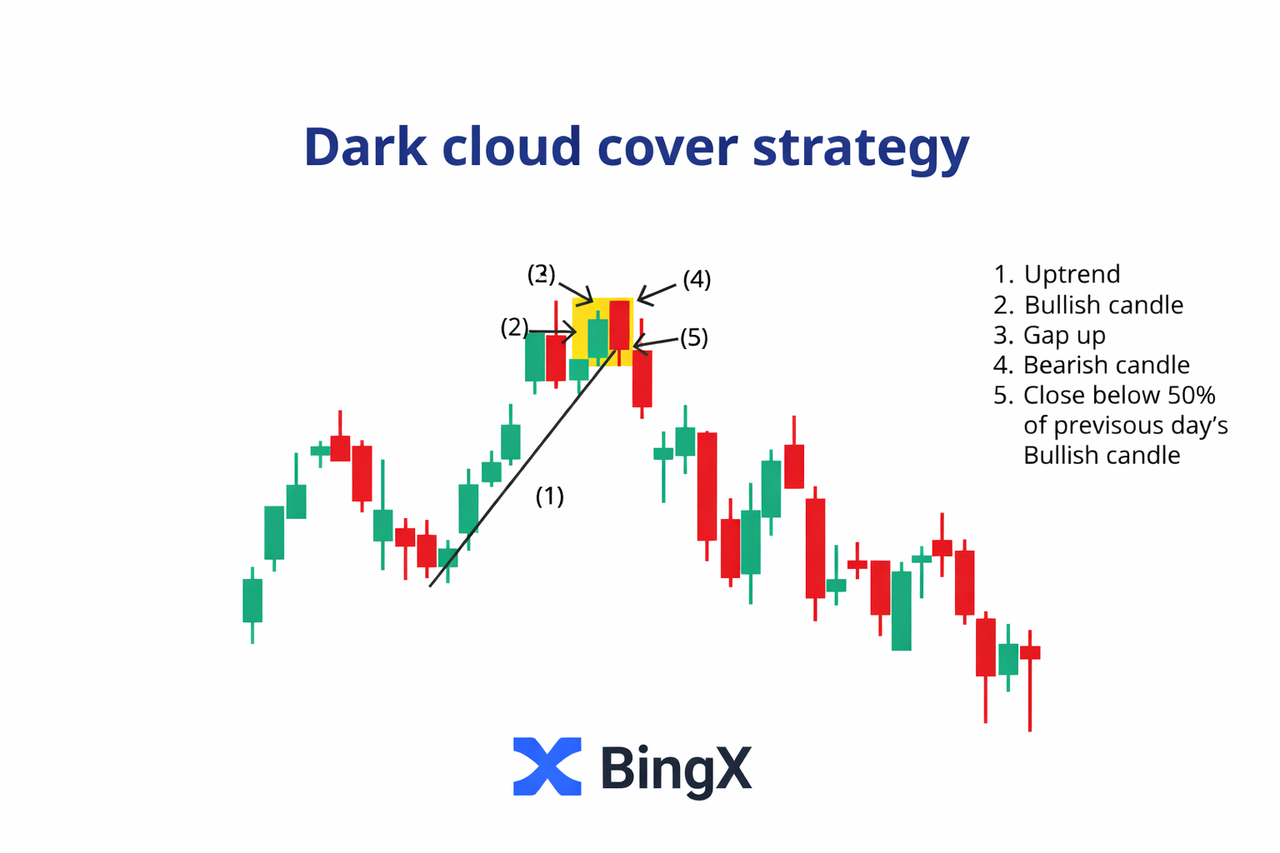
The Dark Cloud Cover works best in strong, extended uptrends, especially when price approaches key resistance (R), prior highs, or an upper trendline (TL). These zones often mark areas where bullish momentum slows and profit-taking accelerates. The pattern is far less reliable in range-bound or low-volatility markets.
Confirmation is essential. The Dark Cloud Cover is an early warning, not an instant entry signal. Entering immediately after the pattern forms can lead to false signals if the broader trend remains intact. Traders typically wait for follow-through or a structural break to confirm that sellers are gaining control.
High-probability confirmation tools include:
• Support and resistance (S/R): A close below nearby support strengthens the bearish setup.
• Relative Strength Index (RSI): Overbought conditions (RSI above 70) or bearish divergence signal fading momentum.
• Volume (Vol): Rising volume on the bearish candle confirms stronger seller participation.
• Trendline rejection (TL): Failure at an upper trendline reinforces the loss of bullish control.
Used with confirmation, the pattern improves timing, risk control, and trade selection, making it useful for managing shorts, tightening stop-losses (SL), or reducing long exposure rather than guessing market tops.
Example: Dark Cloud Cover on a Bitcoin (BTC/USDT) Chart
This BTC/USDT 4-hour chart shows a clear Dark Cloud Cover followed by strong bearish continuation, illustrating how traders plan entries around this pattern.
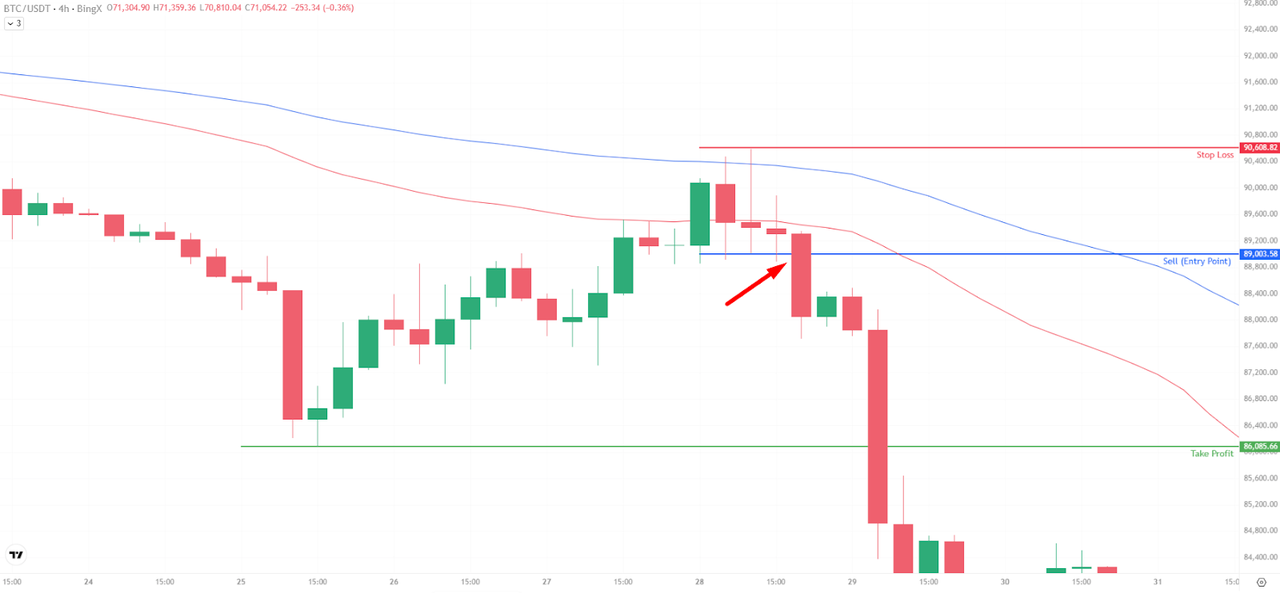
Trend context: Bitcoin was in a short-term recovery after a prior decline, pushing back toward resistance near $90,000, aligned with the 200-period moving average (MA) and a descending trendline (TL). This area already signaled overhead supply.
Candle structure:
• A strong bullish candle forms first, showing buyers attempting to extend the rebound.
• The next candle opens higher, but sellers take control and push price sharply lower.
• The candle closes below the midpoint of the prior bullish candle, completing the Dark Cloud Cover.
Entry logic: Rather than selling immediately, traders waited for confirmation. The entry was triggered after price broke below support near $89,000, aligning with:
• Rejection from the 200-MA
• Failure at descending TL resistance
• A strong bearish follow-through candle
This confirmation reduced the risk of a false signal.
Risk management strategy:
• Entry: Below $89,000 after confirmation
• Stop-loss (SL): Above the pattern high near $90,600
• Take-profit (TP): Near the next major support around $86,000
What worked: Confluence. The pattern aligned with resistance, moving averages, and structure, leading to sustained downside continuation.
What could fail: If price had reclaimed $90,000 or held above support, the Dark Cloud Cover would likely have resulted in a temporary pullback rather than a meaningful bearish move.
Dark Cloud Cover vs. Similar Candlestick Patterns
The Dark Cloud Cover is often confused with other bearish reversal patterns, but the differences matter because they signal different stages of market weakness.
1. Dark Cloud Cover vs. Bearish Engulfing
The Bearish Engulfing pattern is a stronger and more aggressive signal. In that setup, the bearish candle completely engulfs the body of the prior bullish candle, showing an immediate and decisive shift from buyers to sellers.
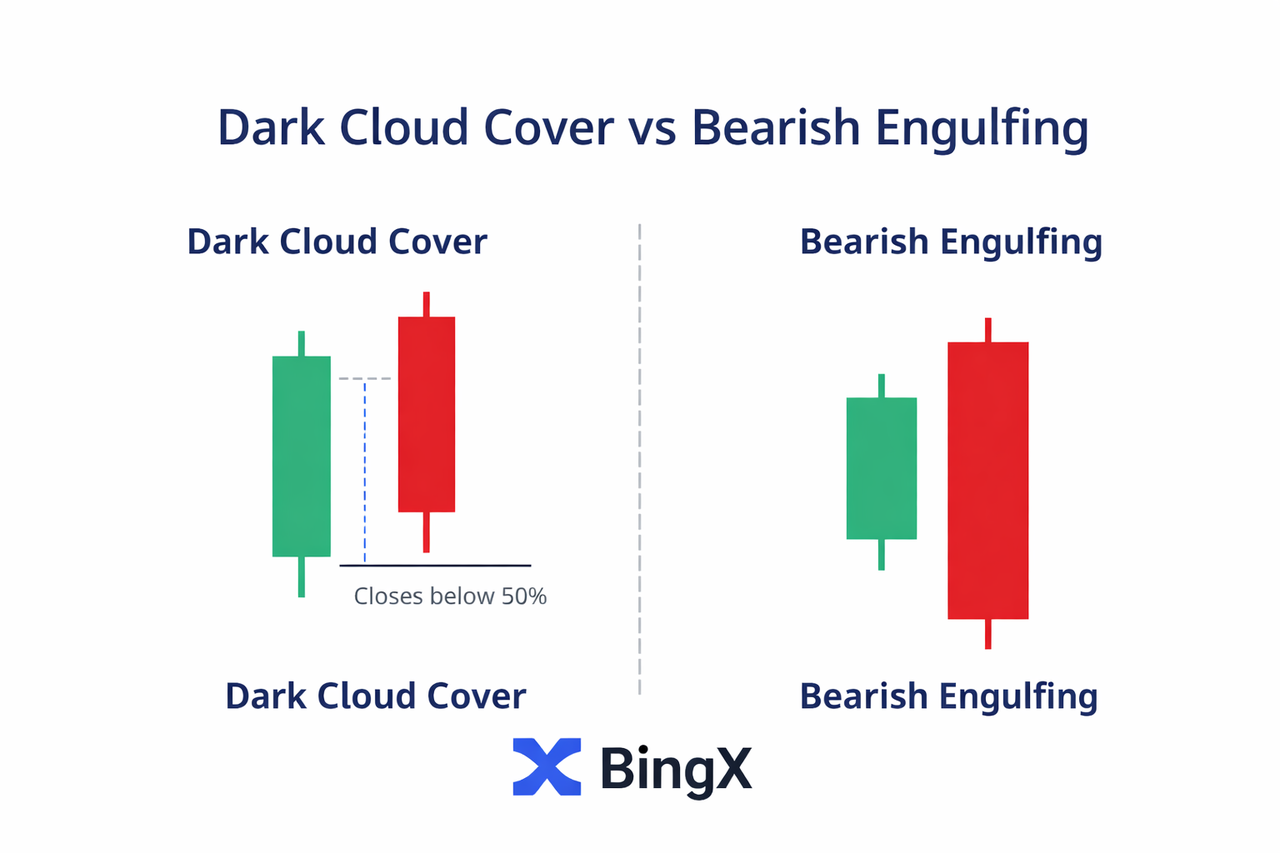
The Dark Cloud Cover is more subtle. The second candle closes deep into the previous candle but does not fully engulf it. This suggests buyers are losing control, but the transition is still developing rather than complete.
2. Dark Cloud Cover vs. Evening Star
The Evening Star is a three-candle pattern that reflects a clearer reversal structure. It includes a strong bullish candle, a small indecision candle, and then a strong bearish candle. Compared to this, the Dark Cloud Cover forms faster and with less confirmation. It signals early hesitation rather than a fully formed trend reversal.
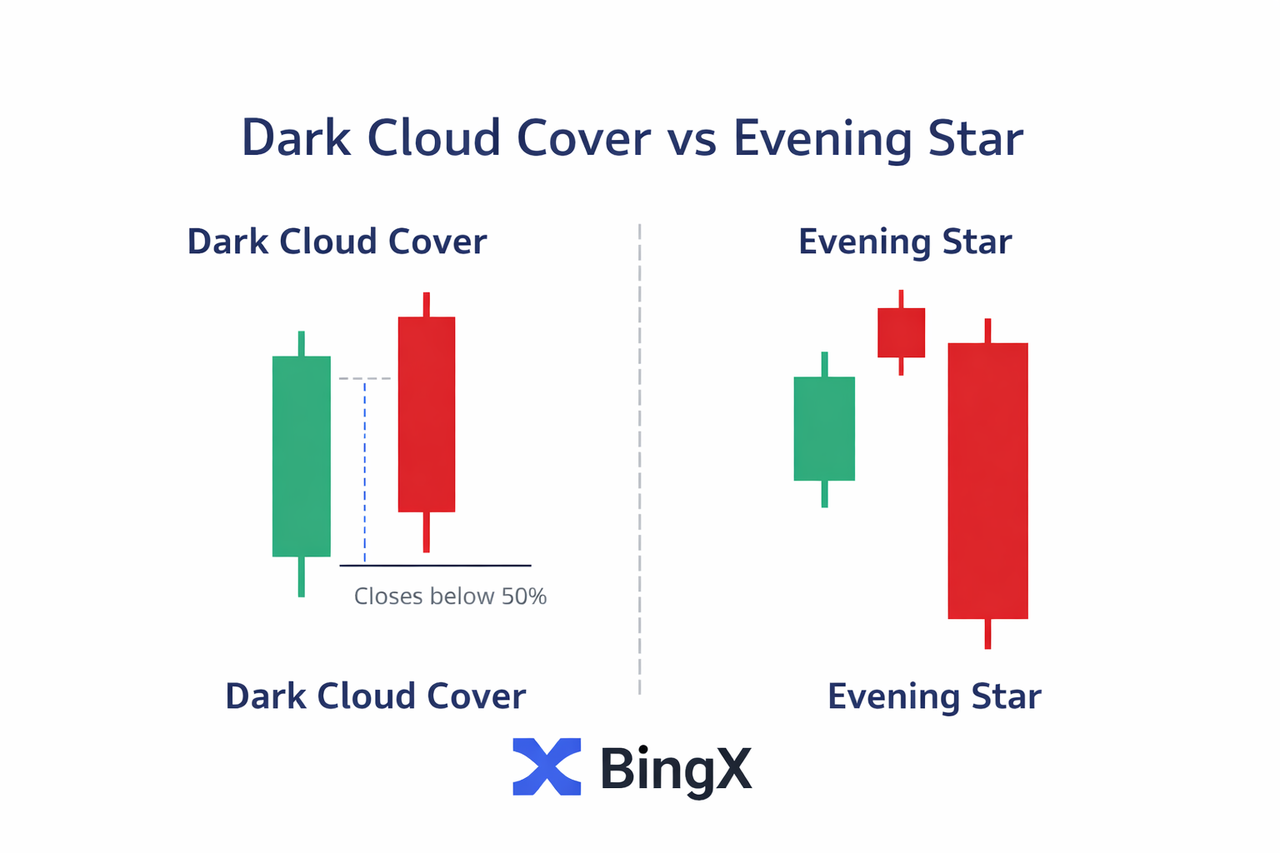
This is why the Dark Cloud Cover is considered an early warning pattern, not a confirmation tool. It alerts traders that upside momentum is weakening and risk is rising, but it should be followed by confirmation from price action, support breaks, or indicators before acting aggressively.
Conclusion: How to Use Dark Cloud Cover and Manage Market Changes on BingX
The Dark Cloud Cover acts as an early warning sign, not a way to predict prices. It helps traders notice when momentum is slowing after an uptrend and manage risk before the price changes direction. Using it with chart patterns and indicators can improve timing and discipline.
On BingX, traders can use built-in charting tools, RSI, volume, and moving averages to apply this pattern in both spot and futures markets. The Dark Cloud Cover can help you tighten stop-losses, lower long positions, or plan short trades, always keeping risk control in mind.
Related Reading
FAQs on the Dark Cloud Cover Pattern for Crypto Traders
1. Is the Dark Cloud Cover a guaranteed reversal signal in crypto?
No. The Dark Cloud Cover is an early warning pattern, not a guaranteed reversal. It signals weakening bullish momentum and rising downside risk, which is why confirmation from price action or indicators is essential.
2. Can the Dark Cloud Cover appear on any timeframe?
Yes. The pattern can form on any timeframe, but it is generally more reliable on higher timeframes such as the 4H, daily, or weekly charts, where market noise is reduced.
3. Does the dark cloud pattern work in sideways markets?
No. The Dark Cloud Cover works best after a clear uptrend. In range-bound or choppy markets, the pattern often produces false signals.
4. What technical indicators work best with the Dark Cloud Cover?
Common confirmation tools include support and resistance (S/R), RSI, volume, moving averages, and trendlines. These help confirm whether selling pressure is increasing.
5. Is the Dark Cloud Cover better for short trades or risk management?
It is useful for both, but many traders primarily use it for risk management, such as tightening stop-losses, taking partial profits, or reducing long exposure near resistance.
6. Can beginners trade the dark cloud cover pattern on BingX?
Yes. Beginners can practice identifying the pattern on BingX charts and use it first to manage risk rather than opening aggressive trades, building confidence with confirmation-based setups.