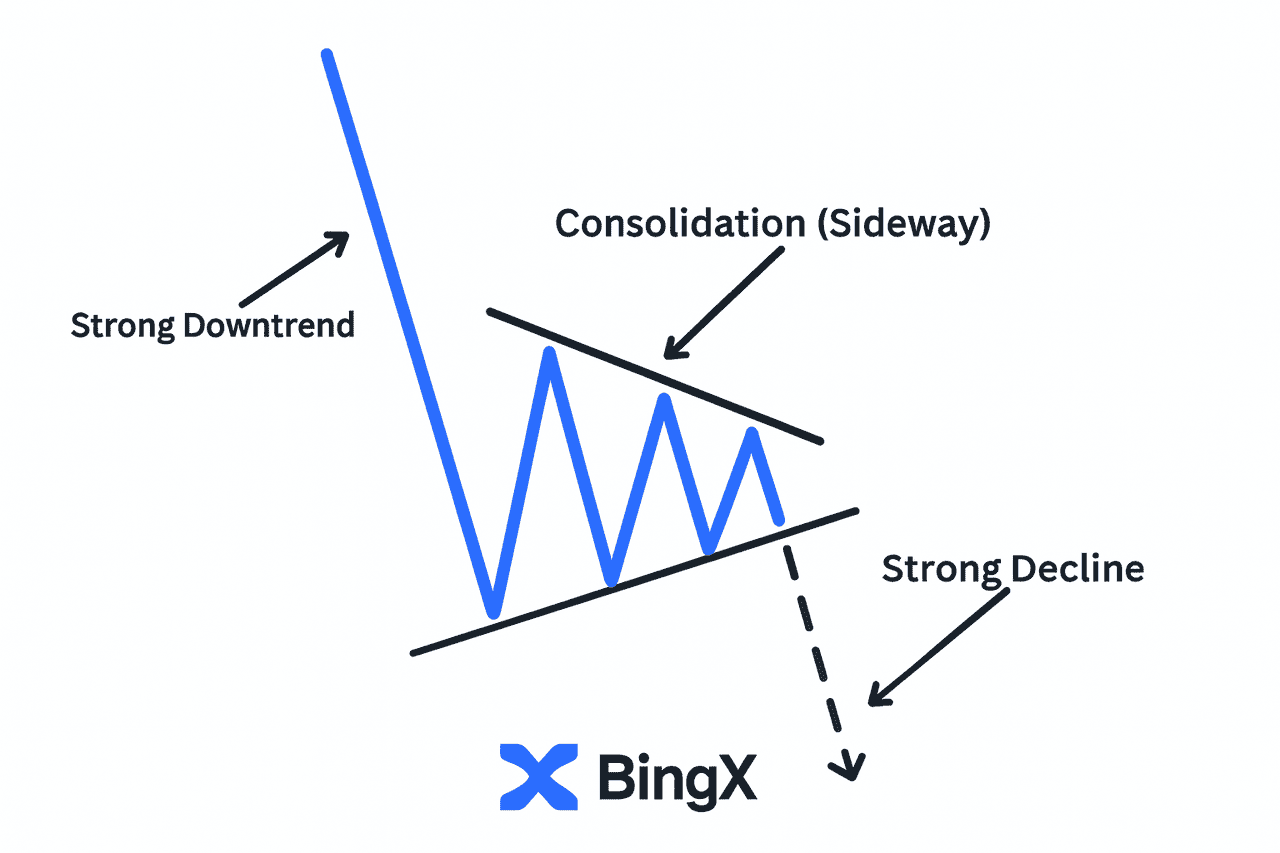
Crypto often looks chaotic during heavy sell-offs, but one pattern consistently appears before the next big leg down: the bear pennant. After a sharp price drop, the market pauses and forms a tight consolidation, almost like the move is catching its breath. This pause usually isn’t a reversal. It’s the market resetting before continuing lower.
Because of this, bear pennants give traders an early read on
market sentiment. They show when selling pressure is still dominant even though price appears to stabilize. More importantly, they help traders spot breakdowns before the next drop starts. If you’ve ever wondered why crypto resumes a downtrend after a quick sideways move, this continuation
chart pattern explains it.
What Is a Bear Pennant Pattern?
A bear pennant is a bearish continuation pattern that forms right after a strong decline. The first part is the flagpole, a fast, heavy drop caused by aggressive selling. After that, price moves into a small consolidation phase inside converging
trendlines, creating the pennant shape.
This is what distinguishes a bear pennant from a
bear flag:
• A bear flag slopes upward and has parallel lines.
• A bear pennant is neutral on the slope and forms a compact triangle.
Once consolidation ends, sellers typically regain control and drive the market downward again. Because crypto volatility compresses consolidation phases, pennants often last only hours or a couple of days.
How to Spot and Understand a Bear Pennant in Crypto Trading
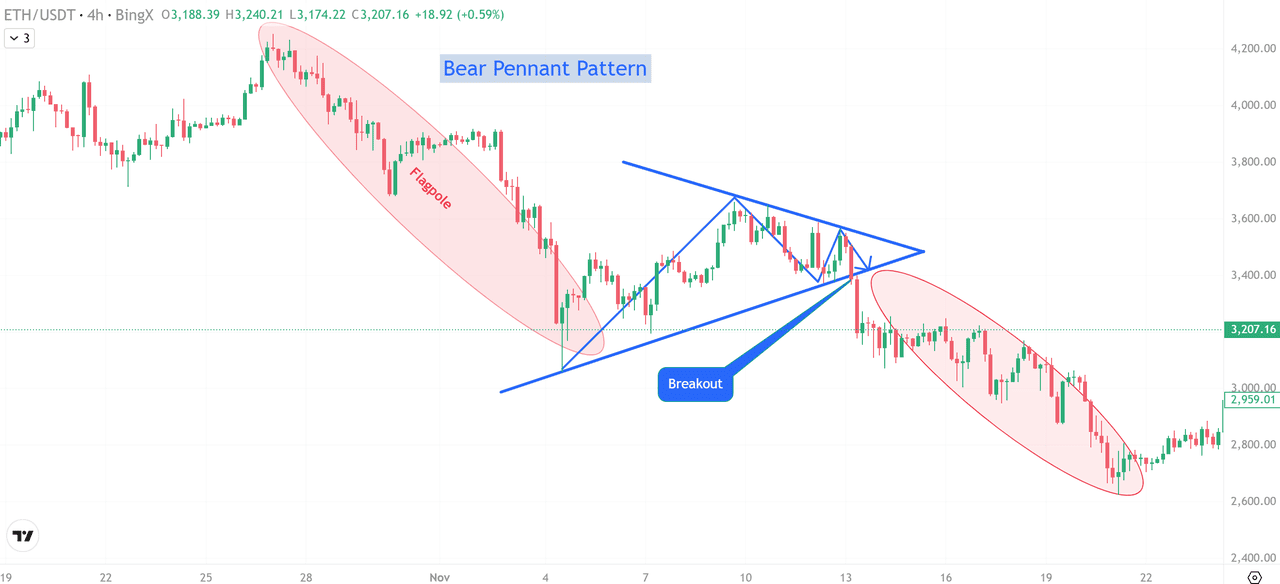
A bear pennant becomes easier to recognize once you understand its core structure and what it reveals about market psychology. The pattern always begins with a flagpole, a sharp, aggressive price drop accompanied by rising volume. This move sets the bearish tone and shows that sellers are firmly in control.
After the decline, price enters a consolidation phase where it moves inside converging trendlines, forming a small symmetrical triangle. This is the true pennant shape.
Volume usually contracts during this period, reflecting hesitation as both buyers and sellers wait for the next move.
Buyers attempt a minor counter-trend push, but they repeatedly fail to break above the upper trendline, signaling weak demand and persistent selling pressure.
Ethereum (
ETH/USDT) Trading Chart - Source: BingX
To confirm the pattern, traders look for a breakdown below the lower trendline, ideally supported by a volume spike. This renewed activity shows that bearish momentum has returned and the market is ready to continue downward.
Here’s a simple step-by-step method to identify a bear pennant on crypto charts:
1. Flagpole: Find a steep, decisive price drop on the chart.
2. Trendlines: Draw the upper and lower lines around consolidation; they must converge.
3. Volume: Check for declining volume during the pause.
4. Breakdown: Wait for price to break the lower trendline with increased volume.
5. Indicators: Use
RSI,
MACD, or
EMAs to confirm that broader momentum aligns with the bearish continuation.
When all these elements appear together, the chart is showing a classic bear pennant, one of the clearest continuation
chart patterns in crypto’s fast-moving, high-volatility environment.
What Does the Bear Pennant Pattern Tell About Market Sentiment?
A bear pennant reflects a temporary pause in strong selling pressure, not a shift in trend. After the sharp decline, buyers attempt a small counter-trend rally, but they consistently fail to break the upper trendline. This tells us that sellers still dominate and that the broader market context remains firmly bearish.
During consolidation, volume contracts as both buyers and sellers hesitate. The market is essentially waiting for confirmation. When the breakdown finally happens, a spike in volume shows renewed bearish momentum, signaling that sellers have regained full control.
In short, the pattern shows a market preparing to continue downward rather than reverse.
How to Trade a Bear Pennant Breakdown in Crypto: Entry, SL, TP
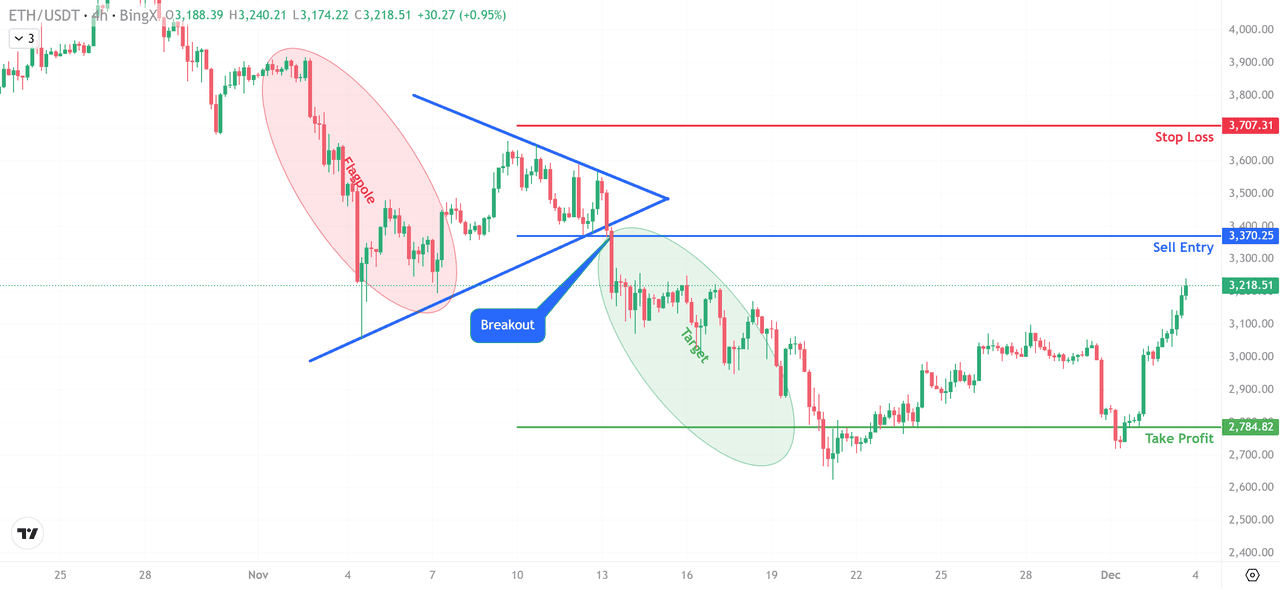
A bear pennant gives traders a structured way to enter breakdowns with defined risk. The goal is simple: let the consolidation finish, wait for the breakdown, and ride the continuation move using the flagpole as your target.
Ethereum (
ETH/USDT) Trading Chart - Source: BingX
In the ETH/USDT example above, the flagpole formed during the sharp drop from around $3,700 to $3,300, followed by a tight pennant and a clear breakdown.
1. Entry: Wait for a Confirmed Break
Enter only when the candle closes below the lower trendline, not during the wick. Wicks often fake out traders; the candle close confirms real selling pressure. On the chart above, ETH breaks below the pennant and closes under $3,370. This becomes your short entry.
2. Stop-Loss: Keep It Outside the Pattern
Place the
stop-loss above the upper trendline, not inside the pennant. Most failed pennant trades happen because traders keep their SL too tight and get wicked out. Above $3,707, where the pattern becomes invalid.
3. Take Profit: Use the Flagpole Projection
Measure the height of the flagpole and project it downward from the breakout point.
Calculation:
• Flagpole drops around $400 (from approximately $3,700 to $3,300)
• Breakout at $3,370
• Target = $3,370 – $400 = $2,970
The
ETH/USDT price chart shows Ethereum extending even lower toward the $2,784 region, a clean flagpole-based target.
4. Risk Management: Make the Trade Worth It
From
risk management perspective, stick to a minimum 1:2 risk-to-reward ratio. Pennant breakdowns often move fast, so scaling out at
key support levels helps secure profits.
Summary of the Setup:
• Entry: Breakdown candle close below lower trendline
• SL: Above pennant’s upper trendline
• TP: Flagpole measured move
• Goal: Catch continuation while keeping risk clearly defined
This makes the bear pennant one of the most reliable continuation patterns for trend-following traders on BingX.
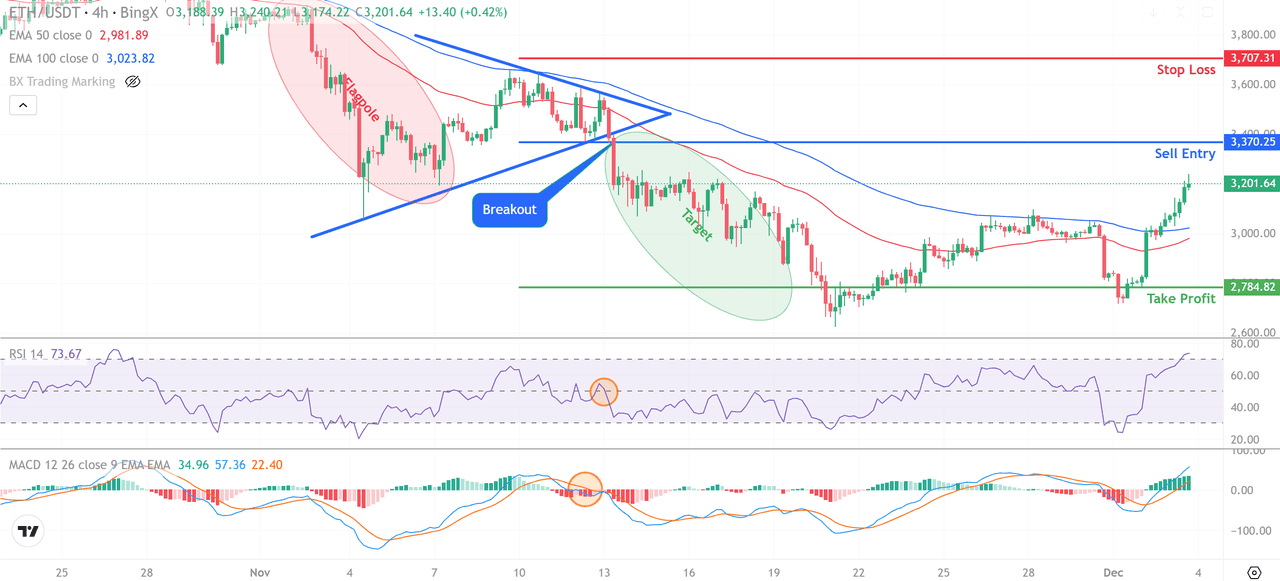
How to Use Indicators to Confirm Bear Pennant Signals
Technical indicators help confirm whether a bear pennant is valid or just noise. On the
ETH/USDT chart, all three major indicators aligned with the bearish breakdown:
Ethereum (
ETH/USDT) Trading Chart - Source: BingX
• Strength Index (RSI): During the pennant consolidation, the Relative Strength Index stayed mostly below the 50 level and even slipped near 45. This showed weak buying pressure. At the moment of breakdown, the RSI still failed to cross above 50, confirming that bearish momentum remained in control.
• Exponential Moving Averages (50-EMA and 100-EMA): Throughout the pattern, price traded below the 50-period Exponential Moving Average at $2,981 and the 100-period Exponential Moving Average at $3,023. When price stays under both moving averages, it signals strong trend continuation, which supports the bear pennant breakdown.
• Moving Average Convergence Divergence (MACD): Just before price broke below the lower trendline, the Moving Average Convergence Divergence showed a bearish crossover. The MACD line crossed below the signal line which is a standard bearish crossover. This shift confirmed that momentum had turned downward again.
When all three indicators, RSI below 50, EMAs showing a downward trend, and MACD turning bearish, line up at the same time as the breakout candle closing below the trendline, traders have a much stronger confirmation that the bear pennant breakdown is genuine.
Conclusion
Bear pennants work because they turn fast, emotional sell-offs into a structured continuation pattern you can trade with rules, not guesswork. Once the breakdown confirms with volume, traders get a clear entry, a logical stop above the pennant, and a measurable target based on the flagpole. When you combine this with basic indicators and strict risk control, the pattern becomes far more reliable.
The takeaway is simple: don’t anticipate the move. Let the breakdown complete, trade in the direction of momentum, and protect your capital with discipline.
Related Reading
FAQs on Using Bear Pennants in Crypto Trading
1. What is a bear pennant in crypto trading?
A bear pennant is a continuation pattern that forms after a sharp price drop, followed by a brief consolidation inside converging trendlines. It signals that the downward move is likely to continue once price breaks the lower trendline with volume.
2. How is a bear pennant different from a bear flag?
A bear flag slopes upward and uses parallel lines, while a bear pennant forms a compact symmetrical triangle. Both are bearish continuation patterns, but pennants show tighter, faster consolidations—common in volatile crypto markets.
3. Where do traders usually enter a bear pennant breakdown?
Traders enter only when a candle closes below the pennant’s lower trendline. Entering early during wicks leads to false signals. A confirmed breakdown with rising volume is the safest entry.
4. How do you set a stop-loss when trading a bear pennant?
A stop-loss is placed above the upper trendline of the pennant. If price moves back into the pattern, the setup is invalid. Keeping the SL outside the structure avoids getting wicked out by volatility.
5. How do you calculate the profit target for a bear pennant?
Use the flagpole projection method. Measure the height of the initial drop and subtract it from the breakout level. For example, a $400 drop and a $3,370 breakout gives a target near $2,970.