
Continuation patterns are specific visual formations on a price chart that signal a temporary pause in a prevailing trend. Unlike reversal patterns that predict a change in direction, these trading patterns suggest the market is consolidating before resuming in the same direction. By mastering pattern recognition, crypto traders can identify high-probability entry points to join an existing trend with better timing and lower risk.
What Are Trend Continuation Patterns and Why Are They Important in Crypto?
In technical analysis, trend continuation patterns are specific price chart formations that signal a temporary pause or consolidation phase within a prevailing trend. Unlike reversal patterns that predict a complete change in market direction, these patterns suggest that the current momentum is simply "taking a breath" before resuming in the same direction.
These patterns are critically important for crypto traders because they provide high-probability opportunities to join a trend that is already in motion. By identifying these structures, you can avoid the "trap" of buying at a local peak and instead enter at a point where the market has stabilized, providing a clearer path to potential profit.
Why Trend Continuation Patterns are the Key to Crypto Profits
In the highly volatile cryptocurrency market, trading successfully depends on recognizing market structures that indicate whether an existing trend will continue. While many beginners hunt for reversal chart patterns to catch the absolute bottom, seasoned professionals focus on continuation patterns to capitalize on ongoing momentum.
These patterns are invaluable for:
• Optimizing Entry Timing: Joining a trend after a brief pullback rather than chasing the "top".
• Defining Risk: Providing clear support and resistance levels for precise stop-loss placement.
• Trend Context: Ensuring your informed trading decisions align with broader market momentum.
The secret to high pattern reliability is the overall trend context. For example, a bullish continuation pattern like an ascending triangle is most effective when it forms after a strong bullish trending phase.
In this comprehensive trading strategy guide, we will use technical analysis to break down the most effective crypto chart patterns, from the bullish flag to the cup and handle pattern, to help you trade with precision.
1. Flags and Pennants: The Momentum Multipliers
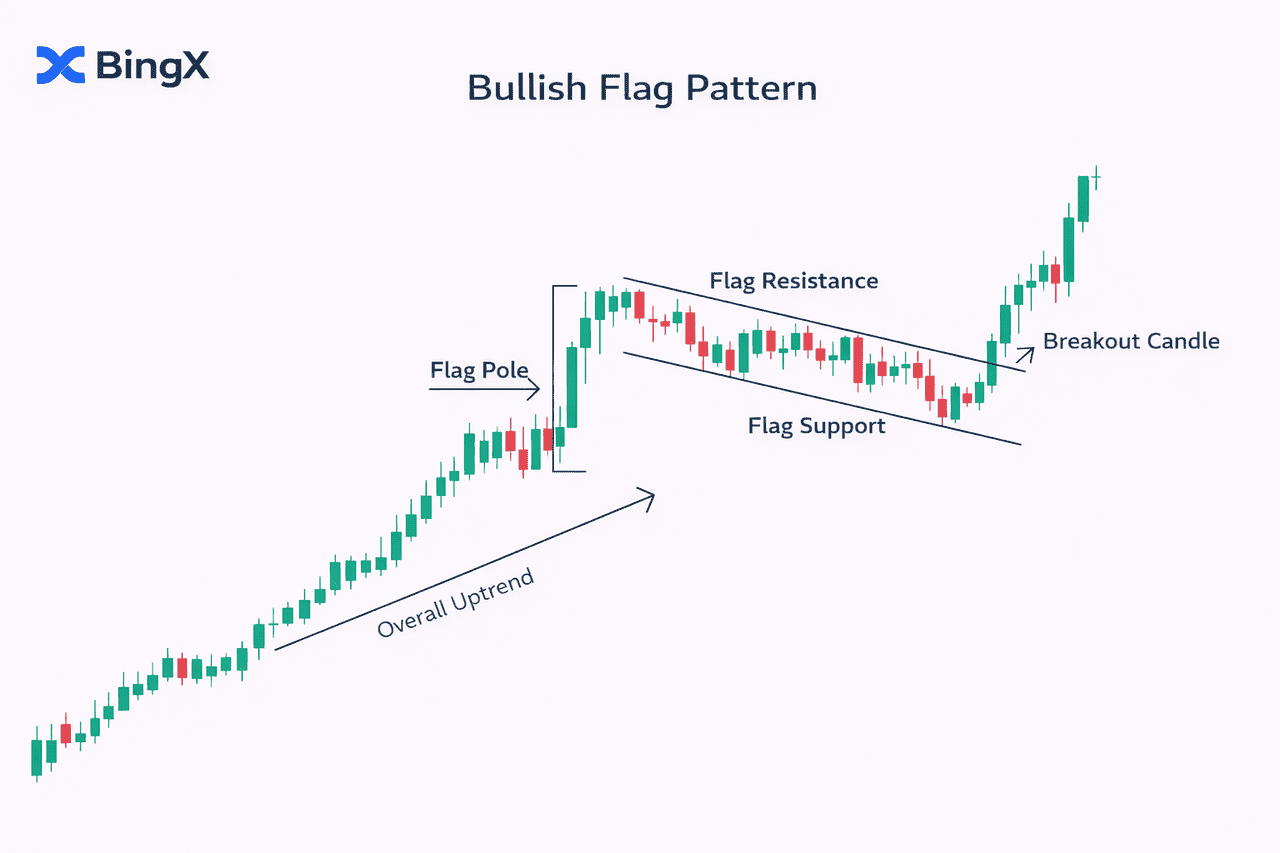
Flags and pennants are essential short-term continuation patterns that develop after a sharp, nearly vertical market movement known as the flagpole. These common chart patterns represent a brief period of consolidation where market participants catch their breath before the prevailing trend resumes with high trading volume.
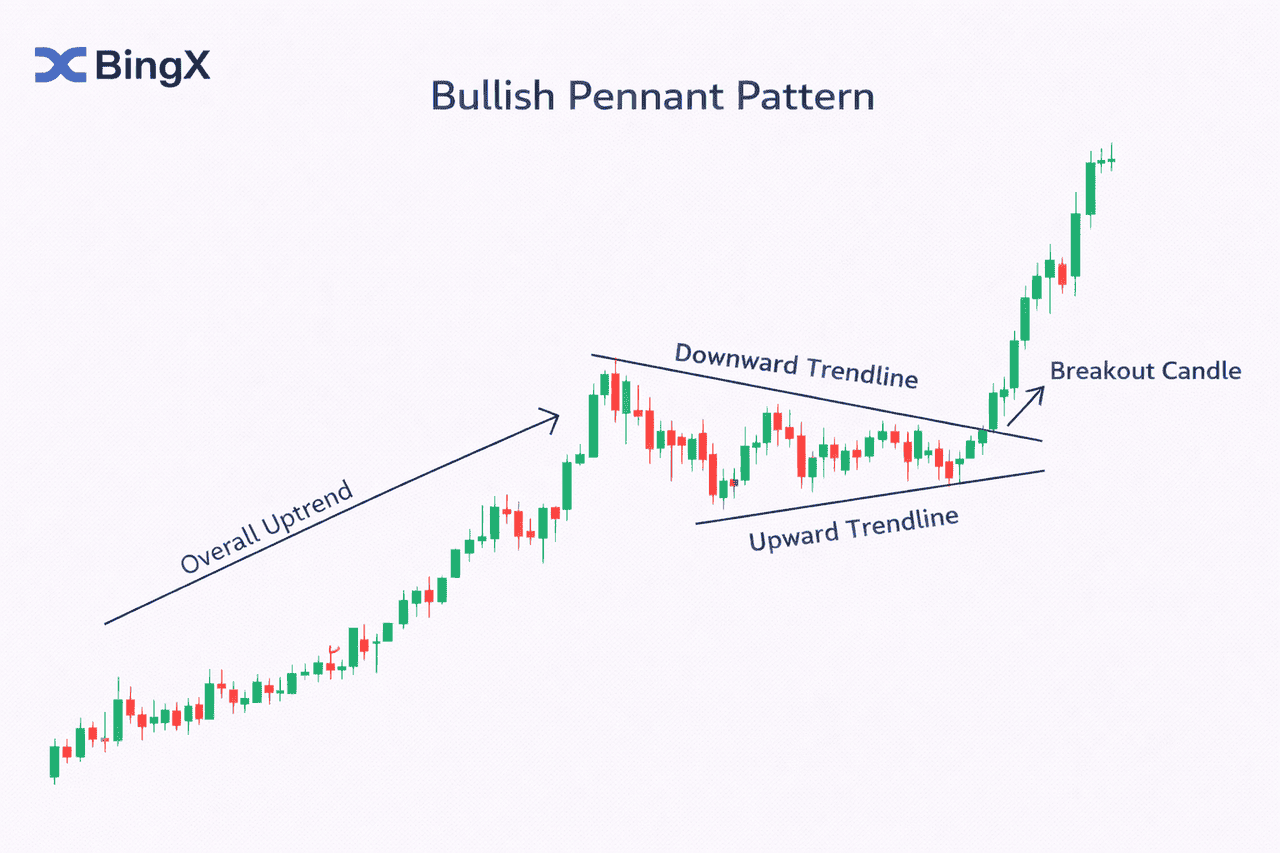
While both follow a "flagpole," remember that Flags use parallel trendlines, while Pennants use converging trendlines.
Understanding Visual Formations
• The Bullish Flag Pattern: This formation appears as a small pullback in the form of two parallel lines (support and resistance) sloping against the current trend.
• The Pennant: Similar to a symmetrical triangle pattern, this features converging trendlines that create a small wedge-like shape.
How to Trade Flags and Pennants
• Entry Point: Traders typically execute a trade when a breakout candle closes outside the resistance line (in an uptrend) in the direction of the prior trend.
• Take-Profit Strategy: A common technique in pattern trading is to set the profit target equal to the length of the initial flagpole.
• Risk Management: To protect against future price movements that go against your position, place a stop-loss just below the flag support level.
2. Ascending and Descending Triangles: Building Pressure for a Breakout
Triangle chart patterns are among the most reliable continuation patterns used in advanced technical analysis patterns. These formations illustrate a tightening battle between buyers and sellers where the price is compressed before a major breakout in the direction of the prevailing trend.
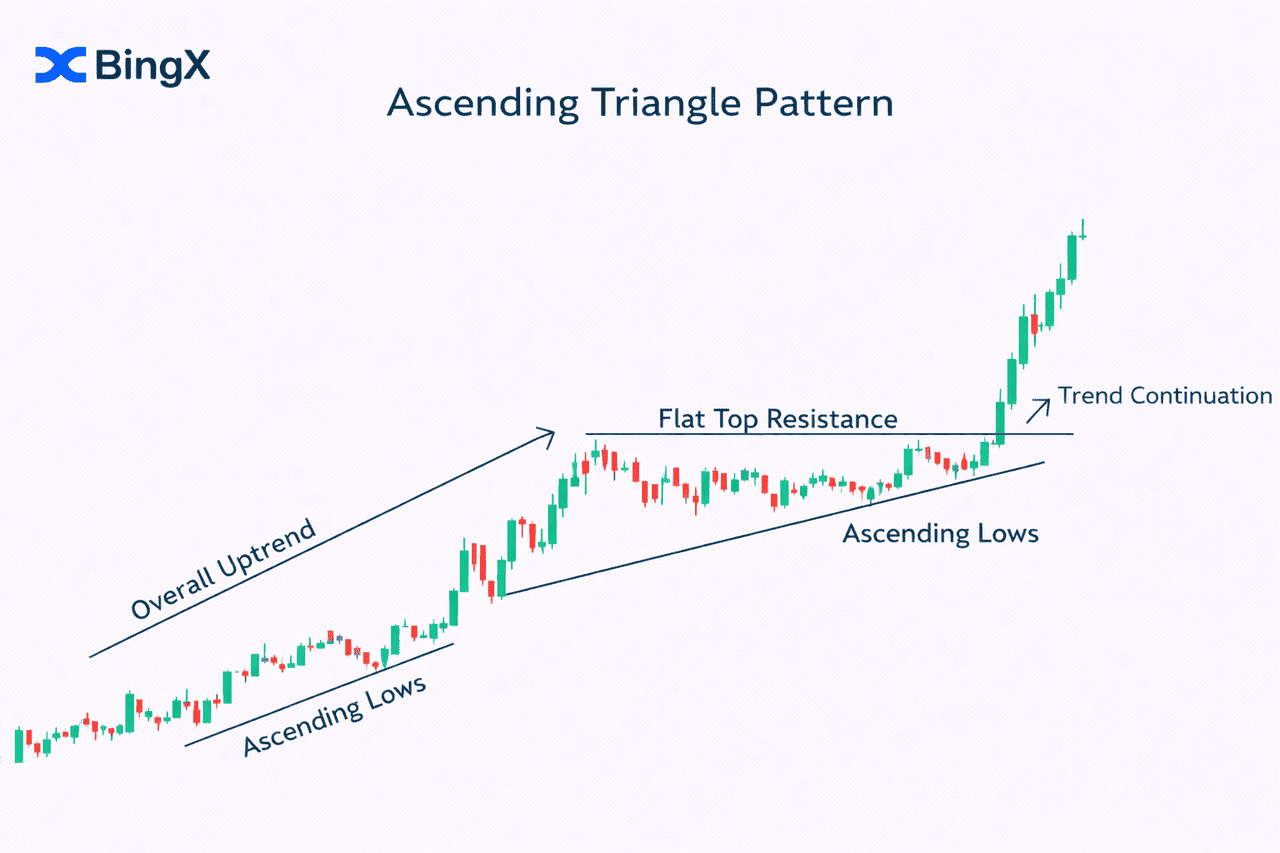
i. Ascending Triangles (Bullish Continuation)
The ascending triangle typically forms during an uptrend. It is defined by a flat resistance line at the top and a series of ascending lows forming an upward-sloping support line. This structure signals that buyers are becoming increasingly aggressive, pushing the price back up to the horizontal line of resistance more quickly each time.
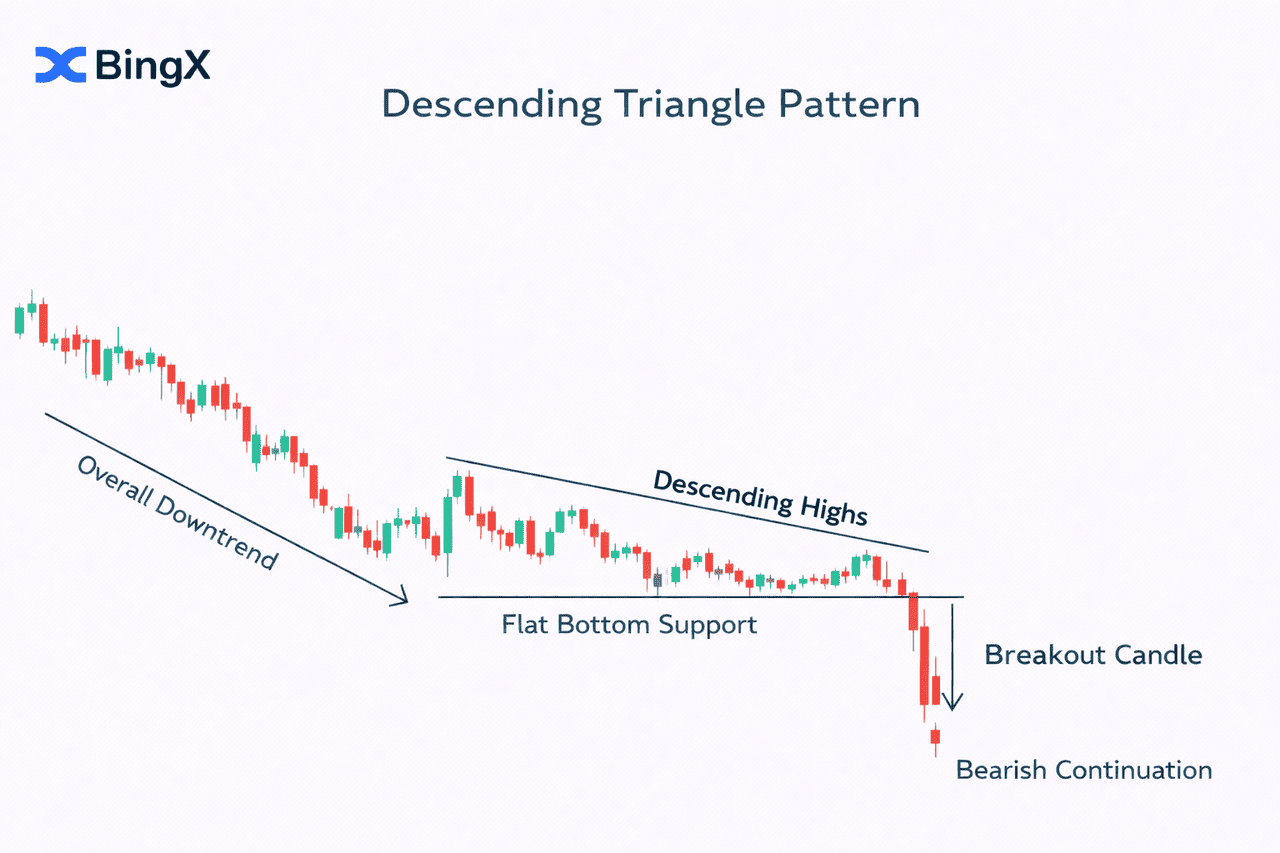
ii. Descending Triangles (Bearish Continuation)
Conversely, descending triangle patterns appear during a downward trend. These bearish continuation patterns feature a horizontal support line and a downward-sloping resistance line. This indicates that selling pressure is mounting as sellers lower their offer prices, eventually leading to a break below the support floor.
Trade Triggers and Confirmation
• Breakout Confirmation: A trade is confirmed when the price breaks above the upper boundary (for ascending) or below the lower boundary (for descending).
• Volume Analysis: Pattern signals are significantly stronger when the breakout is accompanied by a surge in trading volume.
• Entry Strategy: Traders often wait for a complete candle close outside the triangle boundary to avoid "fakeouts" before executing a trade.
3. The Cup and Handle Pattern: The Bullish Classic
The cup and handle pattern is a highly regarded bullish continuation pattern that signals the market has finished consolidating and is ready to resume its upward trajectory. This formation is favored in crypto chart patterns because it clearly visualizes the transition from a period of indifference to a period of mounting demand.
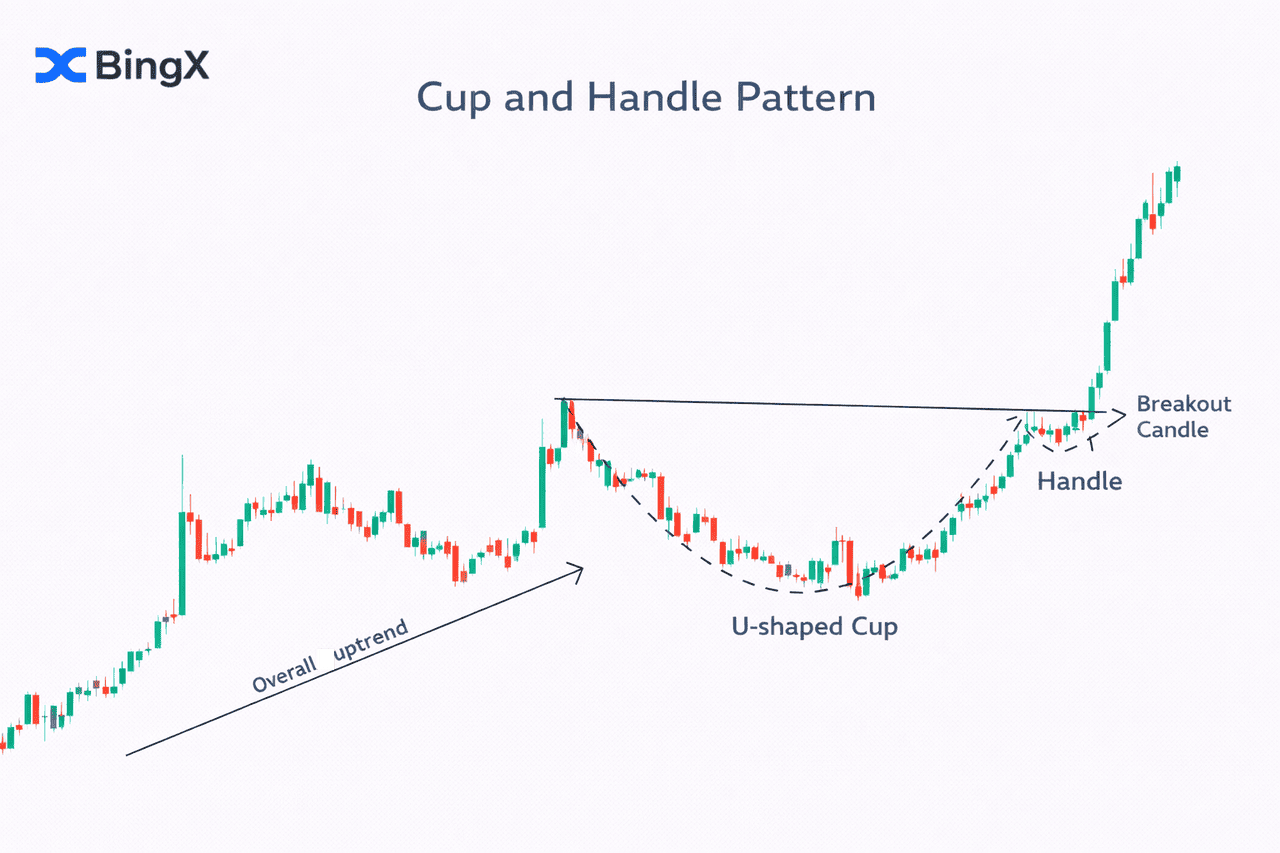
The Anatomy of the Formation
• The Cup: A "U"-shaped recovery where the price gradually rounds out a bottom after a previous uptrend.
• The Handle: This is the most critical part of the trading pattern. It appears as a small downward-sloping consolidation or horizontal line near the top of the cup.
• Price Logic: For the pattern to remain valid, the low of the handle must be significantly higher than the low of the cup. This shows that selling pressure is drying up and buyers are stepping in sooner.
Strategic Entry and Exit Points
• Entry Strategy: Place a buy order when the price breaks above the handle's resistance line.
• Stop-Loss Placement: Position your stop-loss just below the lowest point of the handle to protect against a trend reversal.
• Take-Profit Target: Traders typically define profit targets by measuring the depth of the cup and projecting that distance upward from the breakout point.
4. Rectangles: Mastering Sideways Consolidation
Rectangles are common chart patterns formed when the price chart consolidates sideways between parallel horizontal support and resistance levels. This visual formation signifies a temporary pause in the prevailing trend where buyers and sellers are in a state of equilibrium.
How to Identify the Rectangle Pattern
• Structure: The price bounces between a clear horizontal resistance line and a horizontal support line.
• Trend Context: In a comprehensive trading strategy, a rectangle is viewed as a bullish continuation pattern if it occurs during an overall uptrend.
• Market Logic: It represents a period of indecision where market participants are waiting for a fresh catalyst to drive the current trend further.
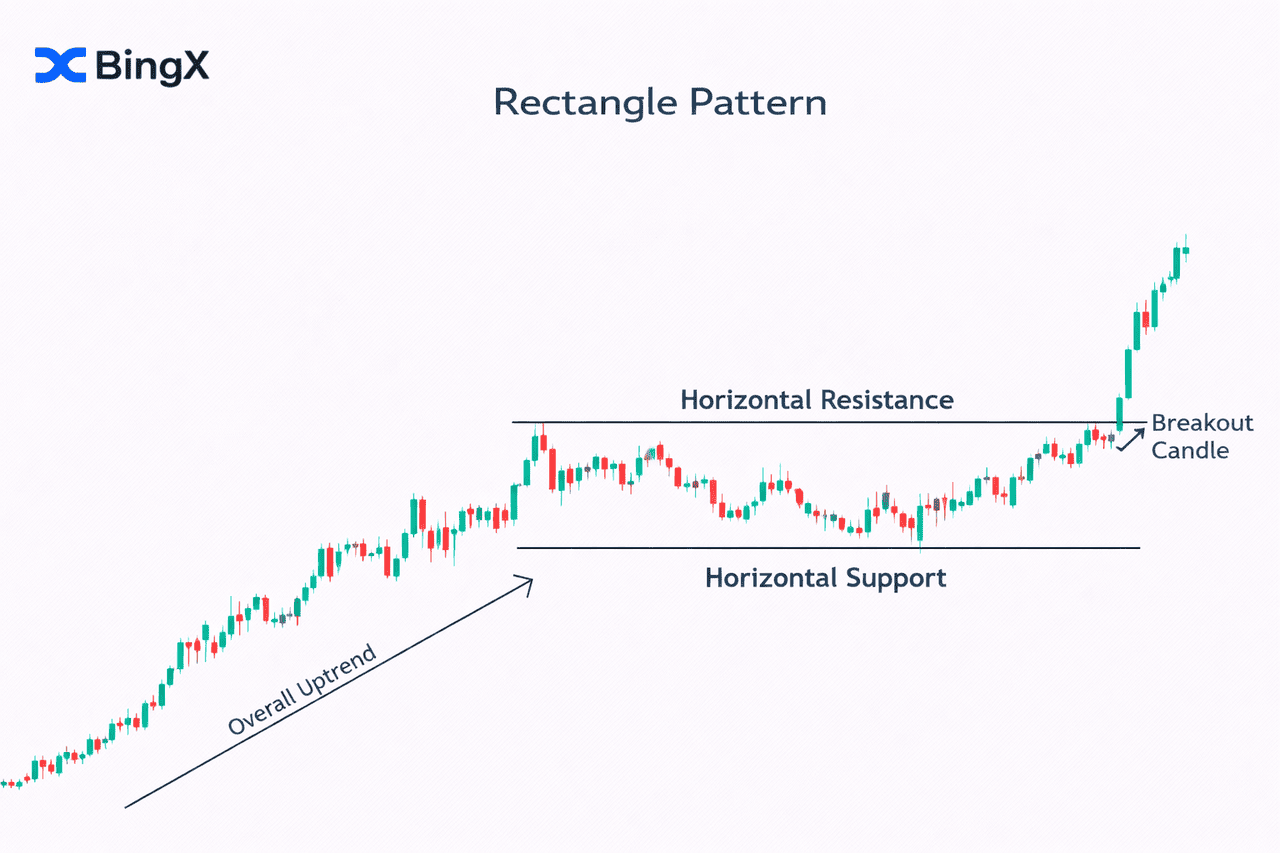
Trade Triggers and Risk Management
• Entry Confirmation: Entry is confirmed when the price breaks above or below the rectangle boundary in the direction of the prevailing trend.
• Wait for the Close: Because false breakouts are common in rectangle chart patterns, traders should wait for a complete candle close outside the boundary.
• Volume as a Filter: Use trading volume as an additional tool; a valid breakout is typically supported by a surge in volume.
• Stop-Loss Placement: For effective risk management, set stop-loss orders below the recent swing low within the rectangle.
5. Inverted Head and Shoulders: An Advanced Continuation Signal
While the head and shoulders pattern is usually associated with reversal patterns, the inverse head (inverted) version can act as a powerful bullish continuation pattern during an established uptrend. In this context, the pattern appears as a complex consolidation phase that allows the market to reset before the prevailing trend resumes.
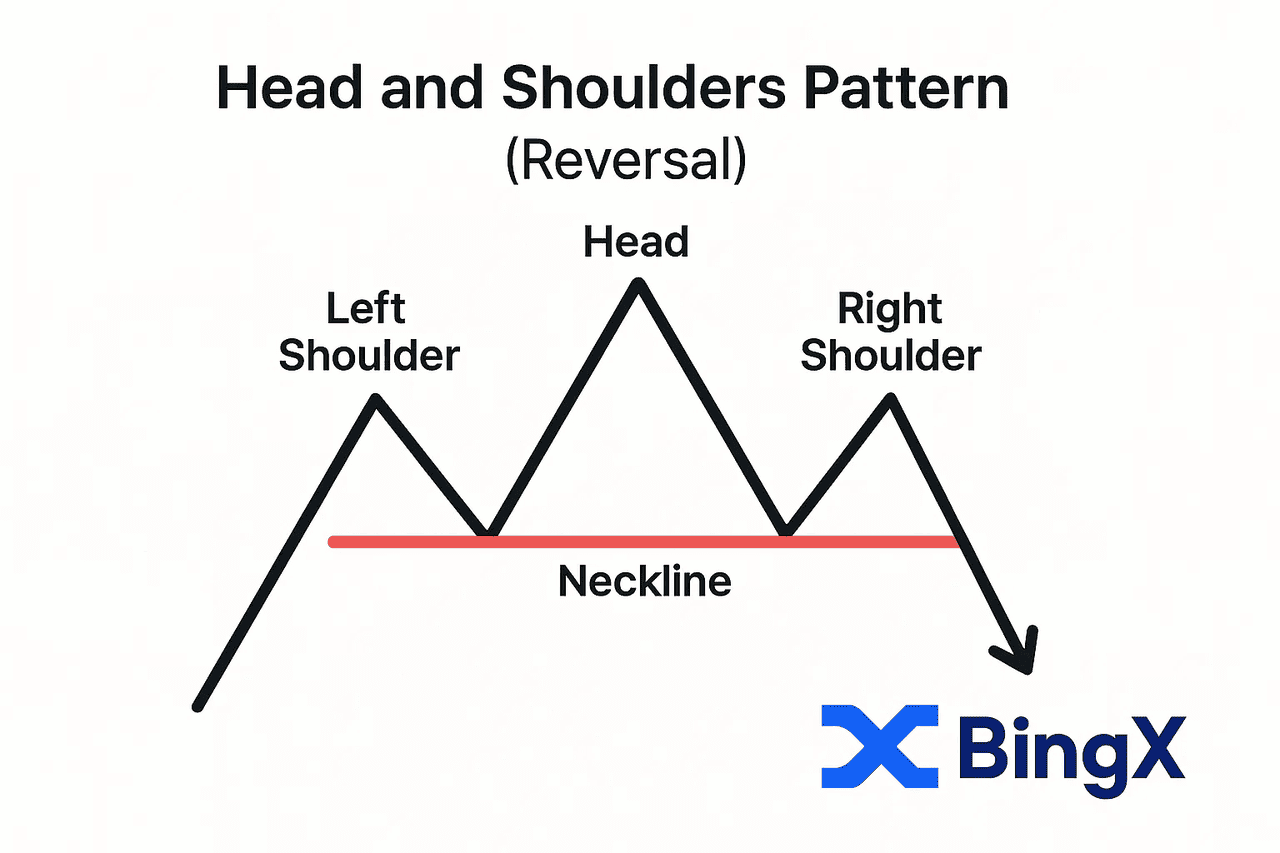
The Advanced Structure
• Formation: The price makes three swing lows: a left shoulder, a deeper middle low (the head), and a final right shoulder that is nearly equal to the first.
• The Neckline: This is the resistance line formed by connecting the peaks between the three lows.
• Continuation Logic: In a strong uptrend, this shoulder chart pattern signals that despite selling pressure, buyers are successfully defending higher support levels.
Entry and Risk Management
• The Trigger: Enter the trade when the price breaks and closes above the neckline.
• Confirmation: Look for a breakaway gap or a surge in trading volume to support the breakout.
• Stop-Loss Strategy: For a robust comprehensive trading strategy, place a stop-loss just below the right shoulder low to protect against future price movements that might invalidate the setup.
Conclusion: Mastering the Art of Trend Trading in Crypto
Trend continuation patterns are invaluable technical analysis tools for traders aiming to ride market movements with confidence and precision. Whether you are identifying a bullish flag, a symmetrical triangle, or a rectangle chart pattern, the core benefit lies in their high level of objectivity.
To refine your pattern recognition skills and build a comprehensive trading strategy on BingX, follow these final tips:
• Always check the Higher Time Frame (HTF): Ensure the current trend is strong on daily charts before looking for pattern signals on lower timeframes.
• Wait for the Close: Avoid entering on "wicks"; always wait for a complete candle close above the resistance levels
• Practice Discipline: Use risk management techniques like fixed position sizing and disciplined stop-loss placement to protect your capital.
Ready to ride the trend? Start identifying these patterns on the BingX Terminal today and leverage our professional-grade charting tools to time your next big move.
Related Reading
7. Simple Moving Average(SMA) vs Exponential Moving Average(EMA) in Crypto Trading: Differences to Know
FAQs on Trend Continuation Patterns
1. Are trend continuation patterns reliable for crypto trading?
Yes, they are highly effective because they capitalize on existing market momentum rather than trying to predict a reversal. Patterns like flags and triangles offer objective signals that help traders enter a trend during a low-risk consolidation phase.
2. How do I distinguish a continuation pattern from a reversal?
The key is the overall trend context. A continuation pattern must form after a strong trending move; for example, a bullish continuation pattern should only be traded after a clear bullish phase. If the pattern appears without a prior trend, it may lead to a reversal or a false signal.
3. What is the "Measured Move" principle?
This is a technique used to set profit targets based on the size of the pattern. For instance, with flags and pennants, the target is often equal to the height of the original "flagpole". For a cup and handle, the target is typically set to a level equal to the depth of the cup.
4. Why should I wait for a "candle close" before entering?
Waiting for a complete candle close outside the pattern boundary helps avoid "fakeouts", where the price breaks a level temporarily but fails to hold it. Entering on a "wick" is much riskier and more prone to false signals.
5. Which timeframe is best for identifying trend continuation patterns?
Continuation patterns are fractal and can be seen on various timeframes, from 1-hour to daily charts. However, it is a comprehensive trading strategy to use a Higher Time Frame (HTF) to determine the trend direction and a Lower Time Frame (LTF) to find the specific entry pattern.
6. Does volume matter when trading these patterns?
Absolutely. A breakout confirmed by a surge in trading volume is much more reliable than one on low volume. Volume acts as a secondary confirmation that market participants are backing the new move.
7. What is the best way to manage risks with trend continuation patterns?
Beyond stop-losses, the guide suggests setting them below recent swing lows (in uptrends) or highs (in downtrends). Be aware that the closer a stop-loss is to the breakout level, the more vulnerable it is to short-term market volatility.
8. How do I find an entry using an "Inside Day"?
Wait for the daily inside candle to close fully. Then, look for any of the other five continuation patterns (like a flag or triangle) to appear on a lower timeframe for a precise entry.
