
VWAP (Volume Weighted Average Price) is a technical indicator that calculates the average price of an asset over a given period, weighted by the volume traded at each price level. Unlike a simple moving average that treats every price equally, VWAP gives more weight to prices where more trading activity occurred, making it a more accurate representation of the true average price paid by the market. In crypto trading, VWAP is used as a dynamic support/resistance level, a benchmark for trade execution quality, and a signal for overbought and oversold conditions within a trading session.
In this guide, you will learn what VWAP stands for, how the formula works, how to read and trade VWAP signals, what anchored VWAP is, and how to add and use VWAP on your BingX charts.
What Is Volume Weighted Average Price (VWAP)?
VWAP stands for Volume Weighted Average Price. It is a single-line indicator plotted on a price chart that represents the average price of an asset over a specific period, calculated by weighting each price by the volume of trades that occurred at that price.
The key word is "weighted." A simple average of BTC/USDT prices over a day treats a candle with 100 BTC traded the same as a candle with 10,000 BTC traded. VWAP does not, it gives the high-volume candles significantly more influence on the average. This makes VWAP reflect where the majority of capital actually transacted, not just where price happened to print.
What Does VWAP Tell You?
VWAP acts as a real-time benchmark for the "fair value" of an asset during a trading session:
- Price above VWAP: The asset is trading above its volume-weighted average, buyers have been more aggressive. Often interpreted as bullish momentum or overbought conditions depending on context.
- Price below VWAP: The asset is trading below its volume-weighted average, sellers have been more aggressive. Often interpreted as bearish momentum or a potential buying opportunity depending on context.
- Price crossing VWAP: The moment price moves from above to below (or below to above) VWAP is one of the most watched intraday signals — it often marks a short-term shift in momentum.
Why VWAP Matters for Institutional Traders
VWAP was originally developed as an execution benchmark for institutional traders. When a fund needs to buy or sell a large position without moving the market against themselves, they break the order into smaller pieces and aim to execute near or better than the VWAP price. This is why VWAP is so well-respected as a fair value indicator, institutional order flow is literally anchored to it.
This institutional use creates a self-fulfilling element: because large players buy near VWAP (for longs) and sell near VWAP (for shorts), it tends to act as a magnet for price, creating genuine support and resistance at the VWAP level.
VWAP Formula: How It's Calculated
The VWAP formula is:
VWAP = Σ (Typical Price × Volume) / Σ Volume
Where:
- Typical Price = (High + Low + Close) / 3 for each candle
- Volume = trading volume for that candle
- Σ = cumulative sum from the start of the session
How to Calculate VWAP: Step-by-Step Guide
|
Candle |
High |
Low |
Close |
Typical Price |
Volume |
TP × Volume |
|
1 |
$85,200 |
$84,800 |
$85,000 |
$85,000 |
120 BTC |
$10,200,000 |
|
2 |
$85,500 |
$85,000 |
$85,400 |
$85,300 |
200 BTC |
$17,060,000 |
|
3 |
$85,400 |
$84,900 |
$85,100 |
$85,133 |
80 BTC |
$6,810,640 |
VWAP after candle 3:
VWAP = (10,200,000 + 17,060,000 + 6,810,640) / (120 + 200 + 80)
VWAP = 34,070,640 / 400
VWAP = $85,176.60
In practice, you never need to calculate VWAP manually. Every charting platform, including BingX's TradingView-integrated charts, plots it automatically.
What Is VWAP Reset: The Daily Session Problem in Crypto
In traditional stock markets, VWAP resets at 9:30 AM when the market opens each day — it starts fresh every session. In crypto, markets run 24/7 with no official open or close.
How most platforms handle this:
- Daily VWAP: resets at 00:00 UTC (or exchange-specific midnight)
- Weekly VWAP: resets on Monday midnight UTC
- Monthly VWAP: resets on the first of the month
This reset creates a known limitation: early in the day, VWAP is highly sensitive to the first few candles and can give distorted signals. VWAP becomes most reliable 3–4 hours into the session once sufficient volume has accumulated.
How to Add VWAP to Your BingX Charts
Adding VWAP to BingX's TradingView-integrated chart takes under a minute:
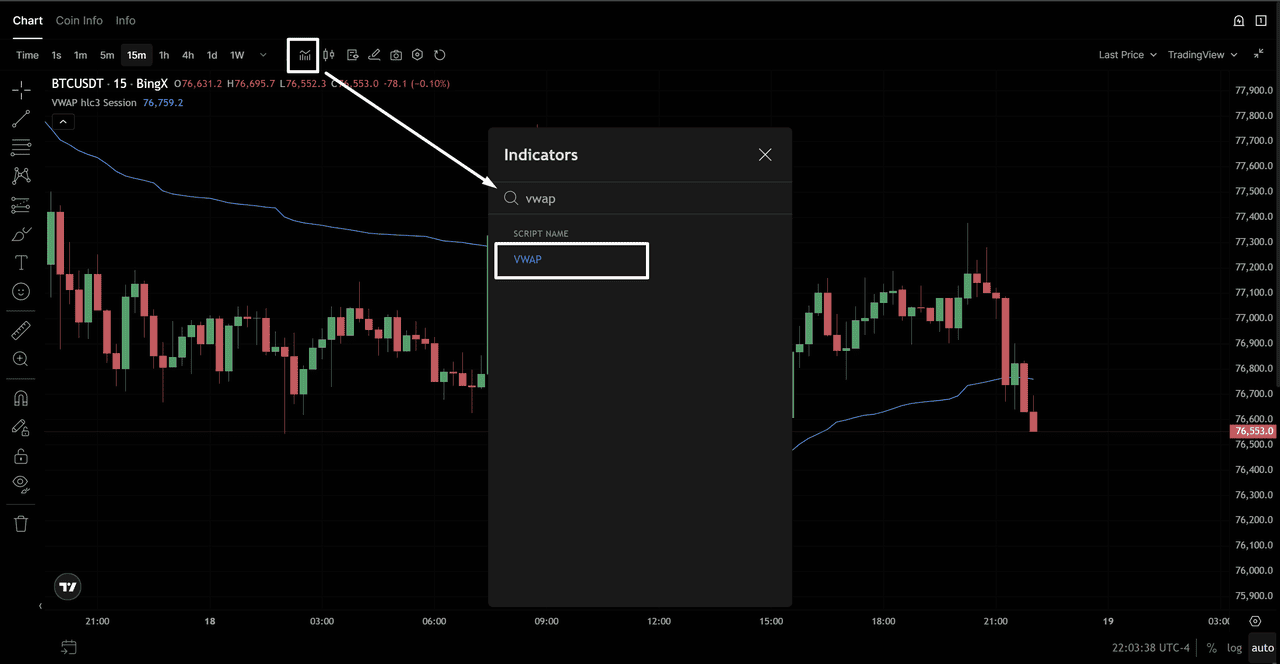
Applying VWAP on BTC/USD Chart - Source: BingX
- Open BingX and navigate to your trading pair (e.g., BTC/USDT)
- Click Advanced Chart to open the TradingView interface
- Click Indicators at the top of the chart
- Type VWAP in the search bar
- Select Volume Weighted Average Price (VWAP) from the results
- VWAP will immediately appear as a line on your chart
Applying VWAP on BTC/USD Chart - Source: BingX
Recommended VWAP Settings for Crypto Day Trading
|
Setting |
Recommended value |
Why |
|
Source |
HLC/3 (Typical Price) |
Standard calculation — matches the formula above |
|
Session reset |
Daily (00:00 UTC) |
Most widely used for intraday crypto |
|
Band multiplier |
1.0 and 2.0 |
Shows 1σ and 2σ standard deviation bands |
|
Timeframe |
1H, 4H, or 15M |
Daily timeframe charts; VWAP is less useful on Weekly+ |
|
Color |
Contrasting to price candles |
Easy visual separation from price action |
How to Read and Trade VWAP: 4 Core Signals
Signal 1: VWAP as Dynamic Support and Resistance
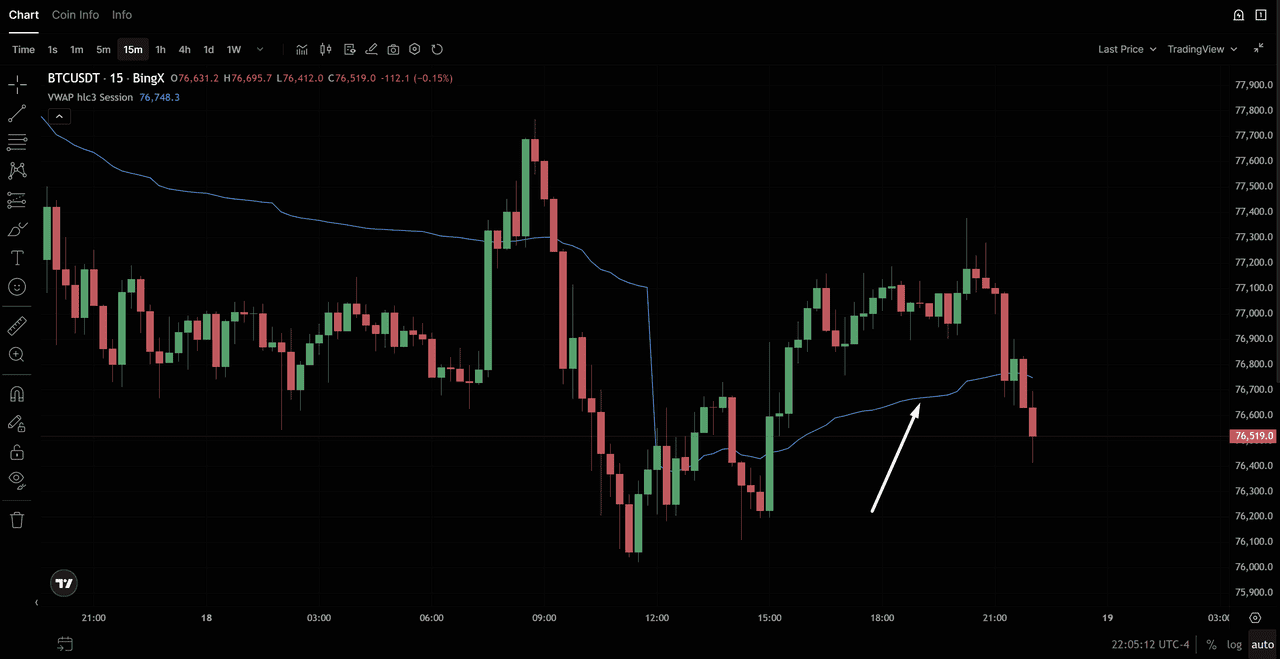
VWAP acts as a floating support or resistance level throughout the trading session. In a trending market:
- Uptrending day: Price tends to stay above VWAP, pulling back to it and bouncing. Each touch of VWAP from above = potential long entry.
BTC/USD Price Chart - Source: BingX
- Downtrending day: Price tends to stay below VWAP, rallying up to it and rejecting it. Each touch of VWAP from below = potential short entry or exit signal for longs.
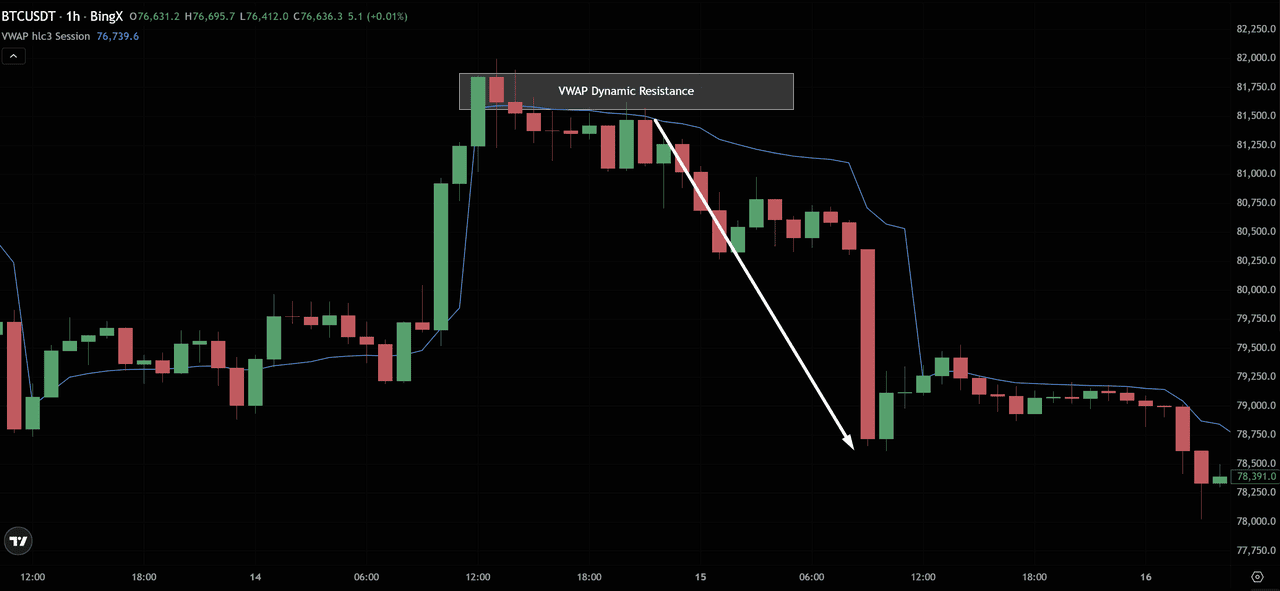
BTC/USD Price Chart - Source: BingX
How to trade it:
- In an uptrend: wait for price to pull back to VWAP → look for a bullish rejection candle (hammer, bullish engulfing) → enter long → stop-loss below the VWAP touch low → target the prior session high
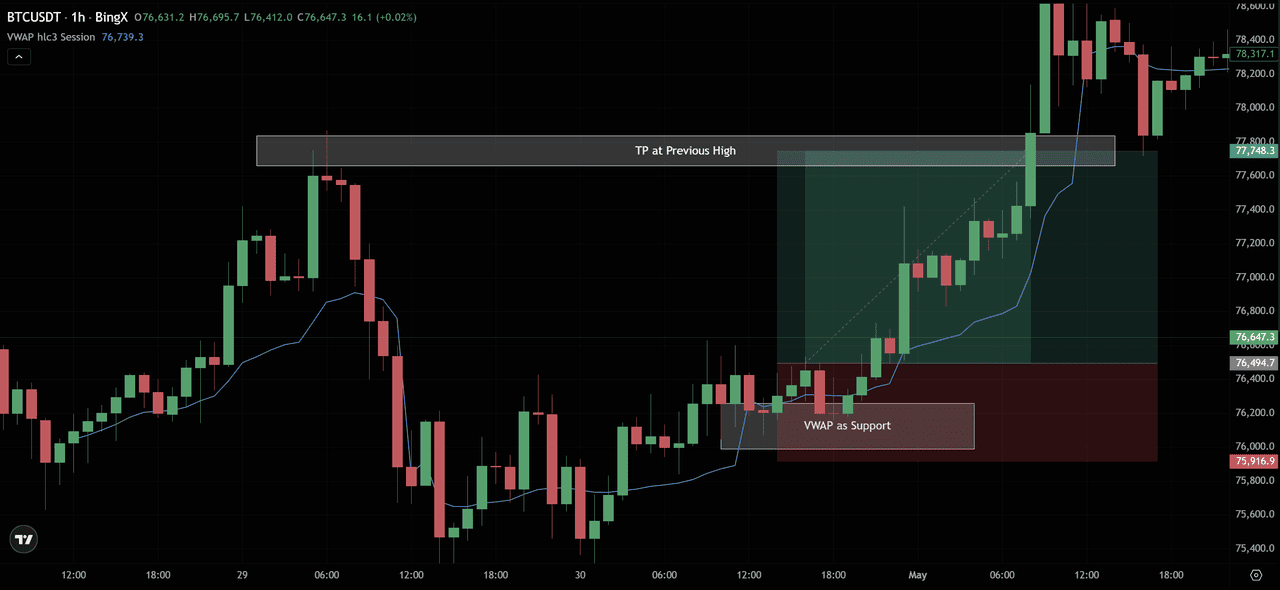
BTC/USD Price Chart - Source: BingX
- In a downtrend: wait for price to rally up to VWAP → look for a bearish rejection candle → enter short → stop-loss above the VWAP touch high → target the prior session low
BTC/USD Price Chart - Source: BingX
Signal 2: VWAP Cross (Momentum Shift)
When price crosses from below VWAP to above it (bullish cross), or from above VWAP to below it (bearish cross), it signals a potential intraday momentum shift.
|
Cross type |
What it signals |
Trading application |
|
Price crosses above VWAP (↑) |
Buyers have taken control — bullish momentum shift |
Look for long entries above VWAP; avoid new shorts |
|
Price crosses below VWAP (↓) |
Sellers have taken control — bearish momentum shift |
Look for short entries below VWAP; avoid new longs |
|
Price hovering around VWAP |
Market indecision — no clear directional bias |
Avoid new entries; wait for a decisive cross |
Important qualifier: A single candle crossing VWAP is not enough. Look for the closing price to be clearly on one side of VWAP, ideally confirmed by a volume spike on the cross candle.
Signal 3: VWAP Standard Deviation Bands
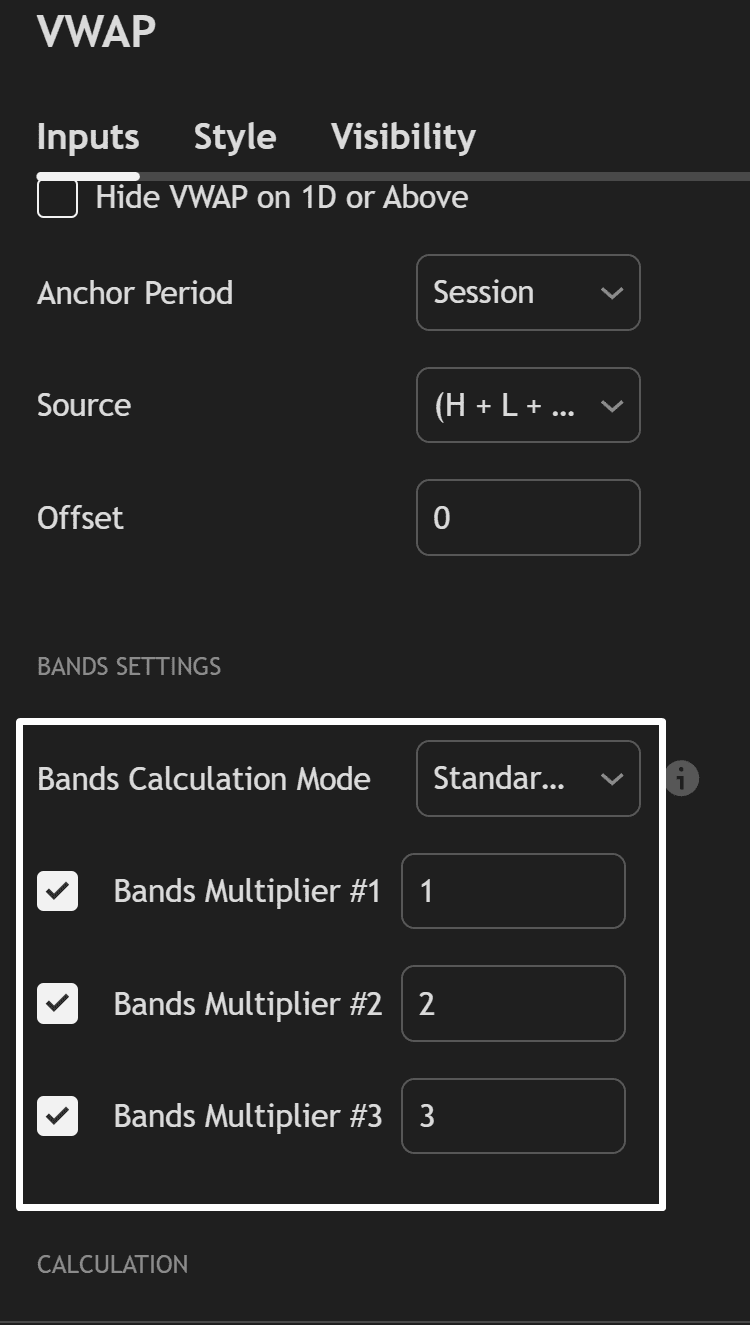
Most VWAP indicators include standard deviation bands plotted above and below the VWAP line. The chart above from BingX's BTC/USDT 1H Perpetuals shows exactly what this looks like in practice — the blue line is the VWAP, and the three green channel bands above and below it are the standard deviation bands set at 1σ, 2σ, and 3σ.
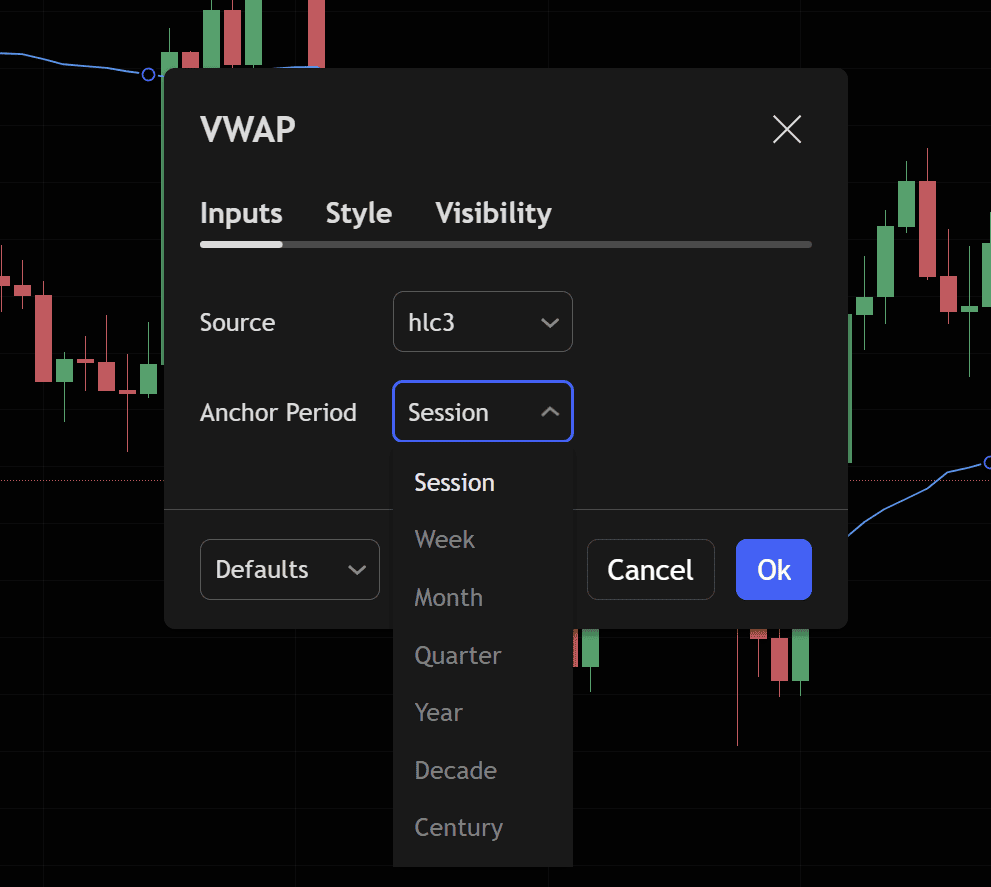
As you can see in the settings panel (Image 2), these are configured under Bands Settings with:
- Bands Multiplier #1: 1 (±1σ)
- Bands Multiplier #2: 2 (±2σ)
- Bands Multiplier #3: 3 (±3σ)
- Source: H + L + C / 3 (Typical Price — correct standard)
- Anchor Period: Session (resets daily)
|
Band |
What it shows |
Signal |
|
+1σ band |
Price is 1 standard deviation above VWAP |
Mildly overbought — reduce long exposure |
|
+2σ band |
Price is 2 standard deviations above VWAP |
Significantly overbought — strong mean-reversion signal |
|
−1σ band |
Price is 1 standard deviation below VWAP |
Mildly oversold — consider scaling into longs |
|
−2σ band |
Price is 2 standard deviations below VWAP |
Significantly oversold — strong mean-reversion signal |
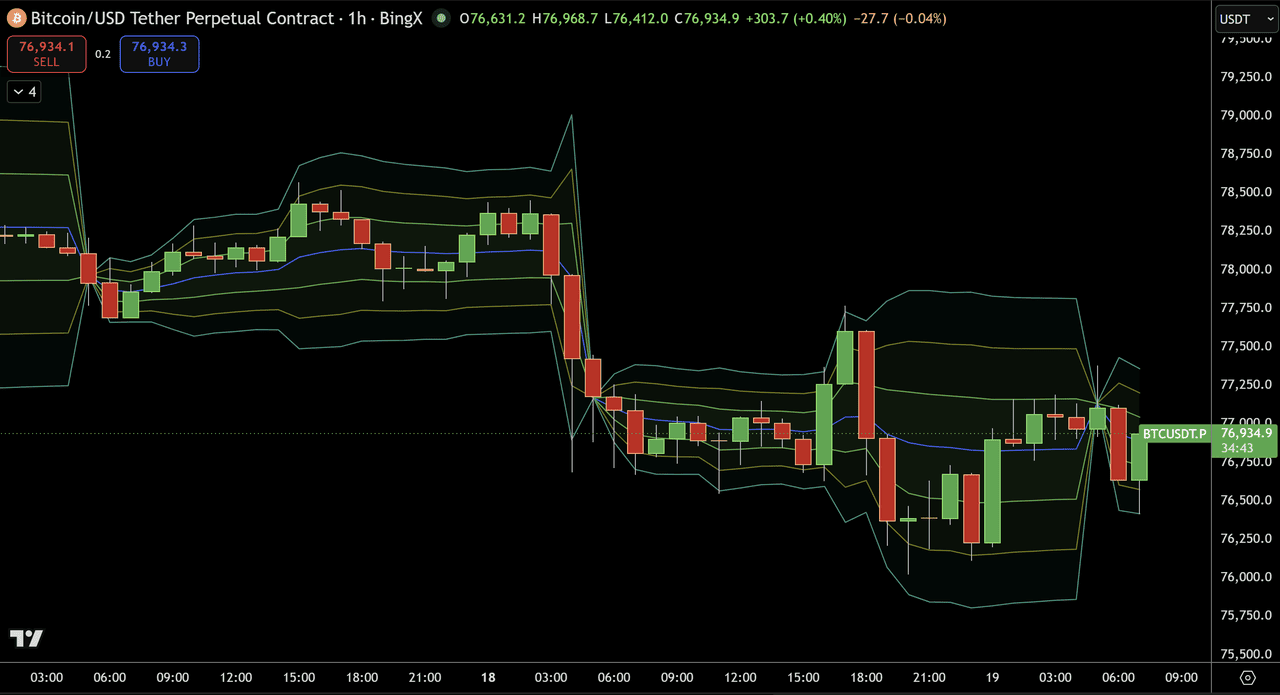
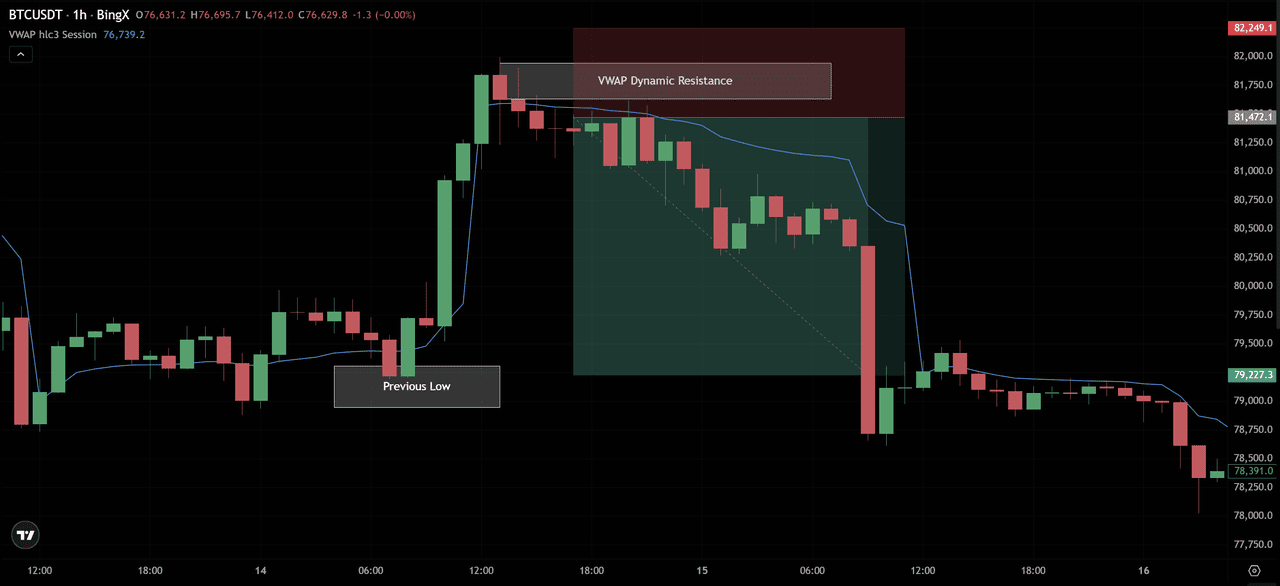
BTC/USD Price Chart - Source: BingX
Look at the sharp drop that begins just after 03:00 on March 18. Price was consolidating above the VWAP (blue line) and briefly spiked up toward the +2σ band, then collapsed sharply downward, breaking through VWAP and driving all the way to the −2σ and eventually −3σ lower band by the session's low near $76,000.
This is the mean reversion signal in action. Two clear setups are visible:
Bearish setup (short at the +2σ touch): When price spiked up toward the +2σ upper band just before the drop, that was the short trigger, price at an extreme extension above VWAP, a rejection candle forming at the band.
Entry short → stop above the +2σ band → target: return to VWAP (the blue line). The subsequent drop to $76,000 was the full move.
Bullish setup (long at the −2σ/−3σ touch): After the sharp move down, price pushed into the −2σ and −3σ lower bands (visible on March 18 from around 06:00–12:00). At those extremes, the band-touch + reversal candle setup triggers the long mean-reversion entry. Target: return to VWAP. The bounce back toward the VWAP line was the trade.
Mean reversion strategy rules
- When BTC/USDT touches the +2σ or +3σ band → look for a bearish rejection candle (shooting star, bearish engulfing) → short with stop above the band → target: VWAP (blue line)
- When price touches the −2σ or −3σ band → look for a bullish rejection candle (hammer, bullish engulfing) → long with stop below the band → target: VWAP
Signal 4: VWAP as a Trade Quality Benchmark
VWAP is used by institutional and sophisticated retail traders as a benchmark for measuring trade execution quality:
- Buying below VWAP = you paid less than the average market participant for the day → good execution
- Buying above VWAP = you paid more than the average market participant for the day → poor execution
- Selling above VWAP = you received more than the average market participant → good execution
- Selling below VWAP = you received less than the average → poor execution
This is why patient traders use VWAP to time their entries, waiting for price to dip below VWAP before buying gives them a statistically better entry price than buying into momentum above VWAP.
What Is Anchored VWAP (AVWAP): The More Powerful Version
Anchored VWAP (AVWAP) solves the daily reset limitation of standard VWAP by allowing you to anchor the VWAP calculation to any specific point on the chart, a key swing low, a major news event, a breakout candle, or the start of a trend.
Why Anchored VWAP Is More Useful Than Standard VWAP
Standard VWAP resets every day. This means on Day 3 of a move, yesterday's context is completely lost. Anchored VWAP preserves that context by calculating the volume-weighted average from your chosen anchor point forward.
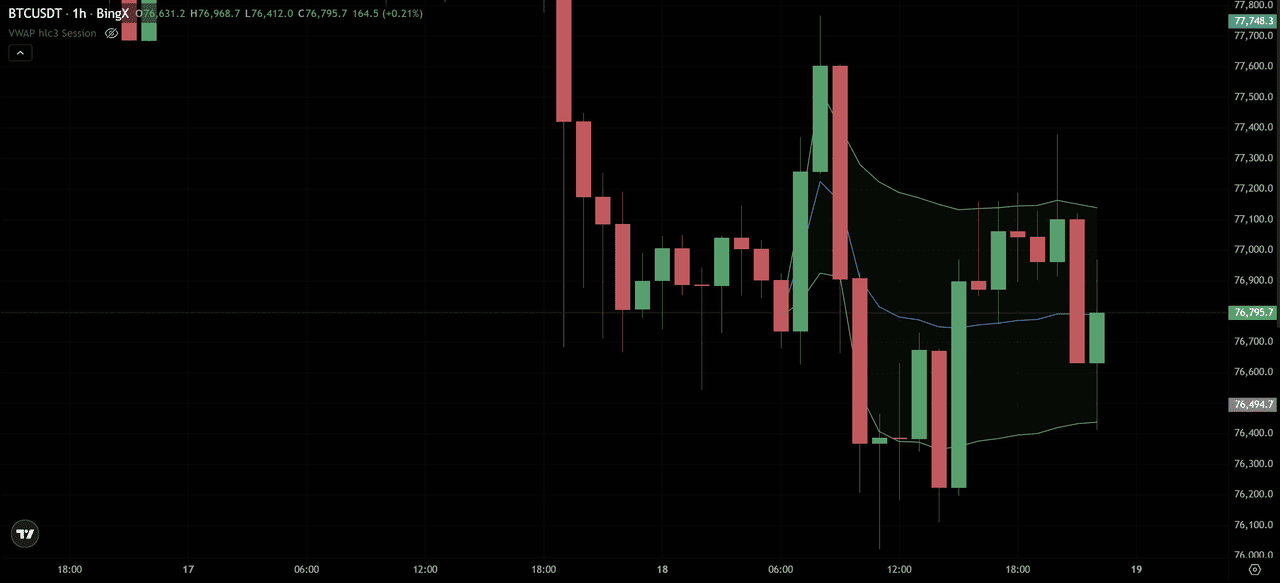
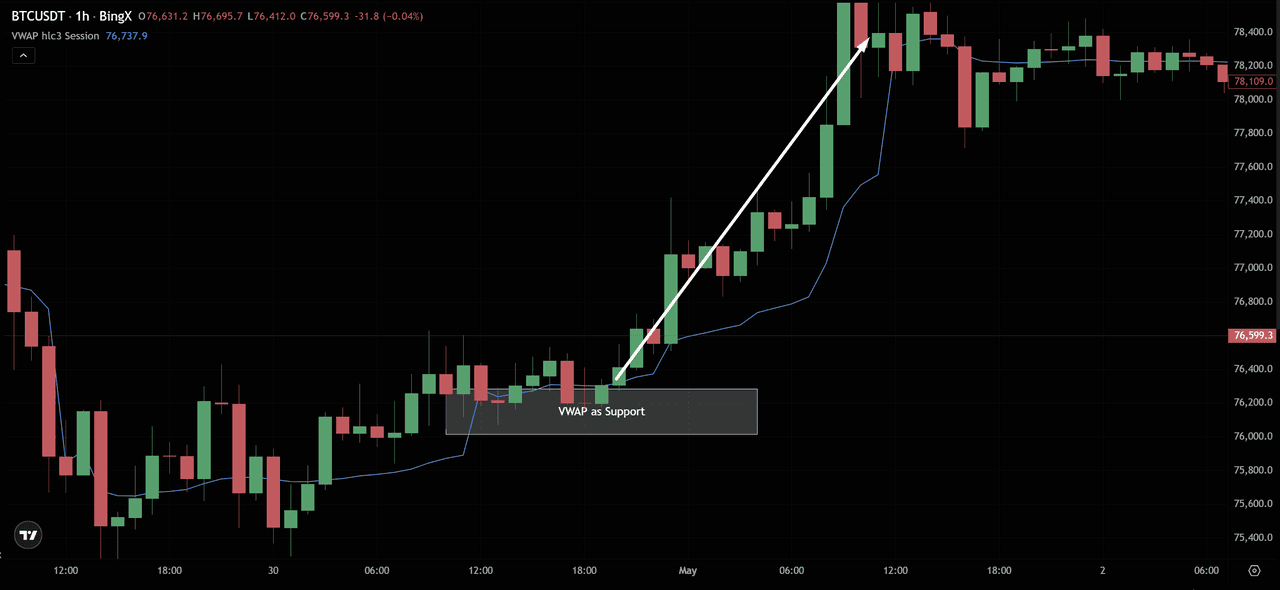
BTC/USD Price Chart - Source: BingX
The BingX BTC/USDT 1H chart above shows this clearly. The AVWAP (blue line) is anchored to the swing high that formed on March 17 — the peak before a significant sell-off. From that anchor point, the AVWAP line plots forward as a rolling fair value benchmark for everyone who bought or sold during and after that high.
Notice what happens next:
AVWAP acting as resistance on the bounce (March 18, around 09:00–12:00): After the sharp drop, BTC attempted to recover. Price rallied back up toward the AVWAP line, and immediately rejected. That rejection at the blue AVWAP line is the anchor working exactly as intended: the volume-weighted average of all transactions since the swing high acted as a ceiling, confirming sellers were still in control.
The lower band (−1σ green line) acting as support: During the continued downside into March 18's lows near $76,100, the lower green band provided a temporary support level — exactly where you would look for a mean-reversion long entry in a ranging scenario.
After 18:00 on March 18: Price consolidates below the AVWAP line, with the blue line now sloping downward as additional bearish volume accumulates. Price repeatedly tests the AVWAP from below without reclaiming it, a strong confirmation that the bearish anchor is still relevant.
Common Anchor Points for AVWAP
|
Anchor point |
What it shows |
|
Major swing high (as shown above) |
AVWAP from the top — acts as rolling resistance during downtrend |
|
Major swing low |
AVWAP from the bottom — acts as rolling support during uptrend |
|
High-volume event (e.g., Bitcoin halving, major news) |
Fair value from that specific event forward |
|
Significant liquidation candle |
Where the bulk of trapped positions are concentrated |
|
Previous ATH |
How current holders relate to the prior peak in volume-weighted terms |
How to Add Anchored VWAP on BingX
1. Open your BTC/USDT TradingView chart on BingX
2. Click Indicators → search Anchored VWAP
3. Select "Anchored VWAP" from results
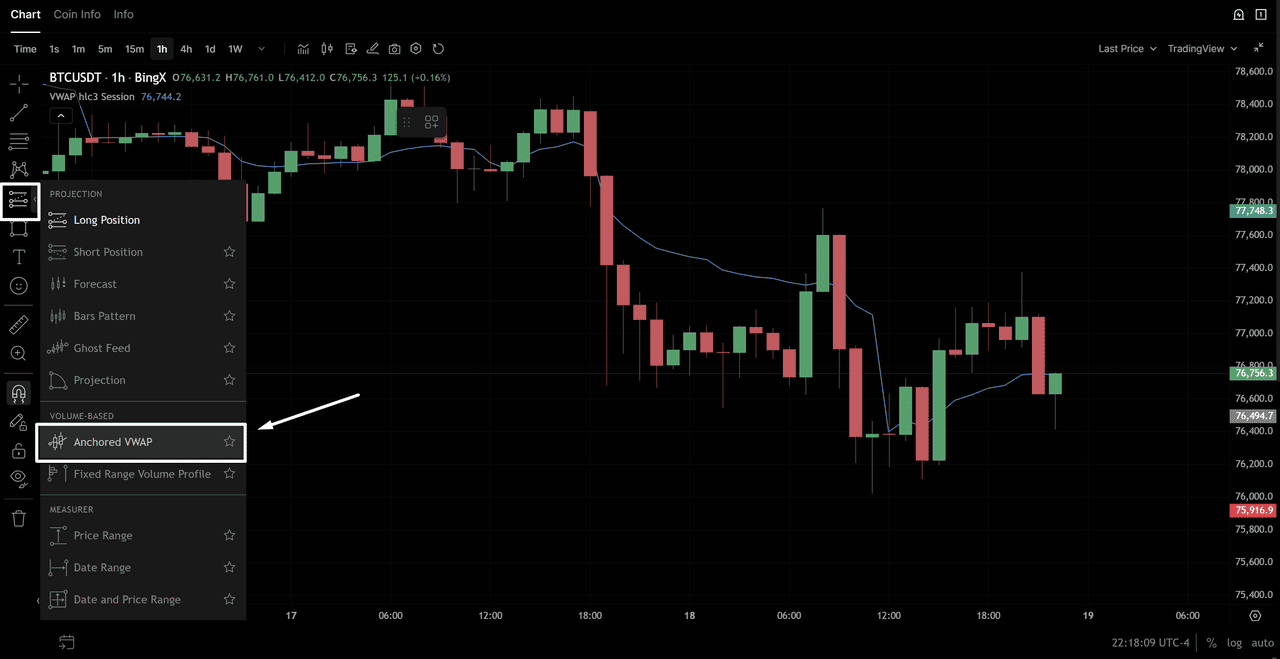
BTC/USD Price Chart - Source: BingX
4. Click on the candle on your chart where you want to anchor the VWAP (e.g., the most recent major swing low)
5. AVWAP will plot from that point forward
VWAP vs. Moving Averages: Key Differences
Traders often wonder whether to use VWAP or a simple/exponential moving average. They serve different purposes:
|
Feature |
VWAP |
Moving Average (SMA/EMA) |
|
What it measures |
Average price weighted by volume |
Average price (equal weight to all candles) |
|
Volume sensitivity |
Yes — high volume periods have more influence |
No — all periods treated equally |
|
Resets |
Daily (or anchored) |
Continuous — no reset |
|
Best timeframe |
Intraday (1M to 4H) |
Any timeframe (especially daily and above) |
|
Institutional relevance |
Very high — used as execution benchmark |
Lower — primarily retail technical tool |
|
Lag |
Relatively low within session |
Higher — especially SMA |
|
Best for |
Intraday entry/exit, fair value assessment |
Trend identification, higher timeframe analysis |
The practical combination: Use VWAP for intraday entries and exit timing. Use the 50 and 200 EMA on the daily chart for trend context. When all three align — price above VWAP AND above the 50 EMA AND above the 200 EMA — you have the highest-confidence bullish setup.
VWAP Limitations in Crypto: What Doesn't Work
VWAP is a powerful tool but has specific limitations in crypto that matter:
1. The 24/7 Problem
Unlike stocks which reset at a clear market open, crypto VWAP resets at an arbitrary midnight UTC. This means the "session" is not as meaningful for crypto as it is for equities. The daily reset can produce distorted early-session signals when initial volume is low.
Solution: Use Anchored VWAP from meaningful price events rather than relying solely on daily resets.
2. Weekend Volume Distortion
Crypto volume is typically 30–40% lower on weekends than weekdays. This means VWAP lines calculated over weekends incorporate lower-volume data, making them less reliable as institutional benchmarks. Be more cautious with VWAP signals on Saturday and Sunday.
3. Not Useful on Higher Timeframes
VWAP is an intraday tool. On daily, weekly, or monthly charts, it loses its meaning because the cumulative calculation over very long periods smooths out all the intraday fluctuations. Above the 4H timeframe, use moving averages or anchored VWAP instead.
4. Loses Value in Low-Liquidity Markets
On low-volume alt pairs, VWAP can be distorted by a single large trade. Before using VWAP as a signal on an altcoin pair, check whether the daily volume is sufficient (generally $5M+ daily volume for meaningful VWAP signals on lower caps).
5. Not Predictive — Only Descriptive
VWAP tells you where the average transaction occurred. It does not predict where price will go. Treat it as a reference level that informs your entries and exits, not as a target or guarantee.
Conclusion: Should You Use VWAP in Trading?
VWAP is one of the most practically useful indicators in crypto trading precisely because it is not just a technical study — it is the benchmark that institutional order flow is actually aligned to. When you buy near or below VWAP, you are buying where the market's aggregate volume says fair value is. When you short near or above VWAP, you are fading overextension beyond the volume-weighted average.
The key principles: use standard VWAP for intraday signals on 15M to 4H charts, use Anchored VWAP for meaningful multi-session reference levels, combine VWAP signals with RSI and volume for confirmation, and respect VWAP's limitations in crypto — the daily reset, weekend distortion, and low-volume alt pairs all require adjusted expectations.
Master VWAP on BingX's BTC/USDT 1H chart first. Mark the daily VWAP, identify the standard deviation bands, and watch how price interacts with the level across two weeks of live market data before trading any signals.
Related Articles
- What Is an Order Block in Crypto Trading?
- What Is a Liquidity Sweep in Crypto Trading?
- How to Use RSI in Crypto Trading
- Crypto Candlestick Patterns: A Complete Guide for Traders
- Crypto Chart Patterns: The Complete Guide for Traders
- How to Keep a Trading Journal: A Complete Guide for Crypto Traders
FAQs on VWAP (Volume-Weighted Average Price)
1. What does VWAP stand for?
VWAP stands for Volume Weighted Average Price. It is a technical indicator that calculates the average price of an asset over a given period, weighted by the volume traded at each price level. Unlike a simple average that treats all prices equally, VWAP gives more influence to prices where more trading activity occurred.
2. What is VWAP in trading?
In trading, VWAP is used as a dynamic support/resistance level, an institutional execution benchmark, and a signal for overbought/oversold conditions within a session. When price is above VWAP, the market is trading at a premium to the volume-weighted average, generally bullish. When price is below VWAP, it is trading at a discount, generally bearish or presenting a potential buying opportunity.
3. How do you calculate VWAP?
VWAP = Cumulative (Typical Price × Volume) / Cumulative Volume. Typical Price = (High + Low + Close) / 3. The calculation is cumulative from the start of the session. In practice, all charting platforms, including BingX's TradingView charts calculate and plot VWAP automatically. You never need to calculate it manually.
4. What is a good VWAP strategy?
The most reliable VWAP strategies are: (1) the VWAP pullback — in an uptrend, buying when price dips back to VWAP with a bullish rejection candle; (2) the VWAP breakout — entering in the direction of a volume-confirmed cross above or below VWAP; and (3) VWAP band mean reversion — fading extensions to the +2σ or −2σ bands back toward VWAP in ranging conditions.
5. What is anchored VWAP (AVWAP)?
Anchored VWAP is a version of VWAP where you manually choose the starting point of the calculation — anchoring it to a specific candle such as a swing low, swing high, breakout point, or significant market event. This is more flexible than standard VWAP which resets daily, and is particularly useful for identifying institutional fair value from meaningful price events.
6. What VWAP settings should I use for day trading crypto?
For crypto day trading, use: HLC/3 (typical price) as the source, daily session reset at 00:00 UTC, standard deviation bands at 1.0 and 2.0 multipliers, and a 1H or 15M timeframe as your primary chart. VWAP is most reliable after 3–4 hours into the session when sufficient volume has accumulated to make the weighted average meaningful.
7. Is VWAP useful for crypto trading?
Yes, but with important caveats. VWAP is most effective on high-liquidity crypto pairs (BTC/USDT, ETH/USDT) during active market hours. It is less reliable on low-volume altcoins, during weekends when volume is reduced, and on timeframes above 4H. Anchored VWAP is often more useful in crypto than daily VWAP because it is not affected by the arbitrary midnight reset.
8. What is the difference between VWAP and moving averages?
VWAP weights each price by volume — giving more influence to candles with heavy trading activity. Moving averages weight all candles equally regardless of volume. VWAP is primarily an intraday tool used for session-level fair value and execution benchmarking. Moving averages work across all timeframes and are better for identifying multi-day trend direction. The tools complement rather than replace each other.
9. How do I add VWAP to BingX charts?
On BingX, open your trading pair and click Advanced Chart to access the TradingView interface. Click Indicators at the top, search "VWAP", and select "Volume Weighted Average Price." The indicator will plot automatically on your chart. For Anchored VWAP, search "Anchored VWAP" and click on the candle where you want to anchor the calculation.
