
In mid-June 2026, the US Dollar Index (DXY) stands at a critical macroeconomic crossroads, caught between a structural hawkish shift in central bank policy and a sudden de-escalation of global geopolitical risk. Following the highly anticipated June 17 Federal Reserve decision, the greenback is trading near 100.30, consolidating a volatile 2.08% gain year-to-date.
While the currency gauge spent the first half of the year confined to a tight trading band, the formal handover of the central bank's leadership has dramatically rewritten the monetary playbook. Investors are aggressively factoring in a major hawkish surprise from the Summary of Economic Projections against an institutional restructuring that is injecting deep uncertainty into global foreign exchange markets.
As the international financial architecture monitors global capital rotations, sticky price pressures have forced a massive repricing of interest rate differentials. However, a major diplomatic breakthrough in the Middle East has simultaneously threatened to drain the safe-haven premium that has long cushioned the greenback.
This guide breaks down the US Dollar Index (DXY) forecast and price prediction for the remainder of 2026, combining primary source data from the Federal Reserve's latest dot plot, Trading Economics, Bloomberg consensus data, and institutional desk research.
You will also discover how to trade US Dollar Index (DXY) futures on BingX TradFi using USDT collateral.
Top 5 Things for Dollar Index (DXY) Traders to Know in 2026
As the dollar navigates a high-stakes regime marked by central bank transitions and structural economic crosscurrents, macro traders must focus on these five market-moving pillars:
- The Hawkish Warsh Dots: At the June 17, 2026 meeting, the Federal Open Market Committee (FOMC) held the benchmark rate unchanged at 3.50%–3.75%, but delivered a distinctly hawkish dot plot. The median rate projection for year-end 2026 was raised to 3.75%, up from 3.375% in March, signaling that rate cuts are completely off the table and locking in at least one 25-basis-point rate hike later this year.
- The Scrap of Forward Guidance: In his debut press conference as the 17th Federal Reserve Chair, Kevin Warsh aggressively modified central bank communication. Declaring that explicit forward guidance is not well suited to an volatile economic landscape, Warsh stripped predictive, forward-looking hints from the policy statement and opted to withhold his personal dot projection.
- The US–Iran MoU Oil Shock: The United States and Iran have broadly agreed to a comprehensive 14-point Memorandum of Understanding (MoU) in Switzerland. The peace accord outlines the removal of secondary energy sanctions and a phased unfreezing of $300 billion in Iranian assets in exchange for structural nuclear limits, sending Brent crude tumbling nearly 30% from its May peaks down below $80 per barrel.
- A Divergent CPI Metrics Split: U.S. headline consumer price inflation printed at a hot 4.2% in May, heavily driven by the localized energy shock from the Strait of Hormuz blockades. However, the Fed's newly prioritized trimmed-mean inflation frameworks, which strip out extreme data outliers, place underlying core inflation much lower, near 2.8%.
- Widen Yield Differentials: Backed by stronger-than-expected May retail sales showing a 0.9% month-on-month surge and a 3.8% spike in pending home sales, U.S. macro data continues to vastly outpace peer nations. This resilience has widened the 2-year Treasury yield differential against European Bunds and Japanese government bonds, reinforcing the dollar’s structural yield advantage.
What Is the US Dollar Index (DXY)?
The US Dollar Index (DXY) is a globally recognized benchmark that measures the value of the United States dollar relative to a geometrically weighted basket of six major world currencies. Established to provide a clean metric of the greenback's international purchasing power, the index's allocation matrix relies heavily on the trading relationships of the late 20th century.
The DXY Basket Composition
The index is maintained by the Intercontinental Exchange (ICE) and is heavily skewed toward European trade dynamics, with the Euro comprising over half of the total index weight:
- Euro (EUR): 57.6%
- Japanese Yen (JPY): 13.6%
- British Pound (GBP): 11.9%
- Canadian Dollar (CAD): 9.1%
- Swedish Krona (SEK): 4.2%
- Swiss Franc (CHF): 3.6%
Because of this specific configuration, a rising DXY indicates a strengthening dollar against the foreign basket, while a falling index represents relative greenback depreciation. For digital asset traders and global allocators, the index serves as the ultimate barometer of global liquidity and macro-driven risk sentiment.
The June FOMC Repricing: The Arrival of the Warsh Era
The Federal Reserve’s policy meeting on June 16–17, 2026, shattered the consensus expectation of a cooling dollar. Former Chair Jerome Powell has transitioned to a standard Governor role, leaving Kevin Warsh to guide the FOMC with an ironclad mandate to anchor price stability.
The policy statement formally removed the historic easing bias by eliminating references to additional policy adjustments, shifting the official stance to a pure data-dependent neutral mode. More importantly, out of 18 FOMC participants, nine now explicitly pencil in at least one rate hike before the end of 2026, with six members positioning for multiple increases.
FOMC June 2026 Economic Projections Shift
|
Metric |
June 2026 Forecast |
|
2026 Median Dot Rate |
3.750% (Up from 3.375% in March) |
|
2026 Core PCE Target |
3.3% (Up from 2.7% in March) |
|
2026 Real GDP Growth |
2.2% (Down from 2.4% in March) |
By adding a rate increase to the 2026 timeline and lifting core PCE expectations to 3.3%, the Fed has effectively forced global currency desks to abandon their structural bearish dollar forecasts.
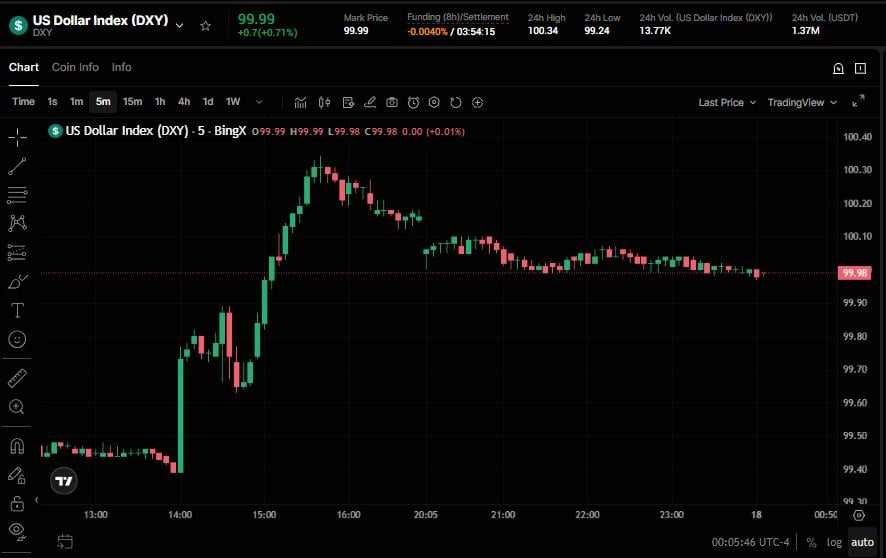
DXY Technical Trading Strategy: Key Levels and Structures for 2026
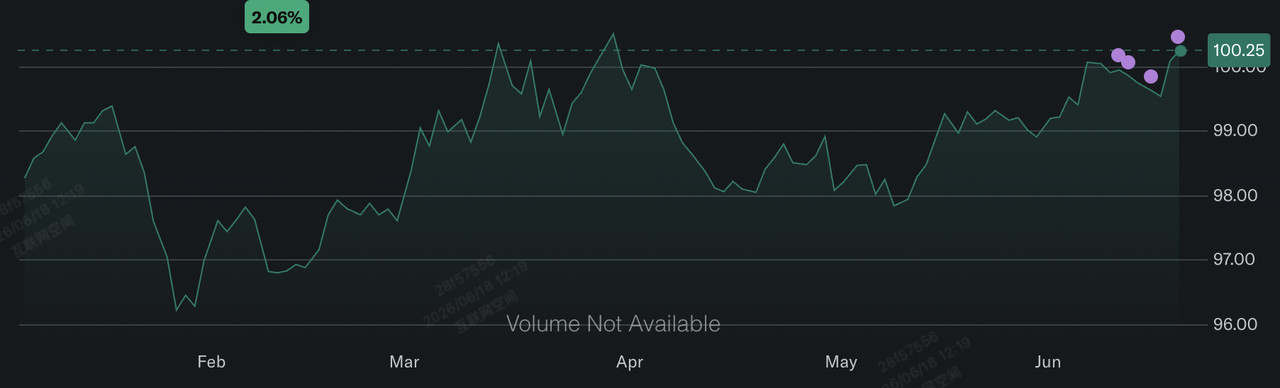
DXY YTD performance as of June 2026 | Source: Yahoo Finance
- The 15-Year Ascending Trendline: From a multi-year structural perspective, the dollar index is defending an ascending trendline that has supported the currency since May 2011. This line was retested and validated during the localized market bottoms of 2014, 2021, and early 2026, confirming that the long-term secular bull market remains technically intact.
- The 100.50 Resistance Boundary: On the daily and weekly charts, the 100.40 to 100.50 zone represents a severe structural ceiling. The index was rejected from this territory repeatedly throughout March and May. A clean daily close above 100.50 would invalidate the intermediate descending correction and trigger a technical breakout sequence.
- The 99.46 Structural Shelf: Intraday order flow shows a heavily defended higher-low shelf at 99.46, representing a multi-lens confluence of the H4 pivot support and the previous week's low. As long as the index holds above this mark on a daily closing basis, the near-term path of least resistance remains skewed to the upside.
Dollar Index 2026 Investment Outlook: $105 Peak vs. $95 Ceasefire Breakdown
Evaluating the dollar's macro trajectory for the remainder of 2026 requires balancing a newly hawkish central bank framework against the deflationary forces of a Middle Eastern peace accord.
The Bull Case for US Dollar: The $105.00 Hawkish Divergence Breakout
The bullish thesis rests entirely on a multi-month policy divergence play, closely mimicking the structural dollar rally of 2014–2015. Under this framework, if the U.S. labor market remains resilient and trimmed-mean inflation refuses to drop toward the 2% target, the Warsh-led Fed will be forced to execute its projected 25-basis-point rate hike in December 2026.
As European bond yields drop due to slowing regional growth and the Bank of England capitalizes on a softer domestic CPI print at 2.8% vs. 3.0% expected, the dollar's yield advantage will widen significantly. A clean breakout past the 100.50 technical barrier would quickly flush out macro short positions, exposing an open air pocket toward the 101.07 double-bottom target, eventually fueling a multi-month run to the 2022 cyclical highs near 105.00.
The Base Case for DXY: The $98.50 – $101.50 Consolidation Plateau
The baseline outlook anticipates a highly volatile, range-bound consolidation phase. In this scenario, the market systematically balances the Fed's aggressive 'high-for-longer' policy rate against the clear unwind of the geopolitical war premium.
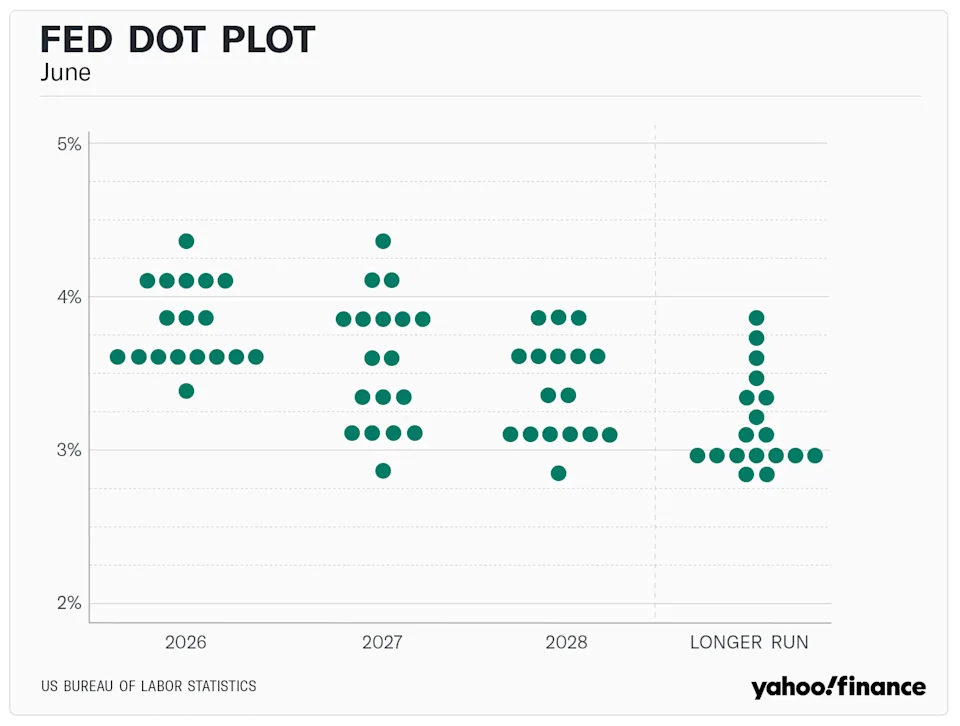
Fed dot plot | Source: Yahoo Finance
While the hawkish dot plot effectively sets a firm floor under U.S. Treasury yields, the structural finalization of the US–Iran peace treaty on Friday will ensure that Brent crude stabilizes in the low 70s. This drop in energy costs will naturally lower forward-looking inflation expectations over the next six months. Consequently, the index will likely remain capped within a defined horizontal corridor between 98.50 and 101.50, experiencing rapid two-sided volatility rather than a clean, trending expansion.
Dollar Index DXY's Bear Case: The $95.00 Global Convergence Trap
The bearish framework assumes that the dollar's current overvaluation triggers a sharp downward reversion as global growth metrics align. If the final signing of the Switzerland MoU triggers an immediate reopening of the Strait of Hormuz, global supply chains will rapidly normalize, completely removing the residual safe-haven bid supporting the greenback.
Simultaneously, if the European Central Bank (ECB) maintains its hawkish bias due to elevated Eurozone core CPI, revised up to 2.6% in May, capital will aggressively rotate out of over-allocated U.S. assets. A breakdown below the critical 99.46 structural shelf would confirm an ascending wedge breakdown on the daily chart, accelerating institutional liquidation down past the 50-day moving average toward the major long-term support floor at 95.55.
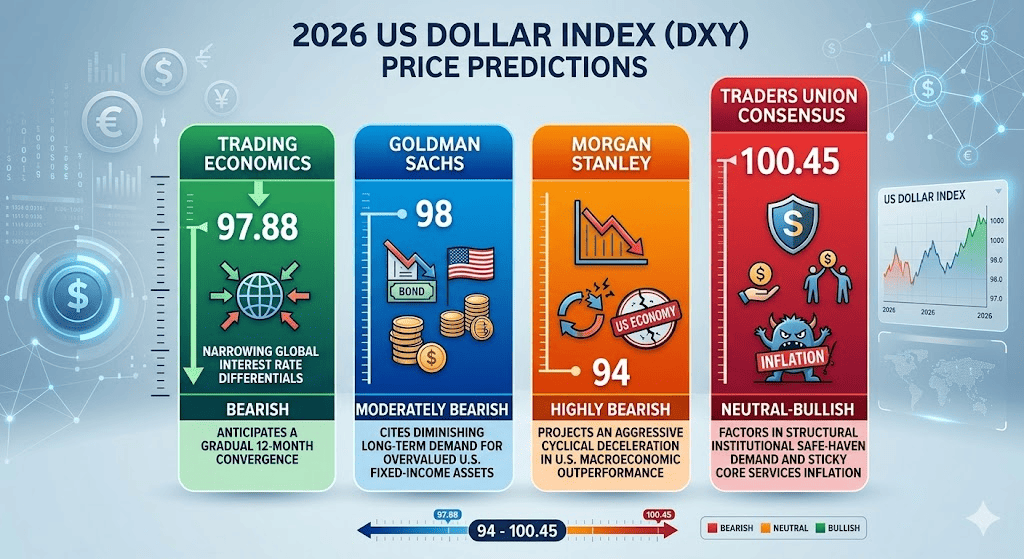
Institutional DXY Dollar Index Predictions for 2026
|
Institution / Platform |
2026 Price Target (Range/Peak) |
Core Macro Stance |
|
Trading Economics |
97.88 |
Bearish: Anticipates a gradual 12-month convergence as global interest rate differentials narrow. |
|
Goldman Sachs |
98 |
Moderately Bearish: Cites diminishing long-term demand for overvalued U.S. fixed-income assets. |
|
Morgan Stanley |
94 |
Highly Bearish: Projects an aggressive cyclical deceleration in U.S. macroeconomic outperformance. |
|
Traders Union Consensus |
100.45 |
Neutral-Bullish: Factors in structural institutional safe-haven demand and sticky core services inflation. |
How to Trade US Dollar Index (DXY) on BingX TradFi
DXY/USDT perpetual contract on BingX futures market
Macro traders can capitalize on central bank shifts and shifting yield differentials by utilizing the advanced TradFi infrastructure on the BingX platform:
- Access BingX TradFi: Log in to your account and navigate to the specialized TradFi tab on the main BingX exchange terminal.
- Select Your Currency Strategy: Choose the DXY-USDT perpetual contract in the perpetual futures market.
- Choose Your Direction: Select Open Long if you believe the hawkish Warsh dot plot and widening interest rate spreads will break the dollar above 100.50. Select Open Short if you expect the upcoming Friday peace treaty signing to dump the safe-haven premium.
- Configure Leverage Parameters: Apply your preferred Isolated or Cross-Margin modes alongside disciplined leverage ratios to maintain optimal capital efficiency.
- Deploy Advanced Order Risk Protections: Set precise Take-Profit and Stop-Loss (TP/SL) orders to shield your trading account from sudden multi-pip gap moves during high-impact economic data releases.
Read more: How to Trade Forex With Crypto in 2026: A Beginner's Guide
Top 5 Risks to Consider Before Trading the Dollar Index (DXY)
- The Friday MoU Signing Execution: Any last-minute complication or refusal to sign the 14-point peace framework in Switzerland will instantly reverse the crude oil sell-off, re-injecting an aggressive safe-haven bid into the dollar.
- Withholding of Forward Guidance: By abandoning predictive guidance, Chair Kevin Warsh has increased the baseline volatility of upcoming FOMC sessions, as markets can no longer rely on pre-baked policy hints.
- The Eurozone Interest Rate Bias: Because the Euro commands a massive 57.6% weight in the index, any independent hawkish surprise from the ECB will drastically suppress the DXY, regardless of internal domestic U.S. data.
- The 160.00 Japanese Yen Line: The USD/JPY pair is trading at historic extremes near 160.63, testing the widely recognized threshold for direct Japanese Ministry of Finance currency intervention. An abrupt yen-buying operation would spark an overnight drop in the index.
- Bitcoin's Persistent Inverse Correlation: The dollar index maintains a long-term inverse relationship with top-tier digital assets like Bitcoin (BTC). Macro shifts that alter global dollar liquidity will directly impact crypto risk-asset allocations.
Final Thoughts: Is the US Dollar a Buy After the Fed's Overhaul?
As of June 18, 2026, the US Dollar Index represents one of the most structurally supported yet tactically complex plays in global macro finance. Fundamentally, the combination of a hawkish Warsh dot plot forecasting a 2026 rate hike and resilient domestic consumer demand provides an unshakeable fundamental floor for the currency.
However, trading an index at the exact moment a generational geopolitical truce is being finalized requires extreme risk management discipline. For near-term macro traders, this environment provides an ideal backdrop for volatility capture via BingX TradFi futures. Long-term allocators, conversely, should watch the crucial 100.50 structural level on a weekly closing basis to confirm the next major secular expansion.
Risk Reminder: Foreign exchange and macro index trading involves significant financial risk due to shifting central bank regimes, sudden geopolitical developments, and systemic overnight liquidity gaps. Always apply guaranteed stops, strict position sizing parameters, and transparent risk management protocols.
Related Reading
- Is Gold a Good Investment in 2026? Risks & Returns Explained
- Crude Oil Price Forecast 2026: $140 War Premium or $60 Surplus Baseline?
- Bitcoin vs. Gold: What’s a Better Investment in 2026?
- Bitcoin vs. XRP: What’s a Better Investment in 2026?
- Silver Price Prediction for 2026: Can XAG Surge Above $200 or Face a Correction?
