


Energy has become one of the surprise trades of 2026. After lagging through much of 2025 while capital concentrated in AI, the sector has returned to focus as two forces collide: a renewed geopolitical oil risk premium and a structural power demand cycle driven by AI data centers. Oil prices remain highly sensitive to supply shocks, shipping routes, and producer discipline, while natural gas is increasingly tied to electricity demand, LNG exports, and the buildout of compute infrastructure.
That backdrop creates the central question for energy investors in 2026: are oil stocks or natural gas stocks the better way to gain exposure? Oil producers, oilfield services companies, and energy ETFs are more directly leveraged to crude prices and geopolitical volatility, while natural gas and LNG names benefit from export capacity, long-term contracts, and rising power demand from AI infrastructure. This guide compares both sides of the energy trade, reviews key names including XOM, OXY, COP, SLB, LNG, XLE, and XOP, and explains how to trade them on BingX TradFi using USDT-margined perpetual contracts.
Oil Stocks vs. Natural Gas Stocks in 2026: Key Trends Driving the Energy Market
The 2026 energy cycle is not moving as one single trade. Oil and natural gas are being driven by different forces: oil by geopolitics, supply risk, and crude price volatility; natural gas by power demand, LNG exports, and the AI data center buildout. Understanding this split is key to comparing oil stocks, gas stocks, and energy ETFs in 2026.
1. Geopolitical Risk Has Repriced Oil
Oil’s 2026 rally has been driven largely by geopolitical risk. The Strait of Hormuz disruption tied to the U.S.-Iran conflict pushed crude prices sharply higher, reinforcing how quickly oil markets can reprice when global supply routes are threatened. Since a meaningful share of seaborne oil moves through the region, any disruption can immediately add a risk premium to crude.
This directly benefits oil producers and oilfield service companies, whose earnings are highly sensitive to crude prices, drilling activity, and upstream capex. The risk is that this premium can reverse just as quickly if Middle East tensions ease, OPEC+ increases supply, or demand weakens.
Read More: Crude Oil Price Forecast 2026: $140 War Premium or $60 Surplus Baseline?
2. AI Power Demand Is Supporting Natural Gas
Natural gas has a different 2026 story. Instead of being driven mainly by geopolitical shocks, gas demand is increasingly tied to electricity generation and the rapid expansion of AI data centers. As AI workloads require more power, natural gas remains one of the key swing fuels supporting grid reliability.
This gives gas-levered names and LNG infrastructure companies a more structural demand angle than pure crude producers. Natural gas exposure is less about oil price spikes and more about power demand, long-term contracts, LNG exports, and the electrification of computing.
Read More: Top AI Data Center Stocks to Buy in 2026: Cloud, Servers, and AI Compute Infrastructure
3. Capital Discipline Is Strengthening Energy Balance Sheets
The 2025 downturn forced energy companies to become more disciplined. Many producers reduced debt, controlled costs, and prioritized free cash flow instead of chasing production growth. That has left the sector entering 2026 with stronger balance sheets and better shareholder return potential than in previous cycles.
The risk is capex discipline breaking down. If companies ramp spending too aggressively during a price spike, those projects could become less attractive if oil or gas prices normalize. This risk is especially important for smaller producers and highly cyclical upstream names.
4. Investors Are Rotating Back Into Energy
Energy has also benefited from a broader market rotation. After AI and high-growth technology dominated 2025, investors began looking for sectors with cash flow, commodity leverage, and defensive characteristics. As crude prices rose and technology stocks became more volatile, energy ETFs such as XLE and XOP attracted renewed attention.
The open question is whether this rotation is structural or tactical. If oil prices stay elevated and power demand keeps rising, energy could remain a core 2026 theme. If geopolitical risk fades and capital flows return to high-growth tech, the rally may become more selective.
Top Oil Stocks to Watch in 2026: XOM, OXY, COP, and SLB
Oil-weighted stocks are the most direct way to express a bullish view on crude prices. The names below cover different parts of the oil value chain, including integrated majors, upstream exploration and production companies, and oilfield service providers. Each responds differently to crude price moves, capital discipline, and geopolitical risk premiums.
1. ExxonMobil (XOM)
Core Role: Integrated oil major with low-cost Permian and Guyana production
ExxonMobil is the bellwether of the oil sector and one of the most diversified names in the group, with exposure across upstream production, refining, chemicals, and LNG. The 2026 thesis is built around elevated oil prices, record production, and continued cost discipline. In 2025, Exxon reached record output of 4.7 million oil-equivalent barrels per day, supported by growth in the Permian Basin and Guyana.
Q1 2026 results reinforced the strength of the model, with adjusted EPS of $2.09 and revenue of $85.1 billion, both ahead of expectations. Exxon also achieved first LNG at Golden Pass Train 1, adding a higher-margin natural gas export leg to its broader energy portfolio.
Capital returns remain central to the investment case. Exxon plans $20 billion in share repurchases for 2026 and has delivered 43 consecutive years of dividend growth. The stock benefits directly from higher crude prices, but the risk is equally clear: if geopolitical risk fades and oil prices move lower, upstream earnings and downstream margins could compress quickly.
Read More: Exxon Mobil (XOM) Price Prediction 2026: $180 Energy Alpha or Geopolitical Value Trap?
XOM Price Trend (2020–2026 YTD)
|
Year |
Yearly High |
Yearly Low |
Annual Return |
Market Conditions |
|
2020 |
$71.37 |
$30.11 |
−40.85% |
Pandemic demand collapse; oil briefly negative |
|
2021 |
$66.38 |
$31.11 |
0.4806 |
Demand recovery; reflation trade |
|
2022 |
$114.66 |
$59.32 |
0.8026 |
Russia-Ukraine war; energy crisis peak |
|
2023 |
$120.70 |
$95.77 |
−8.20% |
Prices normalize; Pioneer acquisition announced |
|
2024 |
$126.34 |
$95.92 |
0.0759 |
Record production; Guyana and Permian growth |
|
2025 |
$118.50 |
$97.80 |
0.055 |
WTI falls to $57 by December; value-orphan phase |
|
2026 YTD |
$176.41 (52-wk) |
$101.19 (52-wk) |
+~30% YTD |
Strait of Hormuz spike; record high $170; Golden Pass LNG online |
2. Occidental Petroleum (OXY)
Core Role: Oil-weighted E&P with high sensitivity to crude prices
Occidental Petroleum is one of the most crude-sensitive large-cap U.S. oil producers. Its oil-weighted production profile and higher financial leverage make OXY more responsive to oil price swings than integrated majors like ExxonMobil. That sensitivity has worked in its favor in 2026, with shares rising sharply from around $40 at the end of 2025 to a peak above $65 before settling near $57.
The rally has been supported by two major catalysts: the Strait of Hormuz-driven oil price spike and a $5.8 billion debt reduction funded by the sale of OxyChem to Berkshire Hathaway. Q1 2026 results also strengthened the bull case, with adjusted EPS of $1.06 beating consensus, production reaching 1.43 million BOE/day, and free cash flow rising 52% year over year to $1.7 billion.
The main risk is that OXY’s premium valuation depends heavily on crude staying elevated. If oil prices normalize, the same leverage that boosts upside can quickly pressure earnings and the stock multiple. Berkshire Hathaway’s large ownership stake remains a structural support, but OXY is still best viewed as a higher-beta oil producer rather than a defensive energy holding.
Read More: Occidental Petroleum (OXY) Price Prediction 2026: $115 Net-Zero Alpha or $55 Commodity Trap?
OXY Price Trend (2020–2026 YTD)
|
Year |
Yearly High |
Yearly Low |
Annual Return |
Market Conditions |
|
2020 |
$47.59 |
$8.52 |
−57.50% |
Pandemic crash; near-bankruptcy fears post-Anadarko |
|
2021 |
$34.30 |
$20.83 |
0.72 |
Recovery; Berkshire builds position |
|
2022 |
$77.13 |
$28.46 |
1.173 |
Energy crisis; Berkshire stake expands; best S&P performer |
|
2023 |
$71.18 |
$55.16 |
−5.50% |
Prices normalize; CrownRock acquisition |
|
2024 |
$69.49 |
$45.27 |
−16.80% |
Oil weakness; debt and integration overhang |
|
2025 |
$53.40 |
$34.50 |
−12.00% |
WTI falls to $57; value-orphan phase, deep discount |
|
2026 YTD |
$67.45 (52-wk) |
$38.80 (52-wk) |
+~40% YTD |
Hormuz spike; OxyChem sale cuts debt $5.8B; leadership transition |
3. ConocoPhillips (COP)
Core Role: Large-cap pure-play E&P with disciplined capital returns
ConocoPhillips is the more balanced upstream oil name in this group. As a pure-play exploration and production company, COP is directly exposed to crude and natural gas prices, but it carries a stronger balance sheet and more disciplined capital-return framework than higher-beta producers like Occidental.
Q1 2026 results showed adjusted EPS of $1.89, ahead of consensus, with cash from operations reaching $5.4 billion and a second-quarter dividend of $0.84 per share. The company also updated full-year production and capital guidance while keeping operating cost guidance unchanged, pointing to stable execution despite a volatile commodity backdrop.
The stock is up roughly 33% year to date in 2026, benefiting from the broader energy rotation while offering less leverage-driven volatility than OXY. The main risk is that COP remains a pure upstream producer, so it lacks the refining and chemicals cushion that helps integrated majors like Exxon when oil prices fall.
COP Price Trend (2020–2026 YTD)
|
Year |
Yearly High |
Yearly Low |
Annual Return |
Market Conditions |
|
2020 |
$65.69 |
$20.84 |
−36.50% |
Pandemic demand collapse |
|
2021 |
$77.81 |
$32.43 |
0.82 |
Recovery; shale discipline narrative |
|
2022 |
$138.49 |
$66.64 |
0.713 |
Energy crisis; record cash returns |
|
2023 |
$135.18 |
$97.66 |
−8.50% |
Prices normalize; Marathon Oil deal announced |
|
2024 |
$135.79 |
$92.40 |
−10.50% |
Oil weakness; Marathon integration |
|
2025 |
$115.00 |
$79.00 |
−8.00% |
WTI falls to $57; value-orphan phase |
|
2026 YTD |
~$125 (May) |
~$88 (Jan) |
+~33% YTD |
Hormuz spike; Q1 EPS beat; disciplined guidance maintained |
4. SLB (SLB)
Core Role: Oilfield services leader with digital and AI infrastructure exposure
SLB, formerly Schlumberger, is the world’s largest oilfield services provider and the most differentiated name in the oil group. Its core business supplies the equipment, software, and data analytics used to locate, drill, and manage oil and gas production. In 2026, the company is also expanding into digital operations and data center infrastructure, supported by a partnership with NVIDIA and a $1 billion run-rate target for its data center business by year-end.
Q1 2026 was more challenging than the producer names. EPS of $0.52 beat consensus but declined 28% year over year, while revenue of $8.72 billion topped expectations. Conflict-related disruptions in Qatar and Iraq pressured the Reservoir Performance and Well Construction segments, even as the Digital segment grew 9% to $640 million and the ChampionX acquisition added scale.
SLB’s positioning is different from oil producers. Higher crude prices can support drilling activity over time, but geopolitical conflict can also disrupt field operations in the near term. The upside comes from its digital and AI infrastructure pivot, while the risk is that oilfield services demand remains exposed to producer capex, regional instability, and execution around the company’s new growth businesses.
Read More: SLB Stock Prediction 2026: $83 Digital AI Breakout or $48 Geopolitical Trap?
SLB Price Trend (2020–2026 YTD)
|
Year |
Yearly High |
Yearly Low |
Annual Return |
Market Conditions |
|
2020 |
$41.21 |
$11.87 |
−43.00% |
Pandemic; services capex slashed industry-wide |
|
2021 |
$36.16 |
$19.43 |
0.41 |
Activity recovery; international rebound |
|
2022 |
$61.55 |
$28.83 |
0.76 |
Energy crisis; services pricing power returns |
|
2023 |
$62.12 |
$45.13 |
−4.00% |
Prices normalize; digital transition begins |
|
2024 |
$58.84 |
$40.18 |
−12.00% |
Activity plateau; ChampionX deal announced |
|
2025 |
$48.00 |
$32.00 |
−10.00% |
WTI falls to $57; services spending caution |
|
2026 YTD |
~$66 (May) |
~$36 (Jan) |
+~25% YTD |
Hormuz spike; Qatar/Iraq disruptions; NVIDIA data center pivot |
Top Natural Gas Stocks in 2026: LNG Exports and AI Power Demand
Natural gas stocks respond to a different set of drivers than oil producers. Instead of being mainly tied to crude prices and geopolitical risk premiums, natural gas names are more closely linked to LNG export capacity, long-term contracts, power generation demand, and the electricity needs of AI data centers. The standout pure-play in this group is Cheniere Energy, the largest U.S. LNG exporter.
Read More: Natural Gas Price Prediction 2026: $15 Global Energy Shock or U.S. Glut Trap?
5. Cheniere Energy (LNG)
Core Role: Largest U.S. LNG exporter with long-term contracted volumes
Cheniere Energy is the cleanest public-market play on U.S. LNG exports. The company operates the Sabine Pass terminal in Louisiana and the Corpus Christi terminal in Texas, giving it a central role in connecting U.S. natural gas supply with global demand. Unlike oil producers, Cheniere’s business is largely built on long-term fixed-and-variable-fee contracts, which creates more stable cash flow and lower sensitivity to short-term commodity price swings.
Q1 2026 revenue reached $5.87 billion, while management raised full-year adjusted EBITDA guidance to $7.25 billion to $7.75 billion, supported by record LNG production and exports. Geopolitical disruptions have also increased demand for secure U.S. LNG volumes, reinforcing Cheniere’s role as a key supplier in global energy markets.
The investment case is stability plus structural demand. Cheniere benefits from LNG export growth, long-term contracted volumes, and rising natural gas demand tied to power generation and AI data center expansion. The trade-off is that its contracted model gives it less upside to spot LNG price spikes than a pure commodity producer, but also significantly lower volatility than most oil-levered energy stocks.
Read More: Cheniere Energy (LNG) Price Prediction 2026: $330 Sovereign Boom or $210 Infrastructure Trap?
LNG Price Trend (2020–2026 YTD)
|
Year |
Yearly High |
Yearly Low |
Annual Return |
Market Conditions |
|
2020 |
$65.00 |
$24.00 |
0.03 |
Pandemic LNG demand dip; recovery late year |
|
2021 |
$104.00 |
$58.00 |
0.59 |
Global gas shortage; European demand surge |
|
2022 |
$178.00 |
$98.00 |
0.74 |
Russia-Ukraine war; Europe pivots to U.S. LNG |
|
2023 |
$185.00 |
$140.00 |
0.1 |
Prices normalize; capacity expansion continues |
|
2024 |
$200.00 |
$150.00 |
0.25 |
Corpus Christi Stage 3 ramp; record exports |
|
2025 |
$246.42 |
$186.20 |
0.15 |
AI power demand narrative emerges; data center gas |
|
2026 YTD |
~$246 (52-wk) |
~$200 (Jan) |
+~8% YTD |
EBITDA guidance raised $500M; record Q1 production; PT to $303 |
Energy ETFs in 2026: Broad Energy vs. E&P Exposure
For investors who prefer diversified exposure over single-stock risk, energy ETFs can capture the 2026 energy cycle through a basket of companies. XLE offers broader large-cap energy exposure with lower single-name risk, while XOP is more concentrated in exploration and production companies with higher sensitivity to crude price moves.
6. Energy Select Sector SPDR ETF (XLE)
Core Role: Broad large-cap energy ETF dominated by integrated majors
XLE is the benchmark U.S. energy ETF and one of the most conservative ways to gain broad sector exposure. The fund is heavily weighted toward large integrated energy companies, with ExxonMobil and Chevron together making up a large share of the portfolio. This gives XLE exposure to upstream production, refining, LNG, and broader energy cash flows without relying on a single company.
The fund rallied strongly during the 2026 rotation into energy, supported by higher crude prices, geopolitical risk, and investor demand for cash-flow-heavy sectors. Its industry mix remains heavily tilted toward oil, gas, and consumable fuels, which means XLE captures the energy price cycle more directly than the utility-side power demand story.
The appeal of XLE is quality and stability. It can work as a broad energy-sector vehicle for investors seeking inflation hedging, geopolitical risk exposure, or dividend-oriented energy exposure. The trade-off is that XLE may deliver less upside than more volatile E&P-focused names during sharp crude rallies, and it has limited direct exposure to AI-driven electricity demand.
Read More: Energy Select Sector XLE ETF Prediction 2026: $65 Energy Supercycle or $40 Hormuz Hedge Exit?
XLE Price Trend (2020–2026 YTD)
|
Year |
Yearly High |
Yearly Low |
Annual Return |
Market Conditions |
|
2020 |
$60.20 |
$22.88 |
−33.00% |
Pandemic energy collapse |
|
2021 |
$58.74 |
$35.74 |
0.48 |
Reflation; energy leads market recovery |
|
2022 |
$94.71 |
$56.34 |
0.58 |
Energy crisis; best S&P sector by far |
|
2023 |
$93.31 |
$78.49 |
−1.30% |
Prices normalize; consolidation |
|
2024 |
$98.97 |
$82.46 |
0.057 |
Range-bound; capital discipline theme |
|
2025 |
$95.00 |
$78.00 |
−5.00% |
WTI falls to $57; value-orphan phase |
|
2026 YTD |
~$110 (May) |
~$82 (Jan) |
+~38% YTD |
Great rotation into energy; bunker-asset bid |
7. SPDR S&P Oil & Gas Exploration & Production ETF (XOP)
Core Role: E&P-focused ETF with higher crude price sensitivity
XOP is the higher-beta energy ETF, focused on exploration and production companies rather than integrated majors. Its equal-weight structure gives it broader exposure to smaller and more crude-sensitive E&P names, making it more responsive to oil price rallies than XLE. This is why XOP outperformed during the 2026 energy rebound, rising roughly 43% year to date versus XLE’s 38%.
The upside is direct crude exposure. When oil prices rise because of geopolitical shocks, supply disruptions, or stronger upstream fundamentals, XOP tends to capture more of the move because its holdings are primarily producers rather than diversified energy companies with refining or chemical businesses.
The risk is the same leverage in reverse. If crude prices normalize, OPEC+ increases supply, or smaller producers face hedging losses and capex fatigue, XOP can fall more sharply than broad energy ETFs. For investors, XOP is best suited for a stronger oil-price view and a higher tolerance for volatility.
Read More: XOP S&P Oil & Gas ETF Prediction 2026: $210 Geopolitical Moonshot or $130 Hedge Trap?
XOP Price Trend (2020–2026 YTD)
|
Year |
Yearly High |
Yearly Low |
Annual Return |
Market Conditions |
|
2020 |
$94.00 |
$31.00 |
−37.00% |
Pandemic E&P collapse; bankruptcies |
|
2021 |
$110.00 |
$58.00 |
0.58 |
Recovery; shale survivors rerate |
|
2022 |
$168.00 |
$92.00 |
0.42 |
Energy crisis; E&P cash flow surge |
|
2023 |
$155.00 |
$120.00 |
−2.00% |
Prices normalize; M&A consolidation |
|
2024 |
$158.00 |
$120.00 |
0.03 |
Range-bound; capital discipline |
|
2025 |
$150.00 |
$110.00 |
−8.00% |
WTI falls to $57; deepest value discount |
|
2026 YTD |
~$195 (May) |
~$130 (Jan) |
+~43% YTD |
Hormuz spike; highest-beta energy rotation winner |
Oil Stocks vs. Gas Stocks vs. Energy ETFs: Which One Should You Choose?
Oil stocks, natural gas stocks, and energy ETFs all provide exposure to the 2026 energy cycle, but they respond to different drivers. Oil stocks are more directly tied to crude prices, geopolitical risk, and upstream production margins. Natural gas stocks are more connected to LNG exports, long-term contracts, and rising electricity demand from AI data centers. Energy ETFs offer diversified exposure across the sector, making them more suitable for investors who want broad energy participation without relying on a single company.
For investors with a strong bullish view on crude, oil producers and E&P-focused ETFs usually offer the highest upside. For investors seeking more stable cash flow and exposure to global gas demand, LNG-linked names may be more suitable. For those who want a simpler, diversified approach, broad energy ETFs can reduce single-stock risk while still capturing the sector rotation.
Read More: Top Energy Stocks and ETFs to Buy in 2026: The AI Power Crunch Meets Geopolitical Volatility
|
Ticker |
Category |
Best For |
Primary Driver |
Risk Profile |
|
XOM |
Integrated oil major |
Conservative oil exposure |
Crude prices, production growth, refining margins, LNG expansion |
Moderate; downstream and integrated operations help cushion oil downside |
|
OXYUS |
Oil E&P |
High-beta crude exposure |
Crude prices, upstream production, balance sheet deleveraging |
High; leverage amplifies both upside and downside |
|
COPUS |
Oil E&P |
Balanced upstream exposure |
Crude prices, disciplined capital returns, production stability |
Moderate-high; direct commodity exposure but lower leverage than OXY |
|
SLB |
Oilfield services |
Energy capex and drilling activity |
Global drilling demand, oilfield services, digital operations |
Moderate; exposed to producer capex and regional operational disruptions |
|
LNG |
Natural gas / LNG export |
Lower-volatility gas exposure |
Long-term LNG contracts, export capacity, power demand |
Lower; contracted cash flow reduces spot price volatility |
|
XLE |
Broad energy ETF |
Diversified large-cap energy exposure |
Sector-wide energy performance, integrated majors, dividends |
Low-moderate; diversified but heavily weighted toward oil majors |
|
XOP |
E&P-focused ETF |
Maximum crude price beta |
Oil price rallies, upstream production, E&P earnings |
High; more volatile and sensitive to crude price reversals |
How to Trade Energy Stocks on BingX
BingX offers a crypto-native way to trade leading oil and natural gas stocks without using a traditional brokerage account. The main execution path is through USDT-margined perpetual contracts on BingX TradFi, which allow active traders to go long or short and trade around earnings, OPEC+ decisions, geopolitical headlines, and energy price cycles around the clock.
Trade Energy Stock Futures with USDT on BingX TradFi
For active traders looking to capture short-term momentum or hedge exposure to the energy cycle, BingX TradFi allows users to trade oil, gas, and energy ETF futures with USDT. These USDT-settled perpetual contracts mirror the price movements of the underlying equities, offering flexible long and short exposure without requiring users to hold the physical stock.
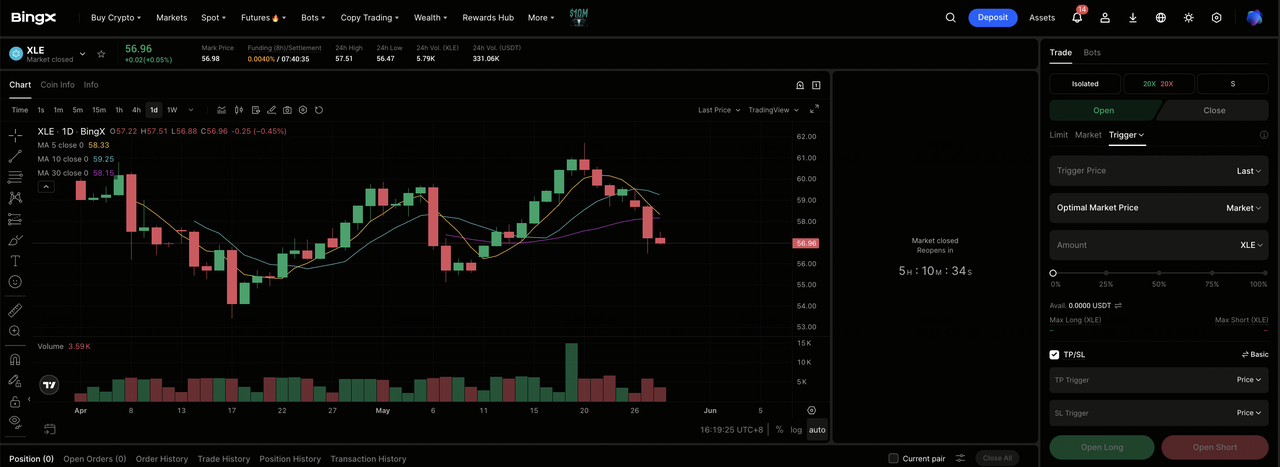
Step 1: Account setup and security. Sign up and log into your BingX account, complete the identity verification (KYC) required in your region, and enable two-factor authentication.
Step 2: Allocate trading capital. Transfer USDT from your spot wallet into your futures account, where it will serve as collateral.
Step 3: Select your contract. Navigate to the TradFi markets page or the futures trading section. Choose from the energy lineup such as XOM-USDT, OXYUS-USDT, COPUS-USDT, SLB-USDT, LNG-USDT, XLE-USDT, or XOP-USDT.
Step 4: Set direction and leverage. Open long if you expect the stock or ETF to rise, or open short if you expect a pullback as crude normalizes. Choose leverage based on your risk plan.
Step 5: Execute and manage risk. Set stop-loss and take-profit orders before submitting the trade. PnL settles dynamically in USDT.
Risks and Core Considerations When Trading Energy Stocks
Energy stocks can offer strong exposure to oil prices, LNG demand, and the broader energy rotation, but they also carry meaningful risks tied to geopolitics, supply policy, commodity volatility, and leverage.
- Geopolitical premium reversal: The 2026 oil rally has been heavily supported by the Strait of Hormuz disruption and U.S.-Iran conflict. Any de-escalation, ceasefire, or diplomatic progress could quickly pull crude prices lower, pressuring oil-weighted names such as OXY, COP, and XOP.
- OPEC+ supply risk: A coordinated production increase from OPEC+ could add supply into a market currently pricing in scarcity. This would compress crude prices and producer earnings, even if geopolitical uncertainty remains elevated.
- Capex and hedging risk: Producers that increased spending during the April oil price spike could face weaker returns if prices normalize. Smaller E&P names are especially exposed if they overinvested or failed to hedge late-2026 production effectively.
- Oil vs. gas divergence: Oil and natural gas respond to different drivers. Oil stocks are more tied to crude prices and geopolitical risk, while LNG and gas-linked names are more exposed to export demand, long-term contracts, and AI-driven power consumption.
- Commodity volatility: Energy equities can move sharply on inventory data, OPEC+ headlines, geopolitical events, or weather-driven demand shifts. Price swings of 5% to 15% are possible, especially in higher-beta producers and E&P-focused ETFs.
- Leverage and liquidation risk: USDT-margined futures amplify both gains and losses. Traders should manage position size carefully, set stop-loss levels before entering, and avoid overleveraging around major policy, inventory, or geopolitical events.
Final Thoughts: Should You Add Oil or Natural Gas to Your Portfolio in 2026?
The choice between oil and natural gas in 2026 depends on which energy thesis investors want to express. Oil stocks such as ExxonMobil, Occidental Petroleum, ConocoPhillips, SLB, and the XOP ETF offer stronger leverage to crude prices and geopolitical risk. They may outperform if oil remains elevated, but they also carry greater downside if the geopolitical premium fades and crude prices normalize.
Natural gas exposure, represented by Cheniere Energy, is more tied to LNG exports, long-term contracts, and rising power demand from AI data centers. It offers a steadier structural growth angle, though with less explosive upside during crude oil spikes. For broader exposure, XLE provides diversified large-cap energy access, while a balanced oil-and-gas approach can combine crude-sensitive names with LNG exposure. For traders using BingX TradFi, conservative position sizing, leverage control, and stop-loss orders remain essential when trading energy stock futures through USDT-margined perpetual contracts.
Related Reading
- Top AI Data Center Stocks to Buy in 2026: Cloud, Servers, and AI Compute Infrastructure
- Top Energy Stocks and ETFs to Buy in 2026: The AI Power Crunch Meets Geopolitical Volatility
- Crude Oil Price Forecast 2026: $140 War Premium or $60 Surplus Baseline?
- Natural Gas Price Prediction 2026: $15 Global Energy Shock or U.S. Glut Trap?
- Heating Oil Price Prediction 2026: $5.00 Geopolitical Spike or $3.00 Supply Glut?
