


In July 2026, JPMorgan Chase & Co. (JPM) delivered a quarter that vindicated its spending. Reporting on July 14, the bank posted net income of $16.9 billion, EPS of $6.14, and a return on tangible common equity of 23%, beating a Street consensus near $5.56. Revenue rose 15% year over year. The stock climbed roughly 1.94% to $341 on the print, a notably muted reaction next to the sector's leaders. Investors remain split: bulls cite an 86% surge in equities revenue and raised net interest income guidance, while skeptics point to expenses climbing 15% alongside revenue and a G-SIB capital surcharge headed to 5.2% by 2028.
The story has shifted from whether the spending works to what it costs. Management raised full-year NII guidance to roughly $105.5 billion from $103 billion, but simultaneously raised the adjusted expense outlook to about $107.5 billion from $105 billion. With CEO Jamie Dimon fielding succession questions on the call and a $20 billion incremental capital requirement looming, JPM enters the second half as the sector's quality benchmark trading at a valuation that has not re-rated. This guide breaks down the JPM stock price prediction for 2026 using data from the Q2 earnings call, Evercore ISI, Bank of America, Keefe Bruyette, and Zacks.
You will also discover how to gain exposure to JPMorgan Chase (JPM) stock futures through BingX TradFi.
Top 5 Things for JPMorgan Investors to Know in July, 2026
- EPS of $6.14 beat the $5.56 consensus: Net income reached $16.9 billion on 23% ROTCE, with revenue up 15% year over year against credit costs of $2.5 billion.
- NII guidance moved up to $105.5 billion: Management raised the full-year target from $103 billion, lifting NII excluding Markets to $96.5 billion from $95 billion on higher deposit balances and rates.
- Equities revenue jumped 86% year over year: Investment banking fees rose 30% alongside it, driving the Corporate & Investment Bank to $9.7 billion of earnings on $24.9 billion of revenue, up 27%.
- Expenses climbed to a $107.5 billion outlook: The bank booked $1.5 billion against first-half capital markets outperformance, with roughly $1 billion more implied for the second half.
- The dividend rises to $1.65 per share in Q3: The expected card net charge-off rate was lowered to roughly 3.2% from 3.4%, easing the credit overhang.
What Is JPMorgan Chase & Co. (JPM)?
JPMorgan Chase & Co. is the largest bank in the United States by assets and a Global Systemically Important Bank (G-SIB). Operating through four primary segments, Consumer & Community Banking, Commercial & Investment Bank, Asset & Wealth Management, and Corporate, it serves as the ultimate flight-to-quality asset in US financials.
Under the leadership of Jamie Dimon, JPM has maintained a fortress balance sheet with a CET1 capital ratio of 14.3% as of the prior quarter. Its competitive moat is built on unmatched scale, allowing it to outspend rivals on innovation while sustaining a 23% return on tangible common equity.
The bank carries a market capitalization near $896 billion and trades at a P/E near 16x, with trailing twelve-month revenue above $173 billion and a profit margin around 33.9%. Asset & Wealth Management delivered $2 billion of net income at a 38% pretax margin in Q2, driven by growth in management fees and strong net inflows, evidence that the fee side is compounding alongside the lending franchise. With a dividend rising to $1.65 quarterly and 15 consecutive years of increases, JPM continues to trade as a premium fortress asset capable of outperforming the broader financial sector during periods of economic volatility.
JPMorgan’s 2026 Strategy: The Scale Compounder
- AI investing agents beat a 60/40 portfolio in simulations: The margin ran roughly 0.7 percentage points annually with lower volatility, moving AI from pilot to product inside the bank.
- A new small-cap M&A team targets $100 million to $500 million deals: The move extends advisory coverage into the middle market ahead of a baby-boomer business succession wave.
- Capital planning now assumes a 5.2% G-SIB surcharge by 2028: Up from 4.5%, the requirement implies roughly $20 billion of incremental capital that competes directly with buybacks and dividends.
- Deposit growth, not rates alone, drove the NII revision: Gains came across both wholesale and consumer channels plus favorable mix shifts, a more durable driver than a pure rate bet.
JPM Stock 2026 Investment Outlook: $408 Alpha vs. $295 Execution Risk
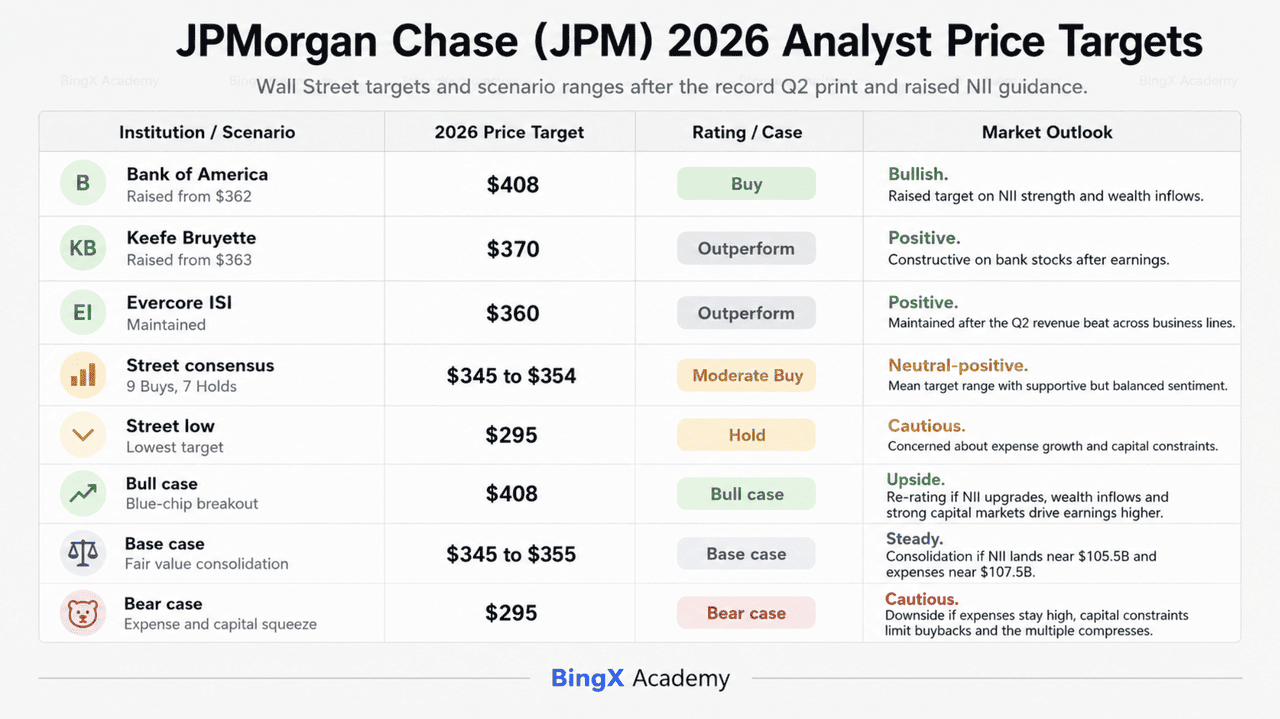
The second half outlook for JPM is a battle between industry-leading earnings power and a market that has been unwilling to pay more for it, with the stock up only modestly year to date despite consistent beats.
The Bull Case: JPM's $408 Blue-Chip Breakout
The bullish narrative centers on a re-rating that the Q2 print should have triggered and did not. Bank of America's Ebrahim Poonawala raised his target to $408 from $362 ahead of earnings on the thesis that stronger net interest income and wealth management inflows would drive earnings upgrades through the second half of 2026 and into fiscal 2027. The Q2 result delivered exactly that, with NII guidance raised and AWM inflows strong.
To hit $408, JPMorgan must convert the expense build into visible operating leverage. The bank booked $1.5 billion of additional first-half expenses tied directly to capital markets outperformance, which is the good kind of cost. If the equities franchise sustains anything close to its 86% growth pace and investment banking fees hold near the 30% increase, revenue growth outruns the $107.5 billion expense outlook and the 16x multiple looks conservative for a business earning 23% ROTCE. A lower card charge-off outlook of 3.2% removes the credit overhang that bears have leaned on since 2024.
The Base Case: JPMorgan's $345 to $355 Fair Value Consolidation
The base case positions JPMorgan as the ultimate compounder trading in line with a mean analyst target in the $345 to $354 range, roughly 2% to 5% above the post-earnings price. This outlook assumes NII lands near the raised $105.5 billion guidance while expenses land near $107.5 billion, producing solid but unspectacular operating leverage. Evercore ISI maintained its $360 target and Outperform rating after the report, noting the revenue beat came across multiple business lines even as net interest income and FICC trading missed internal expectations.
Technically, the stock enters a period of high-floor consolidation above trendline support near $332.72, with $338.45 as the breakout trigger it has now cleared. For investors, this scenario offers a reliable dividend rising to $1.65 quarterly, steady price appreciation, and scale that serves as a protective moat against minor macro headwinds. It is a steady-as-she-goes narrative where the G-SIB capital build caps how much of the earnings can be returned rather than how much is earned.
The Bear Case: JPM Stock at $295 Amid Expense and Capital Squeeze
The bear case does not require a credit collapse. It requires the market to keep refusing to pay up. JPM gained only about 4% year to date heading into the print and rose under 2% on a clear beat, a reaction that says the incremental buyer is already priced in. The lowest target on the Street sits at $295, roughly 10% below current levels.
Two mechanisms drive that outcome. First, expenses are growing at the same 15% pace as revenue, meaning the operating leverage thesis rests entirely on capital markets staying hot. If equities revenue normalizes from an 86% growth rate, the $107.5 billion cost base does not normalize with it. Second, the G-SIB surcharge moving to 5.2% by 2028 absorbs roughly $20 billion of capital that would otherwise fund buybacks, structurally lowering the EPS growth rate regardless of operating performance. Add unresolved succession questions around Dimon's transition, and the premium multiple has a clear path to compression toward the low $300s and the $295 floor.
JPMorgan Stock Price Forecasts for 2026 By Wall Street Analysts
|
Institution |
2026 Price Target |
Market Outlook |
|
Bank of America |
$408 |
Buy: Raised from $362 on NII strength and wealth inflows. |
|
Keefe Bruyette |
$370 |
Outperform: Raised from $363, constructive on bank stocks. |
|
Evercore ISI |
$360 |
Outperform: Maintained after the Q2 revenue beat across business lines. |
|
Street Consensus |
$345 to $354 |
Moderate Buy: Nine Buys and seven Holds in the last three months. |
|
Street Low |
$295 |
Hold: Concerned about expense growth and capital constraints. |
How to Trade JPMorgan (JPM) Stock on BingX
Navigate the volatility of JPMorgan's earnings cycle using BingX TradFi and BingX AI tools. By leveraging AI-driven predictive analytics, you can better anticipate market sentiment shifts and price action around quarterly releases.
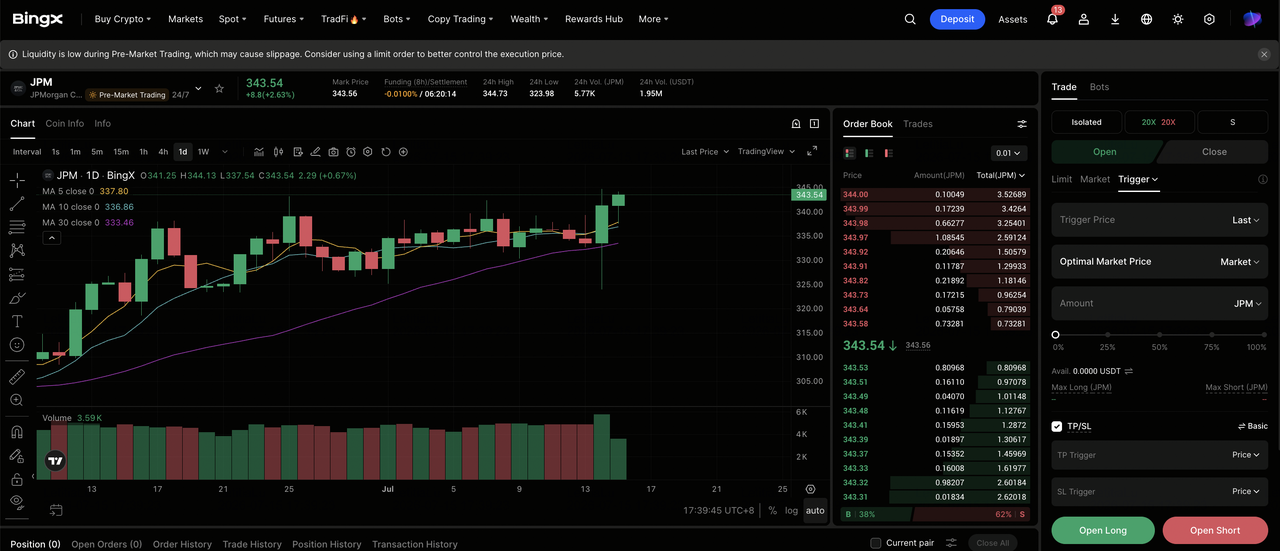
Step 1: Access BingX TradFi. Sign up and navigate to the specialized TradFi section on the main BingX exchange dashboard.
Step 2: Select JPMorgan Chase & Co. (JPM). Search for and select the JPM-USDT perpetual futures contract.
Step 3: Choose your direction. Select Open Long if you expect net interest income to track toward the raised guidance, expense growth to decelerate, and the earnings upgrade cycle to force a re-rating. Select Open Short if you expect capital markets revenue to normalize, the expense base to stay elevated, or the G-SIB capital build to keep capping shareholder returns.
Step 4: Select leverage and margin mode. Choose Isolated or Cross-Margin based on your risk tolerance. Because JPM has traded in a narrow band around trendline support despite consistent earnings beats, conservative leverage and clear position sizing are important.
Step 5: Execute strict risk protocols. Set Take-Profit and Stop-Loss (TP/SL) levels before or immediately after entering the trade. JPM can react quickly to quarterly earnings, NII guidance revisions, Federal Reserve rate decisions, Basel III and G-SIB capital updates, and CEO succession headlines.
Top 5 Risks to Watch for JPM Investors in 2026
To successfully navigate the 2026 market, investors must balance JPMorgan’s tech-driven dominance against these five critical macro and operational headwinds.
- Dimon's departure timing remains unresolved: He told the Q2 call the schedule is unchanged and ultimately up to the Board, keeping multiple-compression risk live until a successor is named.
- The G-SIB surcharge rises to 5.2% by 2028 from 4.5%: The change implies roughly $20 billion of incremental capital, directly constraining buyback and dividend capacity even in strong earnings years.
- Adjusted expenses guided up to $107.5 billion: Roughly $1 billion was implicitly added for the second half, and costs tied to capital markets outperformance do not automatically reverse when revenue normalizes.
- An 86% equities gain sets a base that is difficult to lap: Investment banking fees up 30% compound the problem, so any cooling of the deal and trading cycle hits the segment that carried the quarter.
- The raised NII target assumes deposit growth and rates hold: A Federal Reserve shift or renewed inflation pressure would test both the lending spread and the improved 3.2% card charge-off outlook.
Final Thoughts: Should You Invest in JPMorgan (JPM) Stock in 2026?
JPMorgan Chase after the July 14 report is a bank executing close to flawlessly for a market that has already decided what it will pay. Net income of $16.9 billion, 23% ROTCE, raised NII guidance, a lowered charge-off outlook, and a dividend increase constitute an unambiguously strong quarter. The stock's sub-2% response is the entire investment debate in a single data point.
The bull case, expressed by Bank of America's $408 target, is that earnings upgrades through the second half and into 2027 force the re-rating that the Q2 print alone did not. The bear case is that a $107.5 billion expense base and a $20 billion capital build cap what shareholders actually receive from record earnings. Practically, JPM remains a core flight-to-quality holding for investors prioritizing scale and defensive stability. Those seeking alpha should watch whether NII tracks toward the raised $105.5 billion target while expense growth decelerates, and more conservative traders may prefer to monitor the $332 support region before initiating long-term positions.
Risk Reminder: TTrading and investing in equities like JPM involves a significant risk of capital loss. The bank's performance is highly sensitive to Federal Reserve interest rate pivots, global energy prices, and evolving regulatory capital requirements. Historical performance is not indicative of future results; always conduct independent due diligence or consult a financial advisor before allocating capital.
Related Reading
- Goldman Sachs (GS) Price Prediction 2026: Strategic Renaissance or Value Trap at $860?
- Apple (AAPL) Stock Outlook for 2026: MacBook Neo Growth or AI Valuation Trap?
- Morgan Stanley (MS) Price Prediction 2026: Investment Bank Resurgence or $170 Correction?
- Accenture (ACN) Outlook 2026: Can AI Transformation and Consulting Demand Drive ACN Stock to $450+?
- Alphabet (GOOGL) Stock Outlook 2026: Can Gemini and Google Cloud AI Drive GOOGL Cross $420?
