
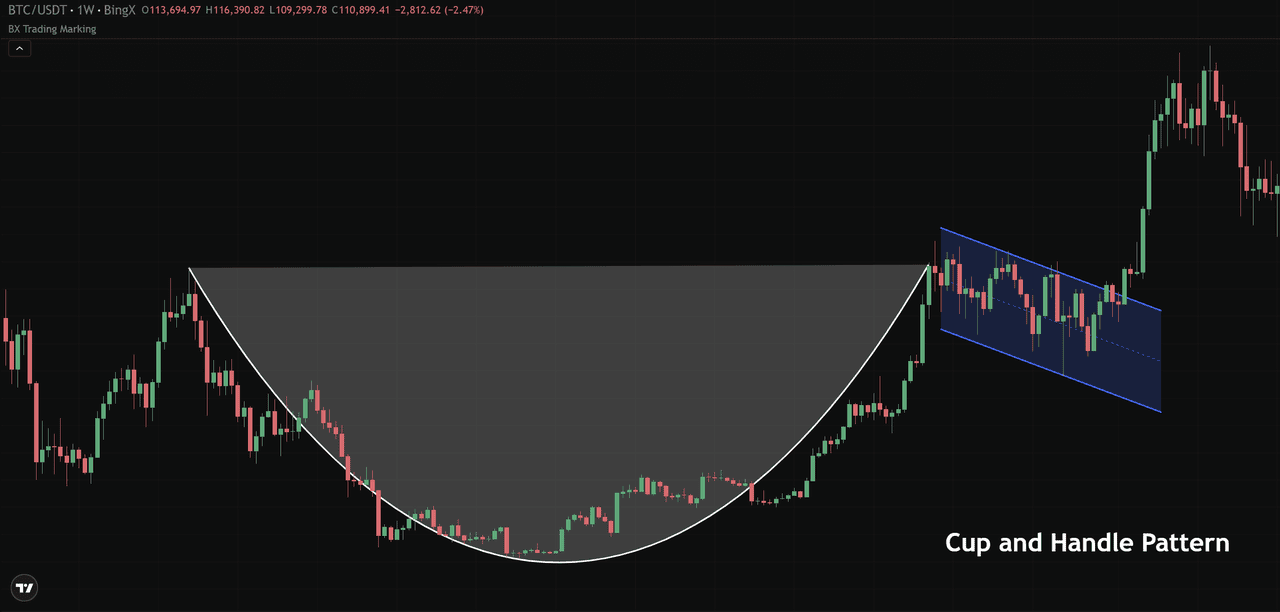
The cup and handle pattern in crypto trading is a classic bullish continuation pattern that helps traders identify potential breakout points before prices surge. It forms when the market builds a rounded cup, reflecting fading selling pressure, followed by a short handle formation signaling consolidation before the next move higher. When price breaks above the handle’s resistance, it often confirms renewed momentum and trend continuation.
On BingX price charts, traders use this technical analysis pattern across daily and intraday charts to identify early entry opportunities, set clear price targets, and manage risk effectively. Mastering the cup and handle gives traders an edge in reading market sentiment and capitalizing on bullish breakouts.
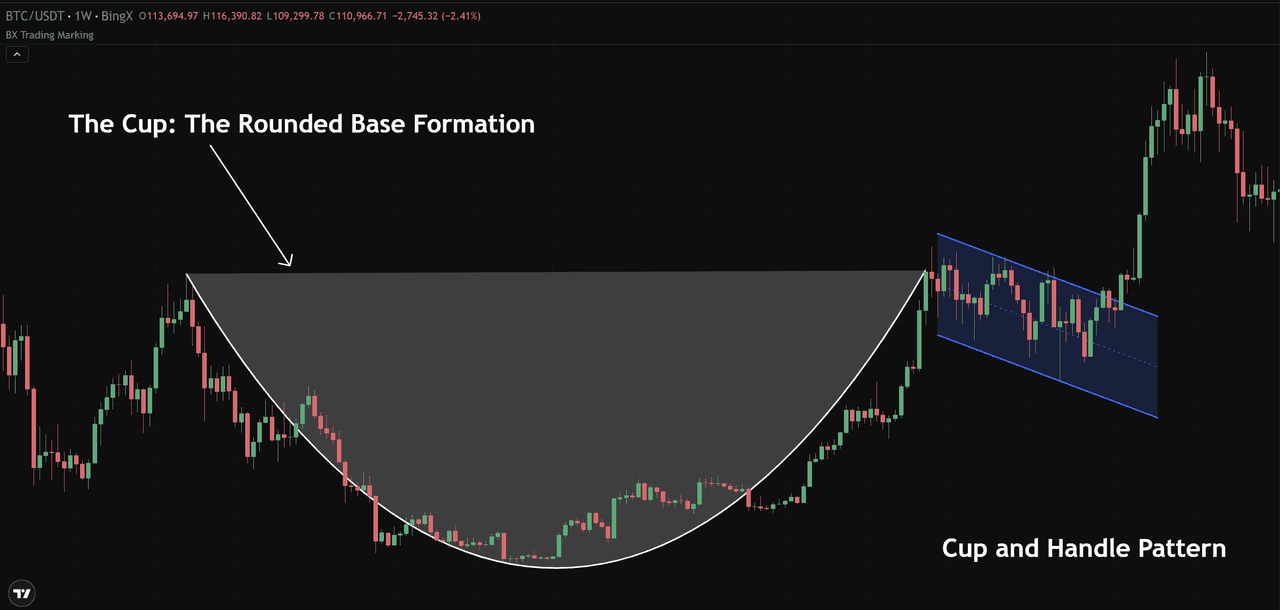
The Cup: The Rounded Base Formation
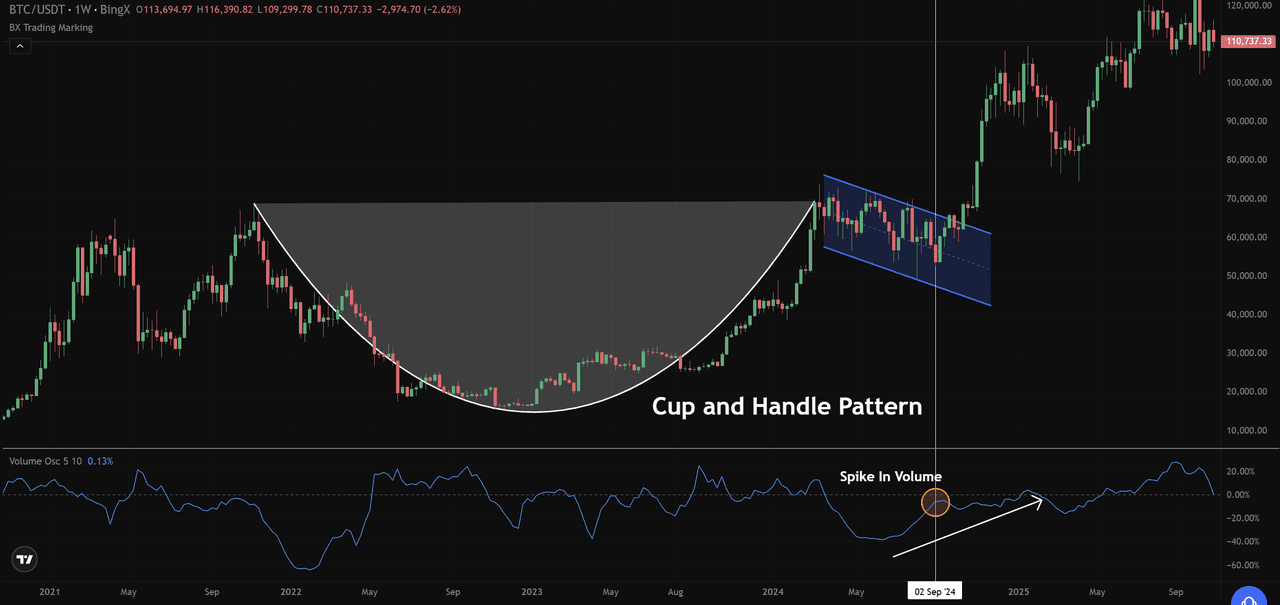
The cup is the foundation of the pattern, forming when a crypto asset’s price gradually declines, finds support, and rises again, creating a smooth U-shaped curve. This rounded base marks a shift from weakness to strength, as selling pressure fades and buyers regain control.
Bitcoin (BTC/USD) Weekly Price Chart - Source: BingX
In a typical setup, the cup’s depth represents the extent of correction from the prior trend. A deep cup shows a stronger shakeout before recovery, while a shallow cup signals steady accumulation. The cup’s rim acts as key resistance where price often pauses before forming the handle.
Bitcoin (BTC/USD) Weekly Price Chart - Source: BingX
For example, on a BTC/USDT daily or weekly chart, traders often see this rounded bottom develop after a pullback during an uptrend, with volume increasing along the right rim, a clear sign of returning confidence.
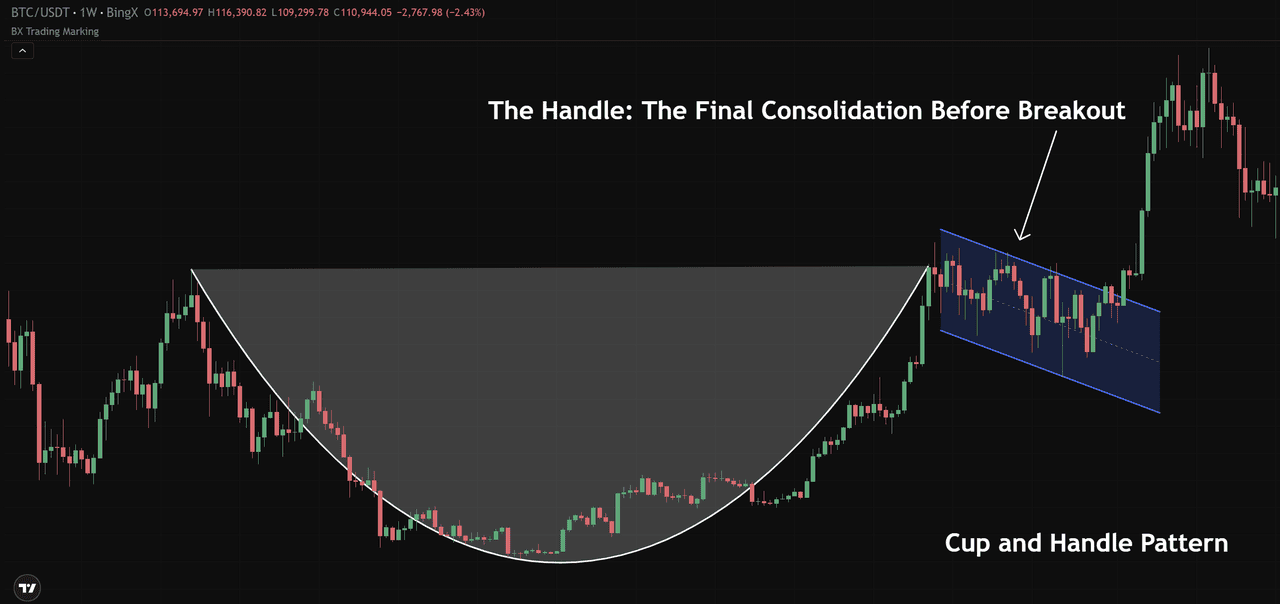
The Handle: The Final Consolidation Before Breakout
The handle formation appears after the cup’s rim, as price slightly pulls back from the prior high before resuming its uptrend. This handle is typically short and shallow, not exceeding one-third of the cup’s depth, indicating limited selling pressure and strong buyer interest.
Bitcoin (BTC/USD) Weekly Price Chart - Source: BingX
The upper boundary becomes the handle’s resistance, forming a flat resistance line that traders watch for a breakout. A valid breakout should be supported by rising trading volume; weak momentum often leads to false breakouts. When confirmed, the handle formation completes the pattern, signaling renewed bullish momentum and trend continuation.
How to Identify a Cup and Handle on Crypto Charts
Spotting the pattern requires attention to price action and trading volume. On BingX, start by identifying a prior uptrend, since this is a bullish continuation setup.
• Look for a cup’s rounded bottom, a gradual drop followed by recovery forming a U-shape.
• Watch for increasing volume along the right rim, showing renewed demand.
Bitcoin (BTC/USD) Weekly Price Chart - Source: BingX
In Bitcoin’s case, the BTC/USDT weekly chart shows a decline from around $69,000 (2021) to a low near $15,500 (2022), creating the cup base. The rim near $70,000–$72,000 and a descending handle formed next, before a volume spike in September 2024 confirmed the breakout above $72,000, leading to a rally toward $100,000.
Measuring the Breakout and Setting Targets
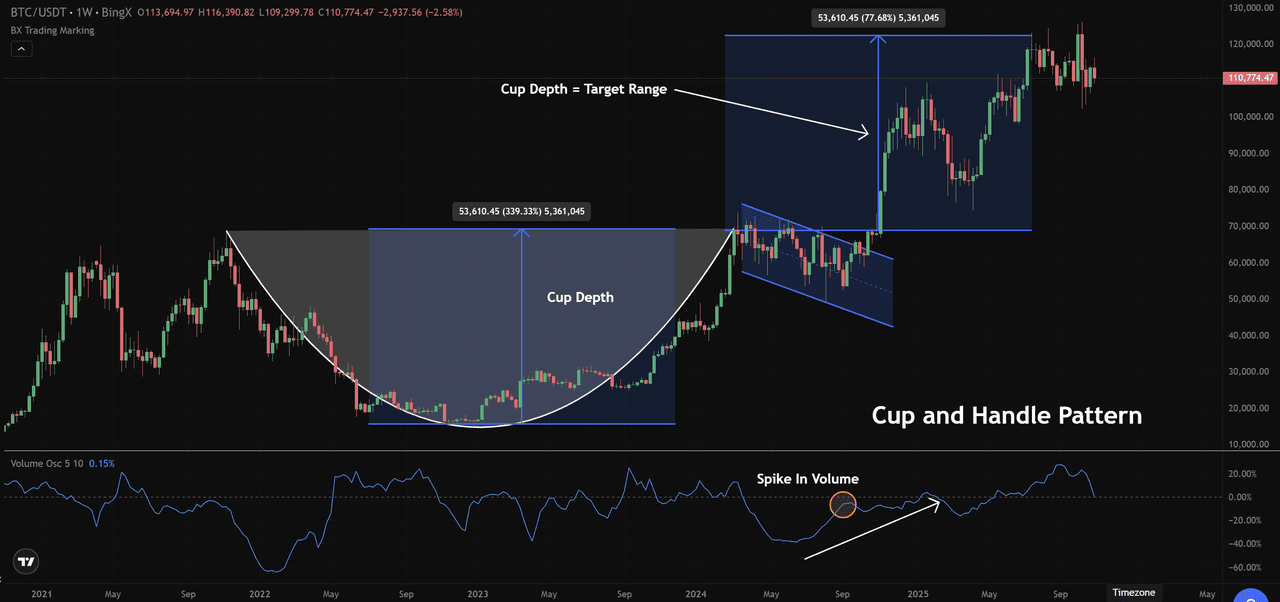
Traders estimate breakout potential using the cup depth:
• Step 1: Measure the cup depth (bottom to rim).
• Step 2: Project this distance upward from the breakout point.
• Step 3: Confirm momentum with rising volume.
• Step 4: Aggressive traders may enter near the handle’s resistance, while conservative traders wait for confirmation.
Bitcoin (BTC/USD) Weekly Price Chart - Source: BingX
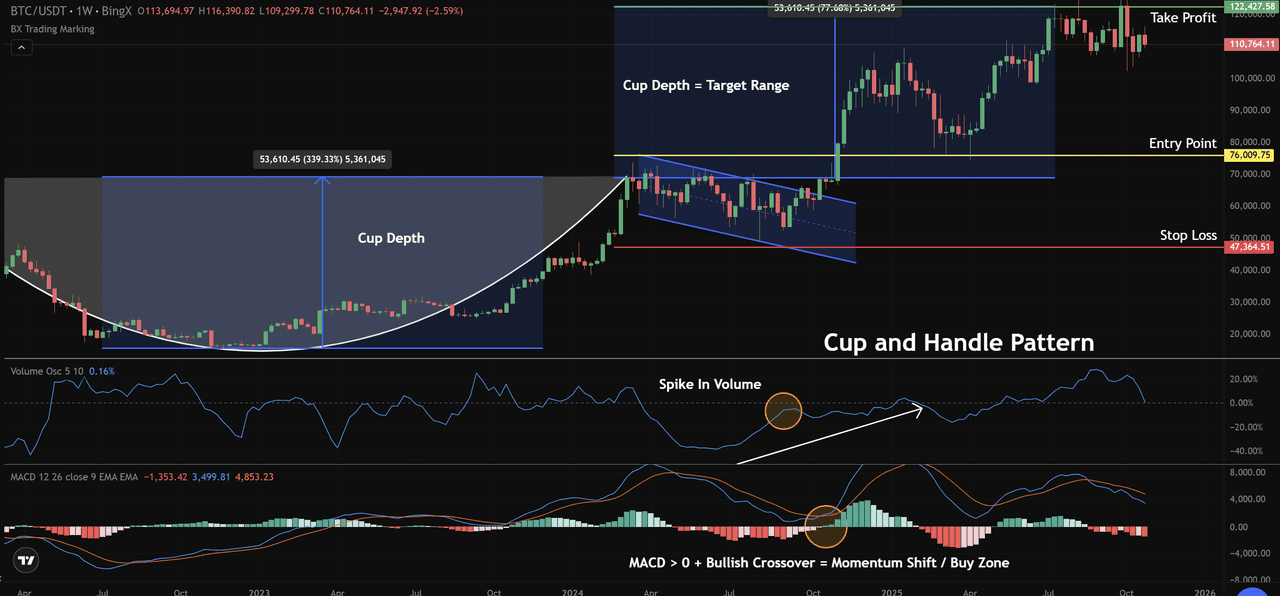
On BingX, the BTC/USDT weekly chart showed a breakout above $76,000, with a cup depth of $53,000, projecting a target near $122,000, a move confirmed by a clear volume spike.
Note for traders: Cup and handle patterns vary. A deep cup indicates a stronger base but slower recovery, while a shallow cup suggests steady accumulation and faster breakouts.
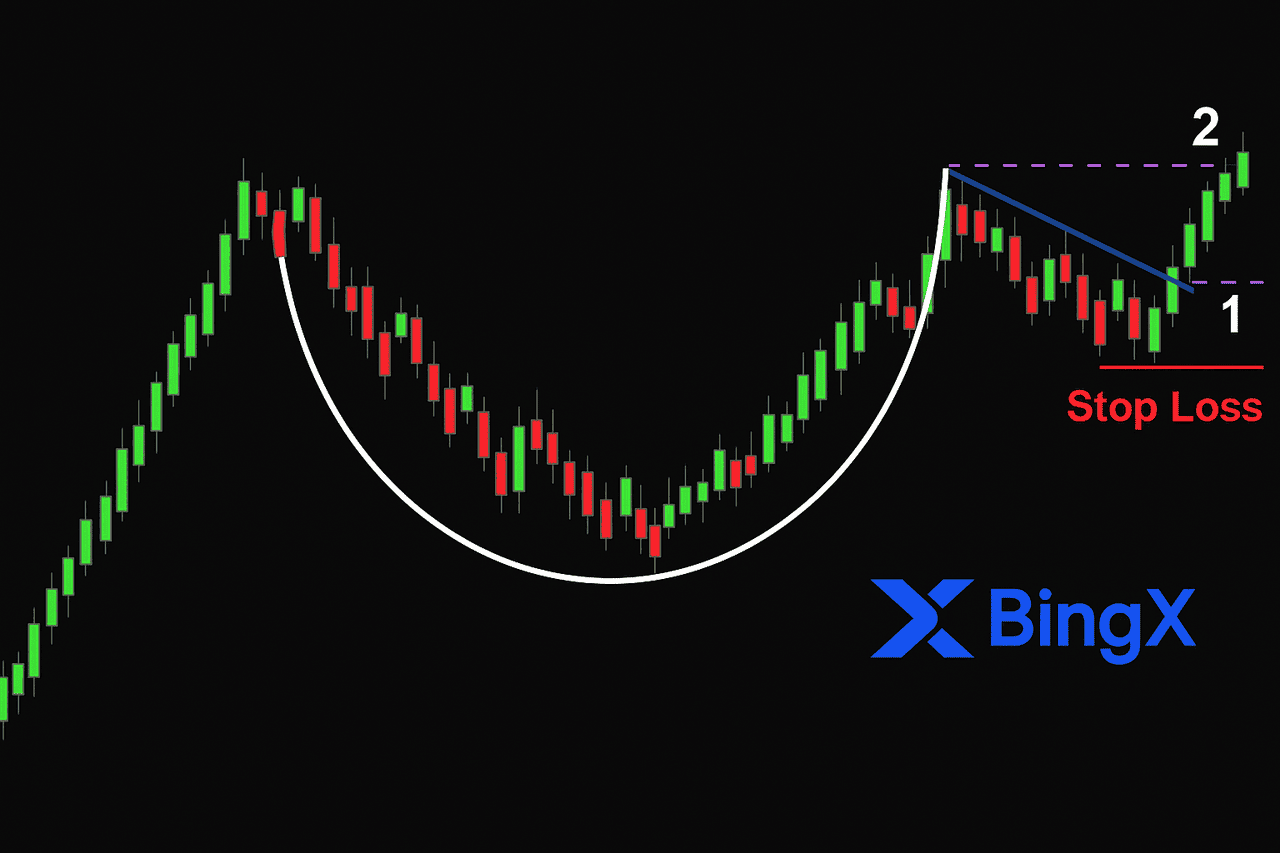
How to Trade the Cup and Handle Pattern
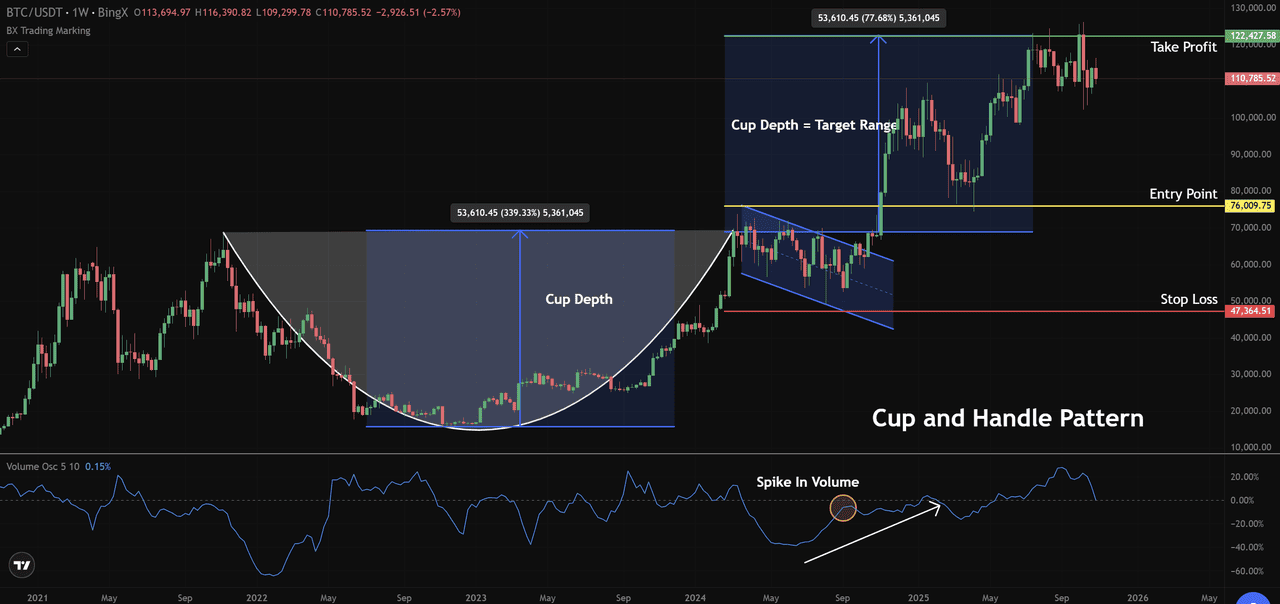
Continuing the BTC/USDT example on BingX, trading this setup comes down to three key levels:
• Entry Point: Wait for price to break above the cup’s rim with a noticeable volume spike. This confirms strong buying pressure and reduces the risk of false signals. In this case, the breakout occurred around $76,000.
• Stop-Loss: To manage risk, place the stop-loss just below the handle’s low, near $47,000 in Bitcoin’s setup. This level protects against sudden reversals or failed breakouts.
• Take-Profit: Use the cup depth to project your target range from the breakout level. With a cup depth of roughly $53,000, the take-profit zone sits around $122,000, aligning with Bitcoin’s next resistance area.
Bitcoin (BTC/USD) Weekly Price Chart - Source: BingX
This method helps traders balance entry timing, risk management, and target accuracy, capturing bullish continuation trades with confidence.
Using Technical Indicators for Confirmation
Before entering a trade, it’s crucial to confirm the pattern’s strength using technical indicators that validate momentum and filter out false breakouts.
RSI Confirmation
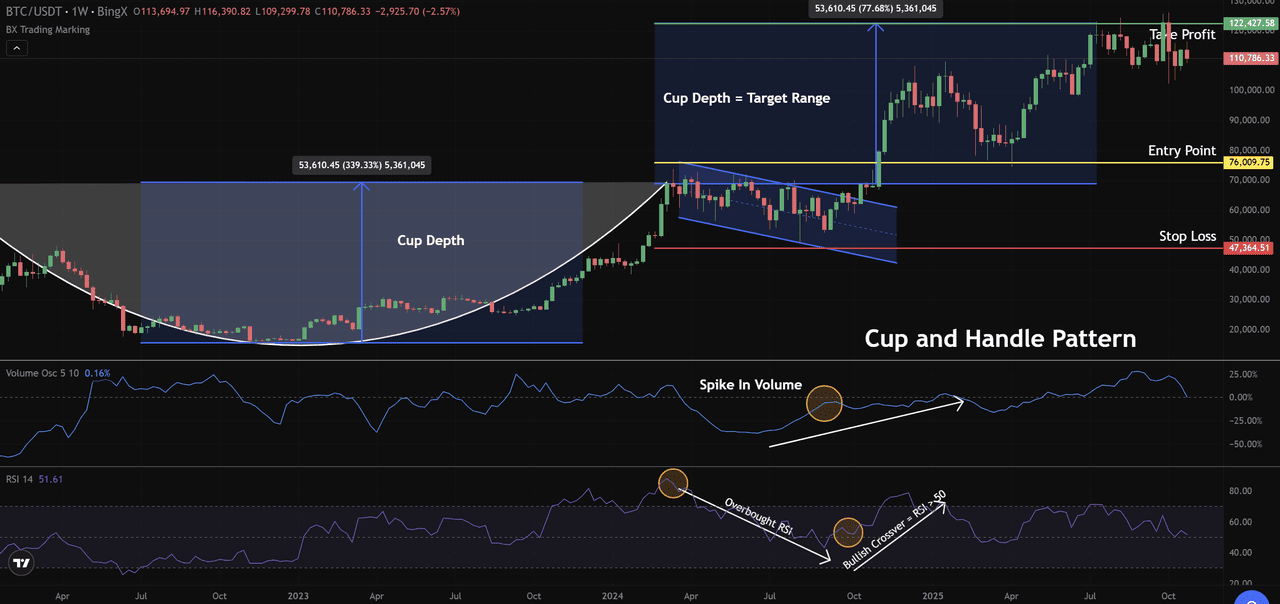
The Relative Strength Index (RSI) is a key momentum tool for confirming cup and handle breakouts. Traders look for the RSI to rise above 50 as price approaches the breakout level near $76,000, signaling renewed buying pressure.
A steady climb in RSI indicates strengthening momentum, while readings above 70 warn that the market is overbought and may face short-term pullbacks.
Bitcoin (BTC/USD) Weekly Price Chart - Source: BingX
In the BTC/USDT weekly chart on BingX, the RSI bullish crossover above 50 and a simultaneous spike in trading volume confirmed strong momentum before Bitcoin’s rally from $76,000 to $122,000, validating the pattern’s breakout strength.
MACD and Volume Patterns
Watch for a Moving Average Convergence Divergence (MACD) bullish crossover with the MACD line crossing above the signal line, supported by green histograms above 0. This confirms rising momentum. Combine this signal with a volume spike to validate the breakout’s strength and avoid false signals.
Bitcoin (BTC/USD) Weekly Price Chart - Source: BingX
In the BTC/USDT weekly chart on BingX, a clear MACD > 0 crossover and strong trading volume around $76,000 marked a confirmed momentum shift and reliable buy zone before the rally toward $122,000.
Conclusion: A Reliable Pattern with the Right Context
The cup and handle remains one of the most trusted bullish continuation patterns when supported by strong volume and trend alignment. Combine it with RSI and MACD to confirm signals and manage risk with defined stop-loss and take-profit levels.
Explore live crypto charts on BingX to test this strategy using advanced indicators, intuitive charting tools, and one-click execution for smarter, faster trading decisions.
Related Reading
FAQs
1. What is the cup and handle pattern in crypto trading?
The cup and handle pattern is a bullish continuation formation that appears when price forms a rounded “cup” followed by a small “handle.” It signals a potential breakout and continuation of the existing uptrend once price moves above the handle’s resistance.
2. How do traders identify a cup and handle on crypto charts?
Traders look for a U-shaped recovery after a downtrend, followed by a short consolidation (the handle). A breakout with strong trading volume above the cup’s rim confirms the pattern.
3. What does the cup’s depth indicate?
The cup’s depth measures how far price corrected before recovery. A deep cup often shows stronger accumulation but slower recovery, while a shallow cup signals steady buying and faster breakout potential.
4. How can traders use the cup and handle to set price targets?
Measure the cup’s depth and project it upward from the breakout point to estimate the target range. Traders also watch for volume confirmation to validate momentum before entering a trade.
5. What indicators confirm the cup and handle breakout?
Key confirmation tools include RSI, MACD, and trading volume. RSI rising above 50, MACD crossing above zero, and a volume spike together strengthens the breakout signal.
6. Is the inverted cup and handle pattern bullish or bearish?
The inverted cup and handle is the opposite setup — a bearish reversal pattern. It forms when price peaks, consolidates, and breaks downward, suggesting trend reversal and potential downside.
