Join the Trading Community: Learn & Earn with BingX.
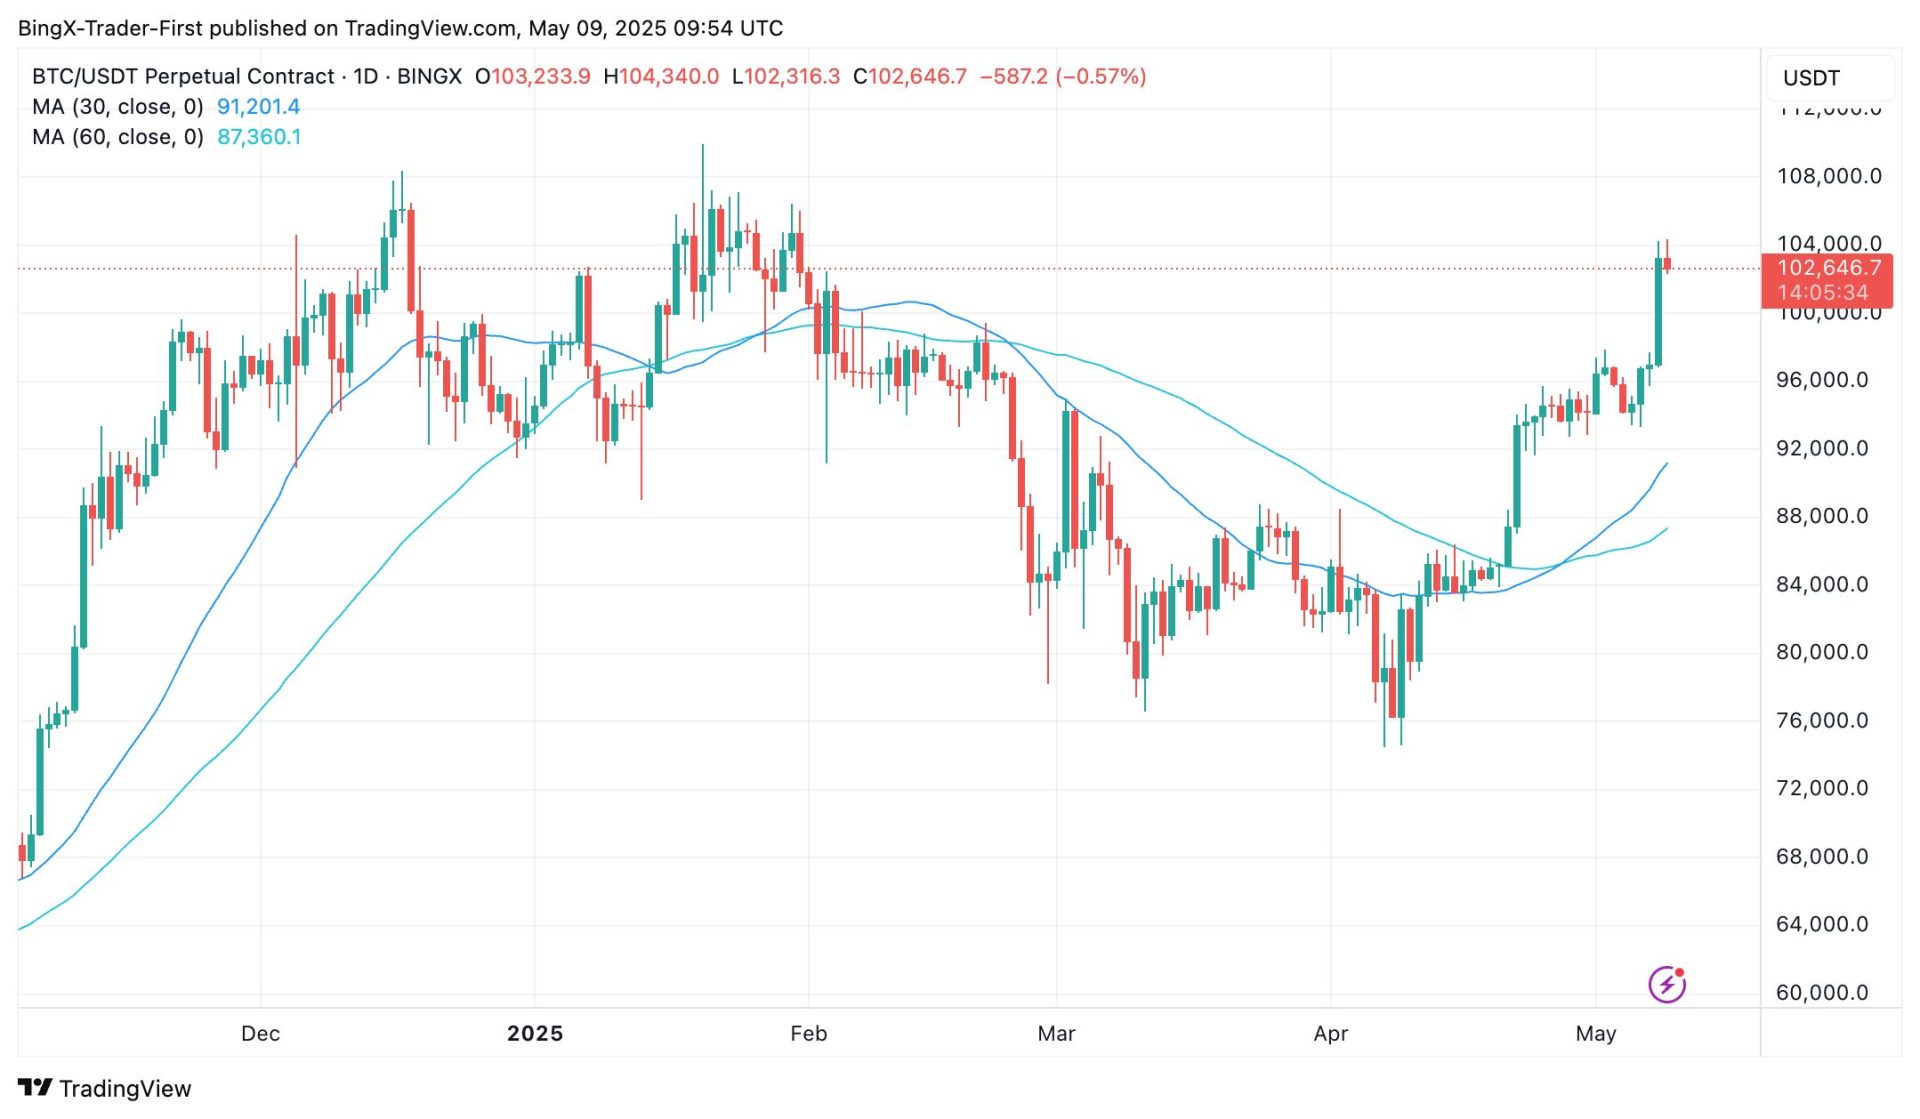
Source: TradingView & BingX
The 4-hour chart for BTC/USD shows Bitcoin trading at $102,169, reflecting a strong upward move of 6.29% from recent levels. The price has surged past the previous resistance at $97,956, reaching a new high of $102,169, supported by a breakout above the 30-period moving average at $91,543.2 and the 60-period moving average at $87,123.5. The candlestick patterns display consistent bullish momentum, with a series of strong bullish candles driving the rally, accompanied by a spike in volume, indicating robust buying interest. The RSI on the 4-hour chart is at 72.45, signaling overbought conditions, while the MACD shows a strong bullish trend, though the rapid ascent suggests a potential for a short-term pullback.
On the 1-day chart, Bitcoin’s broader trend remains firmly bullish, with the price climbing from $58,846 in late 2024 to the current $102,169, confirming a breakout above the psychological $100,000 level. The daily chart shows the price pushing beyond the upper boundary of a long-term ascending channel, with $97,956 now acting as a support level after the breakout. The 200-period moving average at $92,123.45 continues to trend upward, reinforcing the bullish structure, and the recent rally has been backed by high volume, reflecting strong market participation. However, the RSI on the daily chart is at 78.56, deep in overbought territory, and the MACD, while bullish, shows early signs of divergence, suggesting that momentum may be overstretched.
From a technical perspective, Bitcoin’s current levels on both timeframes indicate a powerful rally but with signs of caution. On the 4-hour chart, the overbought RSI and strong MACD suggest the price may face resistance around $103,000, with a potential pullback to test support at $97,956 if profit-taking occurs. On the 1-day chart, the breakout above $100,000 and the channel’s upper boundary is a bullish signal, but the high RSI and MACD divergence warn of a possible correction, with support near $97,956 or the 200-period moving average at $92,123. A sustained move above $103,000 could target $108,000, while a drop below $97,956 might signal a deeper pullback.
Disclaimer: BingX does not endorse and is not responsible for or liable for any content, accuracy, quality, advertising, products, or other materials on this page. Readers should do their own research before taking any actions related to the company. BingX is not responsible, directly or indirectly, for any damage or loss caused or alleged to be caused by or in connection with the use of or reliance on any content, goods, or services mentioned in the article.
