Join the Trading Community: Learn & Earn with BingX.
Source: TradingView & BingX
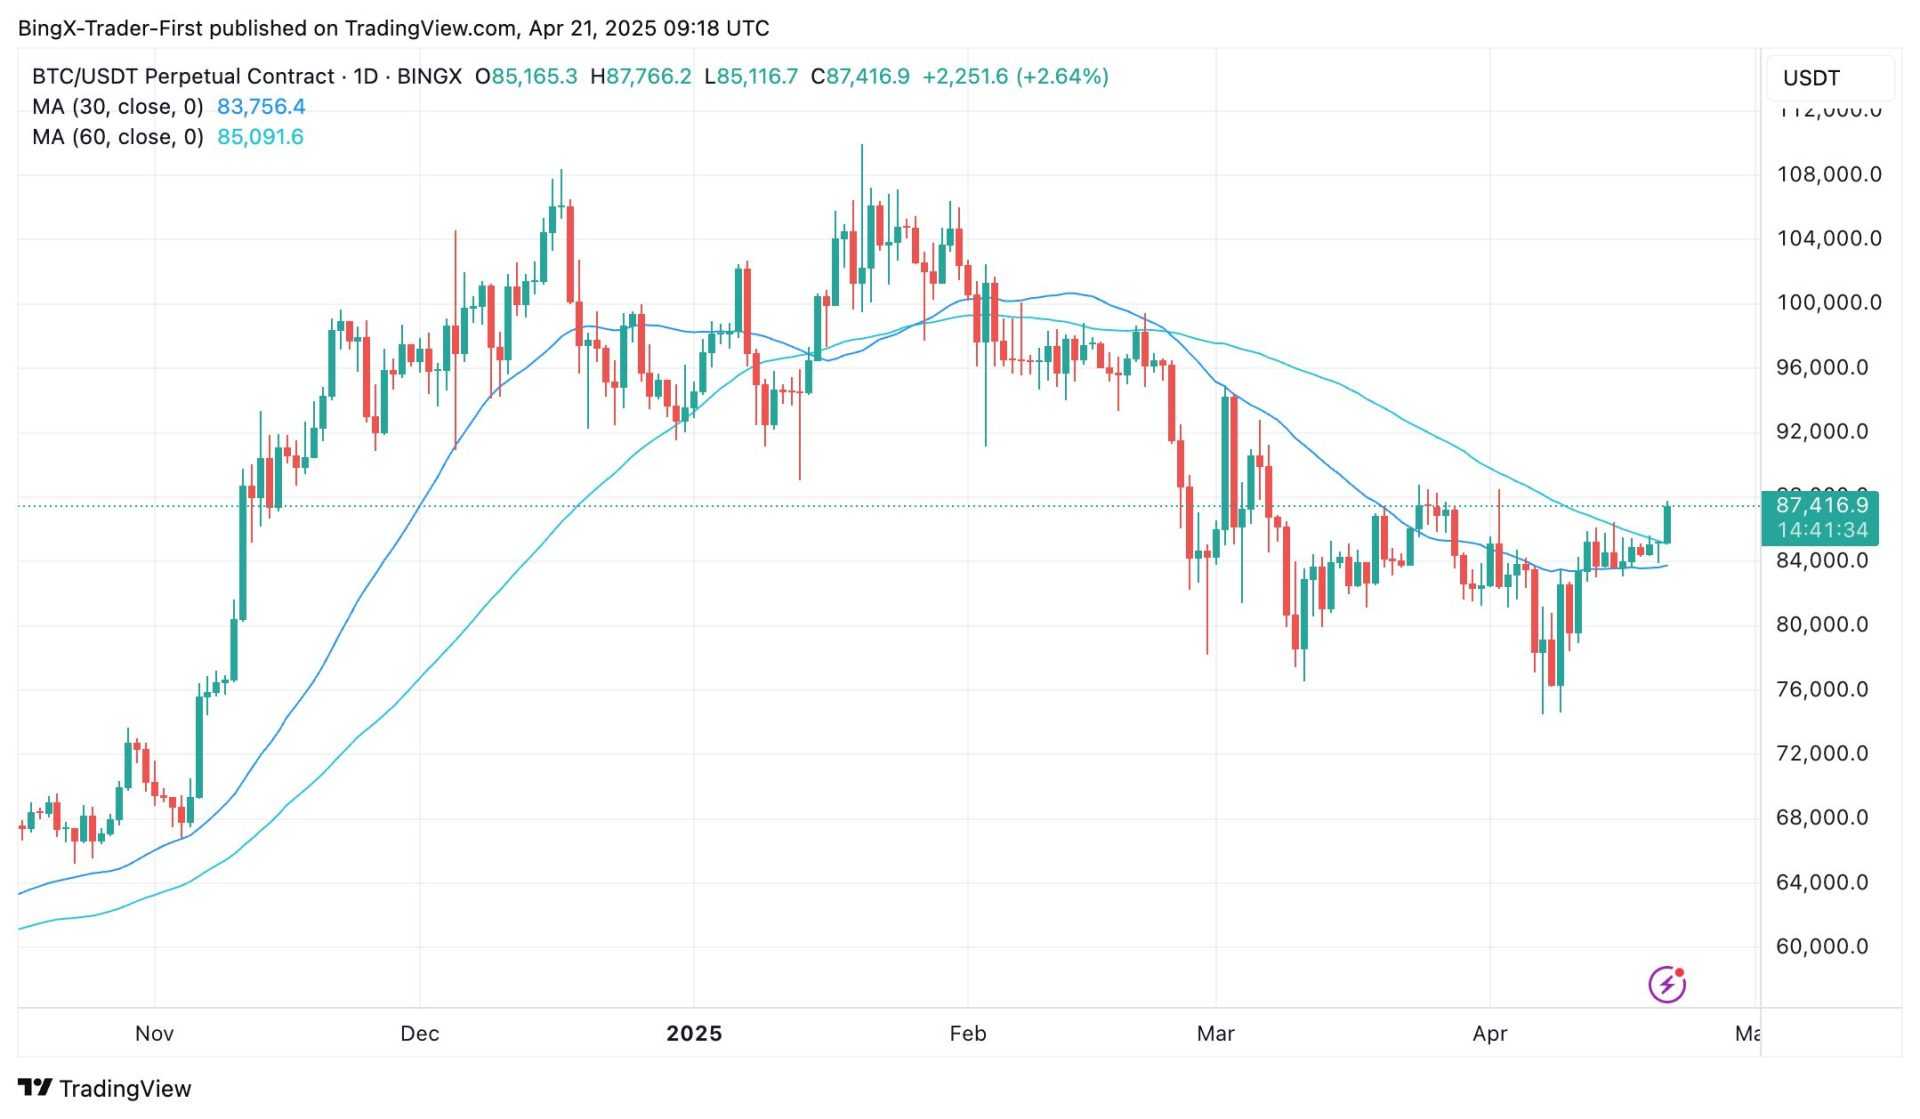
The 4-hour chart of BTC/USDT on April 21, 2025, shows Bitcoin experiencing a significant surge over the past day. Starting at $83,949.50 on April 20, the price has risen sharply to a real-time value of $87,415, marking a 3.62% increase within the last 24 hours. This upward movement follows a consolidation phase between $80,000 and $84,000, with the price breaking above the recent high of $83,949.50 and reaching $87,738.00 before a slight pullback. From a 1-day perspective, this rally suggests a potential resumption of bullish momentum, as Bitcoin moves closer to the 200-day moving average of $87,929.93, indicating a possible shift in the broader trend after weeks of correction.
Technical indicators on the 4-hour chart support the bullish momentum. The MACD (12,26,9) shows a value of -520.30, a DEA of -424.40, and a histogram at -423.57, indicating that while the trend has been bearish, the gap is narrowing, hinting at a potential bullish crossover if the rally continues. The RSI (14) at 64.33 is approaching overbought territory, reflecting strong buying pressure, while the KDJ (K: 77.29, D: 54.39) is in bullish territory, supporting the upward momentum. The volume spiked to 409.57K during the rally to $87,738.00, indicating significant buying interest; however, it has since decreased to 14.66K, suggesting a possible pause in the surge. On the 1-day chart, the price’s approach to the 200-day moving average at $87,929.93 is a critical level, and a sustained break above this could confirm a bullish trend reversal.
Looking ahead, Bitcoin’s short-term outlook appears bullish but with caution. On the 4-hour chart, the current price of $87,415 is testing resistance around $87,738.00, and a break above this level could lead to a push toward $90,000. However, the RSI nearing overbought levels suggests a potential pullback, with support at $85,000 and $83,949.50 if selling pressure emerges. On the 1-day chart, a sustained move above the 200-day moving average at $87,929.93 would confirm a bullish trend, targeting $92,000, while a failure to hold above $85,000 could see a retest of $80,000. Traders should watch for $87,929.93 as a key resistance and $85,000 as immediate support in the near term.
Disclaimer: BingX does not endorse and is not responsible for or liable for any content, accuracy, quality, advertising, products, or other materials on this page. Readers should do their own research before taking any actions related to the company. BingX is not responsible, directly or indirectly, for any damage or loss caused or alleged to be caused by or in connection with the use of or reliance on any content, goods, or services mentioned in the article.
