
Bitcoin’s Christmas Day price offers a surprisingly clear snapshot of its long-term evolution. In 2009, Bitcoin traded near $0.003, reflecting little more than the electricity cost required to mine it. There was no formal market, no liquidity, and virtually no awareness beyond a small group of cryptography enthusiasts.
Fast forward to Christmas 2025, and Bitcoin is trading near $87,000, with a market capitalization approaching $2 tn. The asset now sits alongside the world’s largest financial instruments, shaped by institutional capital, global liquidity cycles, and macroeconomic narratives.
What makes Christmas pricing particularly revealing is timing. Holiday trading typically occurs under lower liquidity and reduced speculative activity, allowing longer-term positioning to stand out. Over time, these snapshots have highlighted Bitcoin’s steady structural growth despite sharp volatility between market cycles.
Bitcoin’s Journey: From Early Experiments to an Institutional Asset
Born in the aftermath of the 2008 global financial crisis, Bitcoin began as a small-scale experiment in decentralized money. Over time, its four-year halving cycle, which periodically reduces the block reward and constrains new supply, has become a core driver shaping Bitcoin’s long-term market structure and price behavior.
Bitcoin’s early Christmas prices trace a slow but steady adoption curve. By 2013, BTC was trading near $669, marking its first moment of mainstream attention. That was followed by pronounced boom-and-bust cycles, including the 2017 rally above $14,000 and the 2018 drawdown below $4,000. Yet each reset left Bitcoin trading at a higher structural base.
The pandemic era accelerated this shift. By Christmas 2020, Bitcoin was trading above $24,000, supported by institutional inflows and macro uncertainty. In 2021, BTC crossed $50,000, reinforcing its transition from a speculative asset into a macro-linked store of value increasingly compared with gold and other hard assets.
Bitcoin’s Christmas Day Snapshot by Market Cycle
The table below captures how Bitcoin’s Christmas Day price, market dominance, and total crypto market value have evolved across major cycles, highlighting Bitcoin’s growing role as the anchor asset.
| Year | BTC Price on Christmas ($) | BTC Market Dominance | Total Crypto Market Cap ($) |
| 2009 | 0.003 | ~100% | 0 |
| 2010 | 0.25 | 99.50% | 0.05 bn |
| 2011 | 4 | 99% | 0.10 bn |
| 2012 | 13 | 98% | 0.10 bn |
| 2013 | 669 | 98% | 1.5 bn |
| 2014 | 320 | 98% | 4.44 bn |
| 2015 | 449 | 99% | 6.86 bn |
| 2016 | 883 | 95% | 14.85 bn |
| 2017 | 14,146 | 48% | 494.9 bn |
| 2018 | 3,881 | 55% | 122.0 bn |
| 2019 | 7,206 | 70% | 184.9 bn |
| 2020 | 24,165 | 69% | 648.7 bn |
| 2021 | 50,654 | 40% | 2.37 tn |
| 2022 | 16,801 | 43% | 770.4 bn |
| 2023 | 37,800 | 52% | 1.4 tn |
| 2024 | 98,003 | 58% | 3.4 tn |
| 2025 | 87,172 | 59% | 1.74 tn |
Why Christmas 2025 Looks Structurally Different
Bitcoin heading into Christmas 2025 reflects a fundamentally different supply-and-demand profile than in earlier cycles. A key shift came with the April 2024 halving, which reduced the block reward to 3.125 BTC, tightening new supply just as institutional access expanded through spot Bitcoin ETFs.
Bitcoin’s halving mechanism has always underpinned its scarcity narrative. The network began with a block reward of 50 BTC in 2009 and has since undergone four halvings:
• November 28, 2012: reward cut to 25 BTC
• July 9, 2016: reward cut to 12.5 BTC
• May 11, 2020: reward cut to 6.25 BTC
• April 20, 2024: reward cut to 3.125 BTC
By May 2024, roughly 19.7 mn bitcoins were already in circulation, leaving about 1.3 mn BTC to be mined over the coming decades. The next halving, expected in 2028, will reduce the reward further to 1.625 BTC, reinforcing long-term supply constraints.
At the same time, capital flows have evolved. Spot Bitcoin ETFs have reshaped how institutions allocate to BTC, while the October 2025 flash crash showed Bitcoin reacting to global macro and geopolitical headlines much like other major risk assets.
Key forces defining this cycle include:
• Structural supply tightening following the 2024 halving
• ETF-driven institutional participation replacing retail-led cycles
• Stronger correlation with global liquidity and macro conditions
Together, these dynamics help explain why Bitcoin has been able to consolidate near $87,000 into Christmas 2025, rather than unwinding sharply as it did in earlier post-rally phases.
What Bitcoin’s Structure Signals for 2026
Past cycles suggest the year after a post-halving surge is rarely defined by nonstop upside. More often, Bitcoin enters a digestion phase, where gains are absorbed through time rather than sharp price extensions. Trading ranges widen, volatility becomes more selective, and markets begin rewarding structure over speed.
This shift is already visible on the chart. Bitcoin (BTC/USDT) is trading near $88,750 on the weekly timeframe, consolidating after a sharp pullback from the $124,300 cycle high. Price remains above a long-term ascending trendline that has guided the uptrend since early 2024, while recent weekly candles show smaller bodies and long lower wicks, signalling dip demand rather than panic-driven selling.
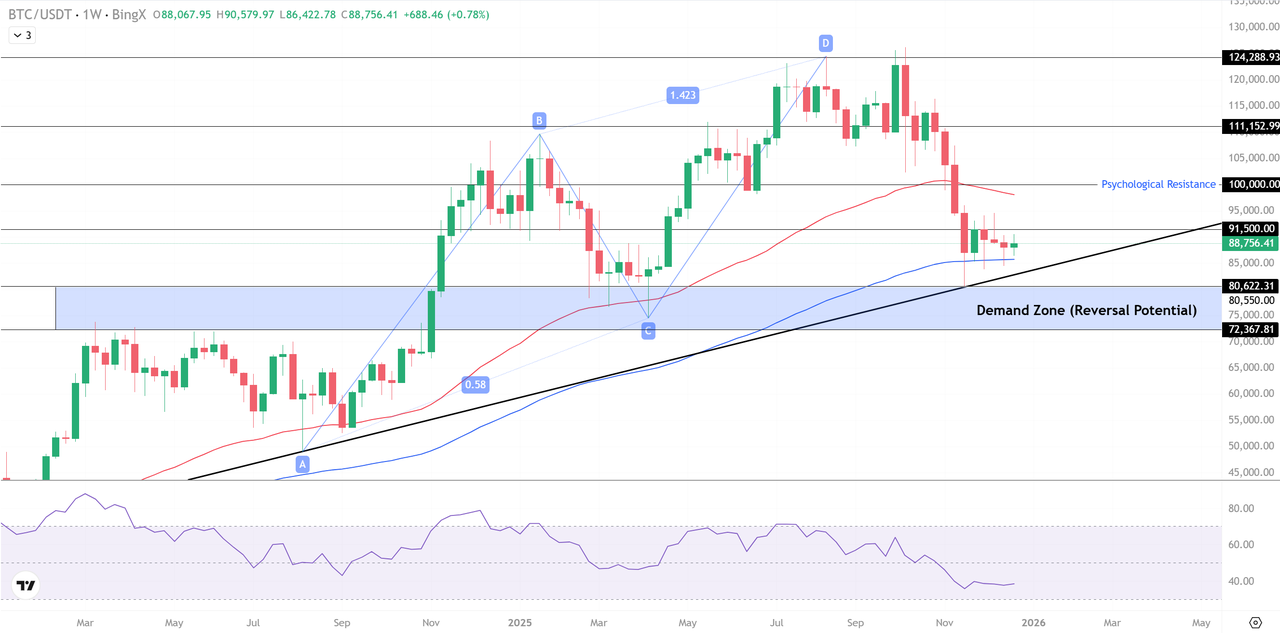
Bitcoin (BTC/USDT) Price Chart - Source: BingX
Structurally, this resembles a bullish retracement within an ascending channel, not a trend breakdown. A key demand zone between $72,000 and $80,600 aligns with a prior breakout area and the rising 100-week EMA (Exponential Moving Average), reinforcing its role as long-term support. Fibonacci retracement places current price action near the 0.382–0.5 zone, a typical consolidation region in strong trends.
Psychological resistance for Bitcoin remains near $100,000, with an intermediate resistance level around $91,500. The RSI cooling into the low-40s signals a momentum reset rather than exhaustion. Consider buying near the $82,000–$85,000 range, with a stop below $72,000, targeting $100,000–$111,000 if the trend continues.
For traders heading into 2026, the edge is likely to come from patience, clearly defined levels, and disciplined risk management. Breakouts may still emerge, but they are more likely to form after extended consolidation, not emotional momentum-driven moves.
Conclusion: Outlook for Bitcoin in 2026 Amidst Evolving Macro Conditions
As we move from 2025 to 2026, Bitcoin’s price history on Christmas Day serves as a reminder of its remarkable growth. From trading at just $0.003 in 2009 to nearing $87,000 in 2025, Bitcoin has evolved through various market cycles, driven by halving events and increasing institutional involvement. This ongoing evolution suggests that while post-halving years tend to be marked by consolidation, Bitcoin’s current stability indicates a foundation for continued growth into 2026.
Looking ahead, the broader macroeconomic environment, shaped by geopolitical tensions, inflationary pressures, and changing monetary policies, will likely impact Bitcoin’s role as a store of value. As institutional participation continues to expand, Bitcoin’s behavior may increasingly align with traditional risk assets. For traders, 2026 presents opportunities to capitalize on strategic entries at key levels, with success dependent on disciplined risk management and navigating Bitcoin's evolving market dynamics.
