


المطرقة المقلوبة هي نموذج شمعة انعكاس صاعد يظهر في أسفل الاتجاه الهابط. لها جسم صغير في النهاية السفلى للشمعة، وظل علوي طويل بطول ضعف الجسم على الأقل، وظل سفلي قليل أو معدوم. تشير المطرقة المقلوبة إلى أن المشترين حاولوا دفع الأسعار لأعلى خلال الجلسة، مما يوحي بأن ضغط البيع قد يضعف وقد يتبعه انعكاس. تتطلب تأكيداً من الشمعة التالية قبل التصرف على الإشارة.
هل يمكن لشمعة واحدة أن تكشف متى ستصطدم موجة بيع كبيرة في السوق بحائط؟ بينما يخشى معظم المتداولين من السوق الهابط، أولئك الذين يستطيعون تحديد نموذج المطرقة المقلوبة يرون فرصة ذهبية للانعكاس الصاعد. يعمل هذا النموذج كساحة معركة عالية المخاطر حيث يلاقي الزخم الهابط أخيراً منافسه، مشيراً إلى تحول محتمل في السيطرة من البائعين إلى المشترين.
في هذا الدليل، ستتعلم بالضبط كيفية تحديد نموذج المطرقة المقلوبة، فهم علم النفس السوقي وراءه، التمييز بينه وبين النجمة الساقطة، وتطبيق استراتيجية تداول خطوة بخطوة مع إدارة مخاطر مناسبة على BingX.
من إدارة المخاطر المناسبة إلى استخدام مؤشرات الزخم للتأكيد، سنوفر الخارطة الطريق لتداول نموذج المطرقة المقلوبة بدقة سريرية.
ما هو نموذج الشمعة المطرقة المقلوبة؟
المطرقة المقلوبة هي نموذج شمعة انعكاس صاعد يعمل كتمثيل بصري لتحول في سيطرة السوق. تظهر عادة بعد الاتجاه الهابط، مشيرة إلى نقطة حيث يتم تحدي ضغط البيع المطول من قبل المشترين الناشئين.
في جوهرها، تُظهر المطرقة المقلوبة شد الحبل: حاول البائعون إبقاء الأسعار منخفضة، لكن المشترين تدخلوا بقوة كافية لدفع السعر بشكل كبير أعلى خلال الجلسة. حتى لو استقر السعر مرة أخرى بالقرب من سعر الفتح، يعمل الظل العلوي الطويل كبصمة للنية الصاعدة.
الخصائص الرئيسية لنموذج المطرقة المقلوبة
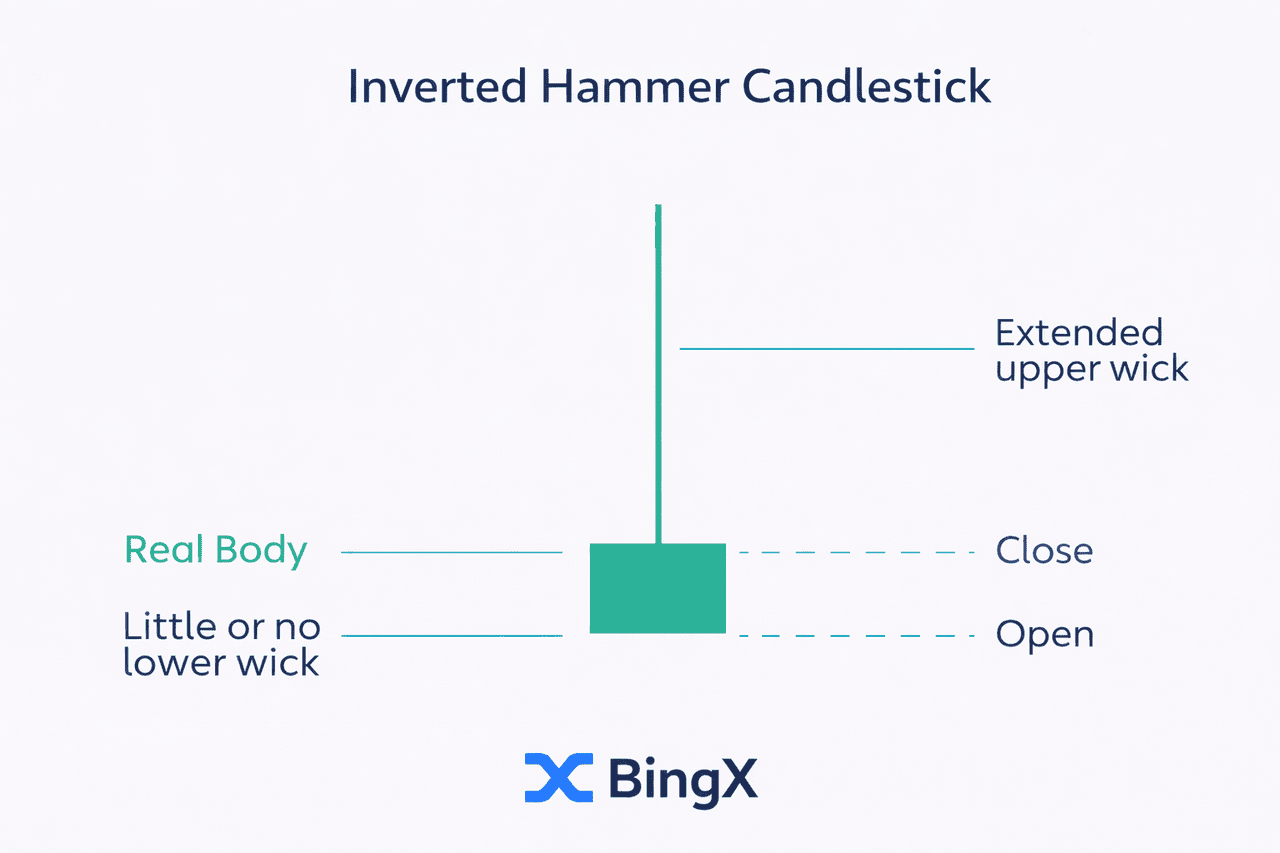
لتحديد المطرقة المقلوبة بشكل صحيح، يجب البحث عن أربع خصائص جسدية محددة:
- جسم صغير في الأسفل: سعر الفتح وسعر الإغلاق قريبان جداً من بعضهما البعض، مما يؤدي إلى جسم صغير يقع في النهاية السفلى لنطاق الجلسة.
- ظل علوي طويل / ذيل علوي طويل: هذه هي الخاصية الأكثر تميزاً. يجب أن يكون الظل العلوي على الأقل ضعفين إلى ثلاثة أضعاف طول جسم الشمعة.
- ظل سفلي قليل أو معدوم: تتشكل المطرقة المقلوبة الحقيقية مع ظل سفلي قصير جداً أو غير موجود، مما يشير إلى أن السوق لم يتداول بشكل كبير تحت سعر الفتح أو الإغلاق.
- السياق السوقي: يحمل النموذج إشارة صاعدة فقط عندما يحدث بعد اتجاه هابط واضح.
ما هو علم النفس وراء الظل العلوي الطويل في المطرقة المقلوبة؟
الظل العلوي الطويل (أو الذيل العلوي الطويل) هو الجزء الأكثر أهمية في القصة. يمثل محاولة جريئة من الثيران لدفع الأسعار أعلى.
- المشترون يختبرون أسعاراً أعلى: لأول مرة في الاتجاه الهابط، كان المشترون أقوياء بما فيه الكفاية لدفع السعر لأعلى بشكل كبير.
- البائعون يفقدون السيطرة: رغم أن البائعين تمكنوا من دفع السعر مرة أخرى نحو سعر الفتح، لم يتمكنوا من إنشاء قاع جديد. هذا الفشل في مواصلة الاتجاه الهابط يشير إلى أن الضغط الهابط يتلاشى.
لماذا يهم الجسم في أسفل المطرقة المقلوبة
الجسم الصغير في أسفل الشمعة مهم بنفس القدر. يُظهر أنه رغم التقلبات والارتفاع الهائل في السعر خلال الجلسة، بقي سعر الفتح وسعر الإغلاق بالقرب من أدنى مستويات الجلسة. هذا الجسم المضغوط في الأسفل يدل على "مواجهة". لم يستطع الدببة دفع السعر أكثر انخفاضاً، ولم يستطع الثيران الاحتفاظ بالقمة—لكن رفض السوق عمل قاع أدنى هو إشارة صاعدة.
لماذا تشير المطرقة المقلوبة إلى انعكاس صاعد محتمل؟
تشير المطرقة المقلوبة إلى انعكاس صاعد محتمل من خلال إظهار أن الدببة تفقد السيطرة. الظل العلوي الطويل يثبت أن المشترين وجدوا أخيراً الزخم الصاعد لتحدي ضغط البيع المطول. حتى بدون إغلاق عالي، هذا "الاختبار" يشير إلى أن الضغط الهابط مستنفد.
عندما يظهر هذا النموذج بعد اتجاه هابط واضح، يشير إلى تحول نفسي حيث يصبح انعكاس الاتجاه وشيكاً.
ما تعكسه المطرقة المقلوبة حول معنويات السوق
معنى المطرقة المقلوبة يذهب أعمق بكثير من مجرد شكلها على مخطط الأسعار؛ إنها خريطة بصرية للتحول النفسي في معنويات السوق. بعد فترة من ضغط البيع المطول، يصل السوق إلى حالة من الإنهاك.
عندما تتشكل المطرقة المقلوبة، تحكي قصة معركة داخل اليوم الدرامية حيث واجه "الدببة" (البائعون) أخيراً مقاومة كبيرة.
في الاتجاه الهابط الواضح، تكون المعنويات سلبية بشكل ساحق. ومع ذلك، تُظهر المطرقة المقلوبة أول تصدع حقيقي في هذا الدرع الهابط. تعكس لحظة حيث يتم تحدي الزخم الهابط بتدفق مفاجئ من المشترين. حتى لو لم يُغلق السعر عند أعلى مستوياته اليومية، فإن حقيقة وصوله إلى تلك المستويات على الإطلاق تشير إلى أن "القاع" قد يكون قريباً.
التحول المحتمل في السيطرة: الضغط الهابط مقابل الزخم الصاعد
تعكس المطرقة المقلوبة مرحلة انتقالية:
- المرحلة 1: السوق مهيمن عليه من الزخم الهابط والبيع المستمر.
- المرحلة 2: تظهر المطرقة المقلوبة، مُظهرة أن الثيران أخيراً "يختبرون المياه."
- المرحلة 3: يحدث تحول محتمل في السيطرة حيث يستعد السوق للانعكاس الصاعد.
فهم هذا النموذج يعني الاعتراف بأنه بينما لم يترك الدببة المبنى بعد، فقد وصل الثيران رسمياً لطلب أراضيهم.
المطرقة المقلوبة مقابل النجمة الساقطة: الاختلافات الرئيسية
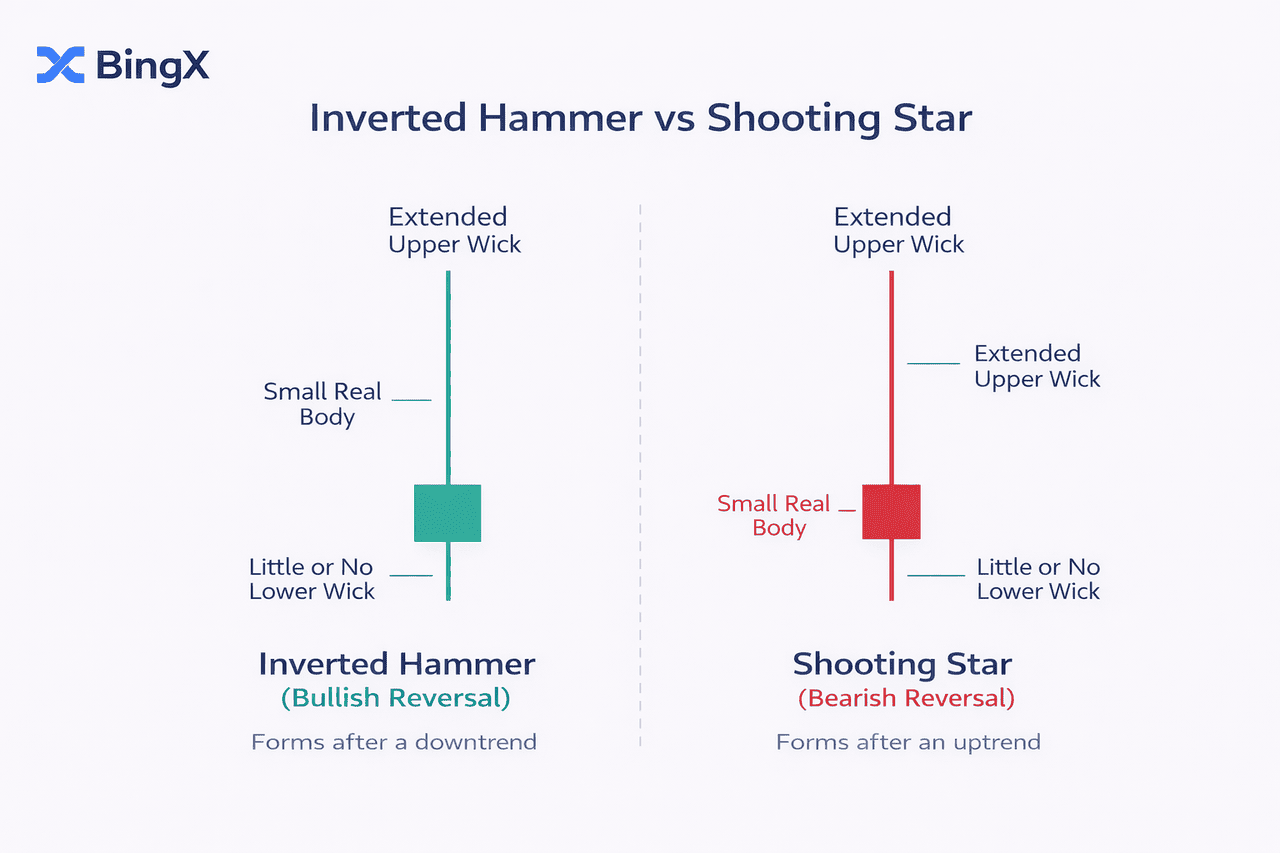
المطرقة المقلوبة والنجمة الساقطة متطابقان بصرياً، كلاهما يظهر جسماً صغيراً في الأسفل مع ظل علوي طويل وظل سفلي قليل أو معدوم. الاختلاف الذي يفصل الإشارة الصاعدة عن الهابطة هو بالكامل حول مكان ظهور الشمعة في الاتجاه.
|
الخاصية |
المطرقة المقلوبة |
النجمة الساقطة |
|
الشكل البصري |
جسم صغير، ظل علوي طويل |
جسم صغير، ظل علوي طويل |
|
الاتجاه السابق |
اتجاه هابط (انخفاض) |
اتجاه صاعد (ارتفاع) |
|
نوع الإشارة |
إشارة انعكاس صاعد |
إشارة هابطة |
|
معنويات السوق |
البائعون يفقدون السيطرة |
المشترون يفقدون السيطرة |
إحدى أكثر نقاط الخلط شيوعاً للمتداولين الجدد هي التمييز بين المطرقة المقلوبة و النجمة الساقطة. بصرياً، لديهما نفس الشكل: جسم صغير في الأسفل مع ظل علوي طويل وظل سفلي قليل أو معدوم.
ومع ذلك، في التحليل الفني، الشكل هو نصف القصة فقط. السياق السوقي الأوسع، تحديداً مكان ظهور الشمعة على مخطط الأسعار، يحدد ما إذا كانت الإشارة انعكاساً صاعداً أم هابطاً.
سياق سوقي مختلف، معنى مختلف
الاختلاف الأساسي يكمن في الاتجاه السابق. بدون تحديد الاتجاه، لا يمكنك تحديد المطرقة المقلوبة بشكل صحيح.
- المطرقة المقلوبة: يظهر هذا النموذج بعد اتجاه هابط واضح أو فترة من ضغط البيع المطول. في هذا السياق، يعمل كإشارة انعكاس صاعد محتملة، مشيراً إلى أن القاع موجود.
- النجمة الساقطة: تظهر هذه الشمعة في قمة الاتجاه الصاعد. في هذا السياق، نفس الشكل يشير إلى أن المشترين منهكون والسعر قد وصل إلى سقف، مشيراً إلى انعكاس هابط.
بفهم هذا التمييز، يمكنك تجنب "فخ" الدخول في صفقة بناءً على الشكل وحده. اسحب دائماً للخارج لرؤية السياق السوقي قبل وضع طلب.
اقرأ المزيد: كيفية تداول نموذج النجمة الساقطة في العملات المشفرة: اكتشاف الانعكاسات الهابطة
كيفية تداول نموذج المطرقة المقلوبة: استراتيجية خطوة بخطوة
تداول نموذج المطرقة المقلوبة يتطلب نهجاً منهجياً لتجنب الإشارات الكاذبة. باستخدام مثال البيتكوين (BTC/USDT)، يمكننا أن نرى كيف تتطور إشارة المطرقة المقلوبة إلى صفقة عالية الاحتمال عندما تُدمج مع السياق السوقي.
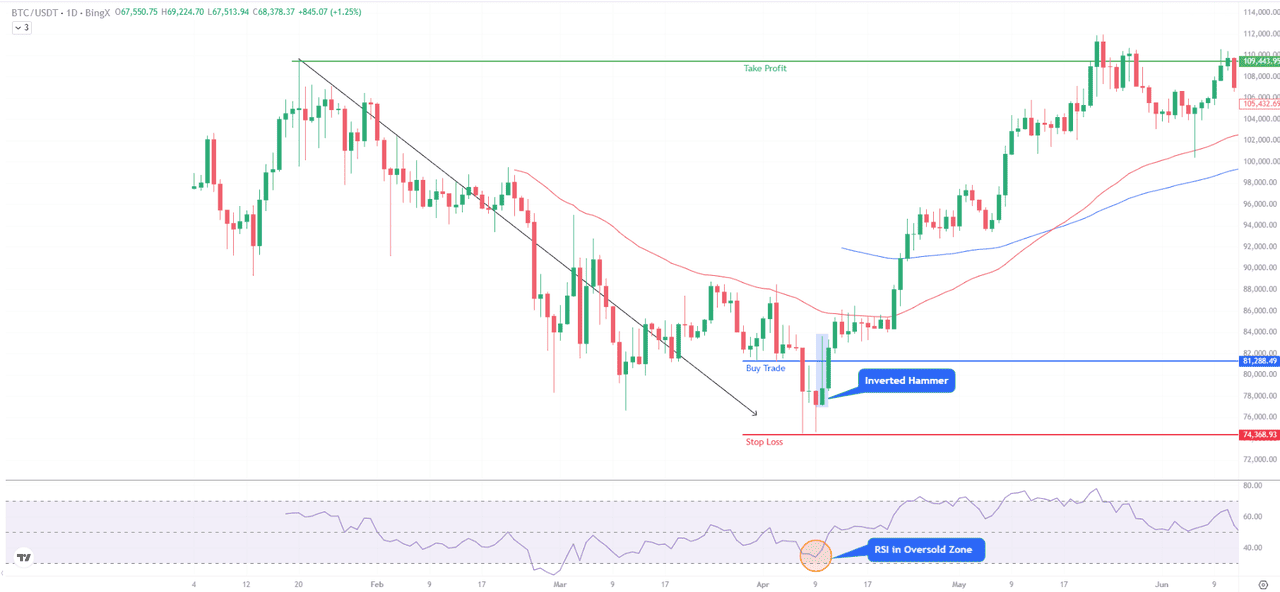
البيتكوين (BTC/USDT) مخطط الأسعار - المصدر: BingX
1. استراتيجية الدخول: الصبر للتأكيد
لا تدخل صفقة أبداً في اللحظة التي تتشكل فيها المطرقة المقلوبة. لتحديد المطرقة المقلوبة بشكل صحيح كحدث قابل للتداول، يجب انتظار التأكيد.
- المحرك: ضع طلب شراء فقط فوق أعلى نقطة للمطرقة المقلوبة. في المثال، الدخول محدد عند مستوى $81,300.
- التأكيد: يجب أن تكون الشمعة التالية شمعة صاعدة قوية تُغلق فوق خط الدخول.
2. وضع وقف الخسارة: حماية رأس مالك
إدارة المخاطر المناسبة تحمي رأس مالك من إعادة تشغيل الزخم الهابط.
- وقف الخسارة: ضعه قليلاً تحت الظل السفلي للمطرقة. في لقطة الشاشة، هذا محدد عند $74,370.
- جني الربح: استهدف مناطق المقاومة السابقة. الهدف في هذا الإعداد هو القمة المتأرجحة عند $109,450، مما يوفر نسبة مخاطرة إلى عائد لا تقل عن 1:2.
3. التآزر الفني
في المثال، تظهر المطرقة المقلوبة بينما يكون مؤشر القوة النسبية (RSI) في منطقة البيع المفرط (محدد بالدائرة البرتقالية). هذا التقارب بين نموذج الشمعة ومؤشرات الزخم ينشئ إشارة أقوى بكثير.
ما معنى المطرقة المقلوبة الخضراء مقابل الحمراء؟
لون جسم المطرقة المقلوبة يضيف طبقة إضافية من السياق:
- المطرقة المقلوبة الخضراء (الإغلاق > الفتح): انتهت الجلسة أعلى مما فتحت. هذه إشارة أقوى قليلاً لأن المشترين حافظوا على بعض السيطرة بحلول نهاية الشمعة.
- المطرقة المقلوبة الحمراء (الإغلاق < الفتح): انتهت الجلسة أقل مما فتحت. الإشارة ما زالت صالحة لكن تتطلب تأكيداً أقوى من الشمعة التالية.
في كلا الحالتين، الخاصية المحددة هي الظل العلوي الطويل، وليس لون الجسم. لا تتخط التأكيد أبداً بناءً على اللون وحده.
كيفية تداول المطرقة المقلوبة على BingX
بمجرد تحديد مطرقة مقلوبة مؤكدة على مخططات BingX، إليك كيفية تنفيذ الصفقة:
1. افتح مخطط التداول في BingX وانتقل إلى إطار زمني يومي أو 4 ساعات للحصول على أكثر الإشارات موثوقية.
2. حدد الاتجاه الهابط: أكد على الأقل 3-5 شموع هابطة متتالية أو بنية انخفاض واضحة.
3. اكتشف المطرقة المقلوبة: جسم صغير في الأسفل، ظل علوي طويل (2x+ طول الجسم)، ظل سفلي أدنى.
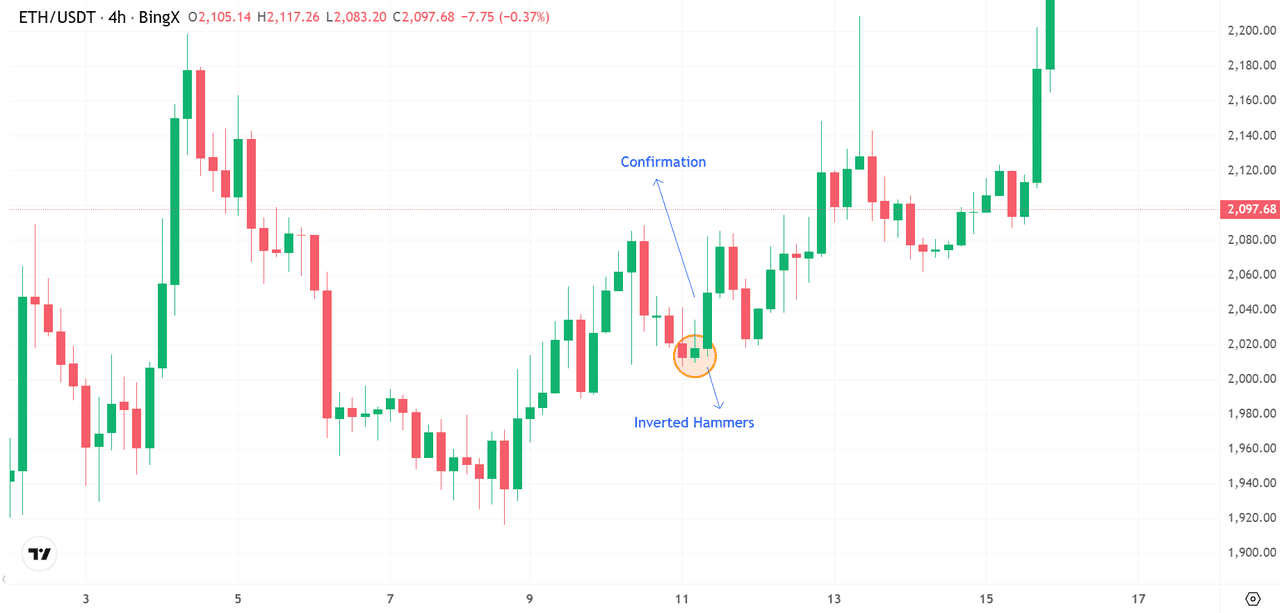
الإيثريوم (ETH/USDT) مخطط الأسعار - المصدر: BingX
4. انتظار التأكيد: يجب أن تُغلق الشمعة التالية فوق أعلى نقطة للمطرقة المقلوبة.
5. ادخل الصفقة: ضع طلب شراء فقط فوق أعلى نقطة لشمعة التأكيد.
6. ضع وقف الخسارة: تحت أدنى نقطة للمطرقة المقلوبة.
7. ضع جني الربح: استهدف منطقة المقاومة التالية أو استخدم نسبة مخاطرة إلى عائد لا تقل عن 1:2.
المطرقة المقلوبة مقابل المطرقة العادية: ما الفرق؟
المتداولون الجدد غالباً ما يخلطون بين المطرقة المقلوبة والمطرقة العادية، هما نماذج مترابطة لكن تبدو متضادة على المخطط.
|
الخاصية |
المطرقة المقلوبة |
المطرقة العادية |
|
موقع الجسم |
جسم صغير في الأسفل |
جسم صغير في الأعلى |
|
اتجاه الظل الطويل |
ظل علوي طويل |
ظل سفلي طويل |
|
مكان ظهورها |
أسفل الاتجاه الهابط |
أسفل الاتجاه الهابط |
|
نوع الإشارة |
انعكاس صاعد |
انعكاس صاعد |
|
أيهما أقوى؟ |
يحتاج المزيد من التأكيد |
أكثر موثوقية قليلاً |
كل من نماذج المطرقة المقلوبة والعادية تظهر في أسفل الاتجاهات الهابطة وتشير إلى نفس الشيء، انعكاس صاعد محتمل. المطرقة العادية تُعتبر أكثر موثوقية قليلاً لأن الظل السفلي الطويل يُظهر مباشرة أن المشترين رفضوا الأسعار الأقل في الوقت الفعلي. الظل العلوي الطويل للمطرقة المقلوبة هو أكثر كونه "اختبار"، وصل المشترون إلى أسعار أعلى لكن لم يحتفظوا بها، وهذا لماذا التأكيد أمر بالغ الأهمية.
اقرأ المزيد: استخدام نموذج المطرقة لتحديد انعكاسات الاتجاه في العملات المشفرة
كيفية استخدام المؤشرات الفنية مع المطرقة المقلوبة
بينما المطرقة المقلوبة هي إشارة بصرية قوية، الاعتماد على شمعة واحدة محفوف بالمخاطر. لتحسين الموثوقية وتصفية الإشارات الكاذبة، يبحث المتداولون المحترفون عن التقارب مع المؤشرات الفنية الأخرى.
الأزواج الفنية الرئيسية
- الانحراف الصاعد للـ RSI: إذا أظهر مخطط الأسعار قيعان أقل لكن مؤشر القوة النسبية يُظهر قيعان أعلى، فإن هناك انحراف صاعد. عندما تتشكل المطرقة المقلوبة خلال هذا الانحراف، إشارة الانعكاس تكون أقوى بكثير.
- مناطق الدعم والمقاومة: تظهر المطرقة المقلوبة بصحة أعلى بكثير عندما تلمس مستوى دعم رئيسي أو رقم نفسي دائري. هذا يشير إلى أن السوق وجد "أرضية."
- تأكيد الحجم: ابحث عن ارتفاع في حجم التداول خلال تشكيل المطرقة المقلوبة أو على الشمعة التالية. الحجم العالي يشير إلى أن "الأموال الذكية" تشارك في التحول المحتمل للسيطرة.
- تقاطع MACD: تقاطع صاعد على الماكد (تقارب وتباعد المتوسطات المتحركة) بعد وقت قصير من ظهور النموذج يؤكد أن الزخم الصاعد يتراكم.
- تراجع فيبوناتشي: إذا اصطفت المطرقة مع مستوى 61.8% أو 50% فيبوناتشي، فإنها تعمل كنقطة ارتكاز فني لانعكاس اتجاه محتمل.
الخلاصة: لا يوجد نموذج منعزل. اجمع دائماً إشارة المطرقة المقلوبة مع مؤشرات الزخم والسياق السوقي لزيادة معدل فوزك وضمان إدارة المخاطر المناسبة.
متى يفشل نموذج المطرقة المقلوبة؟
حتى المطرقة المقلوبة المثالية يمكن أن تؤدي إلى خسارة. التعرف على الفشل أمر حيوي لإدارة المخاطر المناسبة.
- الأسواق الجانبية: بدون اتجاه هابط واضح، يفتقر نموذج المطرقة المقلوبة إلى الضغط الهابط الضروري لإثارة الانعكاس.
- التأكيد الضعيف: إذا فشلت الشمعة التالية في الإغلاق فوق أعلى نقطة للمطرقة، فإن الزخم الصاعد قد توقف على الأرجح.
- نقطة الإلغاء: إذا كسر السعر تحت أدنى نقطة للمطرقة المقلوبة، فإن الانعكاس الصاعد المحتمل مات. هذا غالباً ما يعزز الإشارة الهابطة، مشيراً إلى أن البائعين استعادوا السيطرة.
كيفية تجنب الإشارات الكاذبة
المرشح الوحيد الأكثر فعالية هو انتظار التأكيد. المتداولون الذين يدخلون لحظة تشكل المطرقة المقلوبة، دون انتظار الشمعة التالية، يواجهون معدلات فشل أعلى بكثير. النموذج هو علامة تحذير، وليس محرك تداول بمفرده.
المرشح الثانوي هو الحجم. المطرقة المقلوبة التي تتشكل على حجم أقل من المتوسط أكثر احتمالاً للفشل من واحدة تتشكل على ارتفاع حجم. الحجم المنخفض يعني أن المشاركين المؤسسيين ليسوا وراء الحركة.
الخلاصة: كيفية تداول العملات المشفرة بالمطرقة المقلوبة
المطرقة المقلوبة هي حليف قوي لأي متداول، لكن فعاليتها تكمن في الانضباط. بينما تشير إلى انعكاس صاعد محتمل، تذكر أن السياق السوقي يهم أكثر بكثير من شكل شمعة واحدة. للتداول بثقة، انتظر التأكيد دائماً، شمعة صاعدة قوية تُغلق فوق أعلى نقطة للمطرقة هي الضوء الأخضر.
اعظم نجاحك من خلال الجمع بين هذا النموذج وأدوات التحليل الفني مثل مستويات الدعم ومؤشرات الزخم. فوق كل شيء، طبق إدارة المخاطر المناسبة لحماية رأس مالك.
الخلاصة: المطرقة المقلوبة ليست إشارة سحرية، إنها تحذير مبكر لانعكاس اتجاه محتمل يتطلب نهجاً صبوراً ومدفوعاً بالبيانات.
قراءة ذات صلة
- 10 مؤشرات رئيسية تشير إلى سوق صاعدة للعملات المشفرة
- إتقان مخططات الشموع في تداول العملات المشفرة: دليل شامل
- كيفية استخدام تقارب وتباعد المتوسط المتحرك (MACD) في تداول العملات المشفرة
- كيفية استخدام مؤشر القوة النسبية (RSI) في تداول العملات المشفرة
- كيفية استخدام استراتيجية شمعة البين بار لتداول الانعكاسات في العملات المشفرة
- استخدام نموذج المطرقة لتحديد انعكاسات الاتجاه في العملات المشفرة
- كيفية استخدام نموذج نجمة المساء للتنبؤ باتجاهات السوق في تداول العملات المشفرة
- ما هي نماذج مخططات العملات المشفرة؟ شرح الرأس والكتفين، المثلثات، الأسافين
- إتقان مخططات الشموع في تداول العملات المشفرة
الأسئلة الشائعة: نموذج المطرقة المقلوبة
1. هل المطرقة المقلوبة صاعدة أم هابطة؟
المطرقة المقلوبة هي إشارة انعكاس صاعدة. تظهر في أسفل الاتجاه الهابط وتشير إلى أن ضغط البيع يضعف وقد يكتسب المشترون السيطرة. ومع ذلك، يجب تأكيدها بواسطة الشمعة التالية التي تُغلق أعلى قبل اعتبارها إشارة تداول صالحة.
2. ما هو معدل نجاح المطرقة المقلوبة؟
المطرقة المقلوبة لديها معدل نجاح مقدر بحوالي 60-65% عندما يكون التأكيد مطلوباً قبل الدخول. تزداد موثوقيتها بشكل كبير عندما تتشكل عند مستوى دعم رئيسي، عندما يكون مؤشر القوة النسبية في منطقة البيع المفرط، أو عندما تظهر على الأطر الزمنية الأعلى مثل المخططات اليومية أو الأسبوعية.
3. ما معنى المطرقة المقلوبة الخضراء؟
تتشكل المطرقة المقلوبة الخضراء عندما يكون سعر الإغلاق أعلى من سعر الفتح. تُعتبر إشارة صاعدة أقوى قليلاً من المطرقة المقلوبة الحمراء لأن المشترين حافظوا على بعض السيطرة داخل الجلسة. ومع ذلك، الشكل، تحديداً الظل العلوي الطويل، أهم من اللون.
4. ما الذي يؤكد المطرقة المقلوبة؟
التأكيد يحدث عندما تُغلق الشمعة التي تتبع المطرقة المقلوبة مباشرة بقوة فوق أعلى نقطة للمطرقة المقلوبة. شمعة صاعدة قوية مع حجم جيد هي التأكيد الأكثر موثوقية. التأكيد الإضافي يأتي من قراءات البيع المفرط لمؤشر القوة النسبية، تقاطعات الماكد الصاعدة، والقرب من مستويات الدعم الرئيسية.
5. هل يمكن أن تظهر المطرقة المقلوبة في الاتجاه الصاعد؟
نعم. عندما يظهر نفس الشكل البصري، جسم صغير في الأسفل مع ظل علوي طويل، في أعلى الاتجاه الصاعد، يُسمى نجمة ساقطة، وليس مطرقة مقلوبة. النجمة الساقطة هي إشارة انعكاس هابطة. لهذا السبب تحديد الاتجاه السابق أساسي قبل تسمية أي نموذج.
6. كيف تختلف المطرقة المقلوبة عن المطرقة العادية؟
كلاهما يظهر في أسفل الاتجاهات الهابطة ويشير إلى انعكاسات صاعدة. الاختلاف البصري الرئيسي هو اتجاه الظل: المطرقة المقلوبة لها ظل علوي طويل (اختبر المشترون أسعاراً أعلى)، بينما المطرقة العادية لها ظل سفلي طويل (رفض المشترون مباشرة الأسعار الأقل). المطرقة العادية تُعتبر أكثر موثوقية قليلاً.
7. ما هو أفضل إطار زمني للمطرقة المقلوبة؟
الأطر الزمنية اليومية و4 ساعات تنتج أكثر إشارات المطرقة المقلوبة موثوقية في تداول العملات المشفرة. على الأطر الزمنية الأقل (15 دقيقة أو ساعة واحدة)، يظهر النموذج بشكل أكثر تكراراً لكنه يولد إشارات كاذبة أكثر بسبب ضجيج السوق.
8. هل يجب أن أستخدم المطرقة المقلوبة وحدها؟
لا. المطرقة المقلوبة هي إشارة تحذير، وليست محرك تداول مستقل. يجب استخدامها دائماً مع عامل أو عاملي تأكيد على الأقل، مثل البيع المفرط لمؤشر القوة النسبية، مستوى دعم رئيسي، أو ارتفاع حجم، لتقليل الإشارات الكاذبة وتحسين دقة التداول.