

Vertiv Holdings Co (VRT) is one of the key infrastructure suppliers behind the global expansion of AI data centers. The company provides power management, thermal management and other critical systems used to keep high-density computing environments operating reliably. That exposure has made Vertiv a major beneficiary of rising spending on GPUs, servers and data-center capacity, while also leaving the stock sensitive to questions around project timing, supply constraints and how quickly AI infrastructure investment converts into revenue.
Its latest quarter reinforced both sides of that story. Second-quarter sales rose 24.1% year over year to $3.274 billion, adjusted EPS reached $1.52 and adjusted operating margin expanded to 22.6%, while management raised its full-year outlook. Revenue still came in below the $3.38 billion market expectation cited by Quartz via Yahoo Finance, keeping execution in focus. The broader investment case therefore depends on whether Vertiv can continue converting strong AI-related demand into reported sales, margins and cash flow as large projects move through the delivery cycle.
The VRT stock forecast for 2026 now centers on two competing views:
- The data-center conversion case: AI and general-compute deployments require more power and thermal infrastructure, so sustained order conversion, 23%-plus adjusted operating margins and stronger free-cash-flow delivery could support the $358 dated Citi target.
- The execution-and-valuation case: another revenue-timing miss, margin pressure or slower customer capex could make a premium AI-infrastructure valuation harder to defend even while the underlying demand theme remains intact.
This guide breaks down the VRT stock forecast, 2026 price scenarios, key risks, and research from Citi, RBC Capital, KeyBanc, Oppenheimer and Goldman Sachs, drawing on Vertiv’s July 29 release, plus how to trade VRT stock futures on BingX TradFi with USDT collateral.
Top 5 Things for Vertiv Investors to Know in August 2026
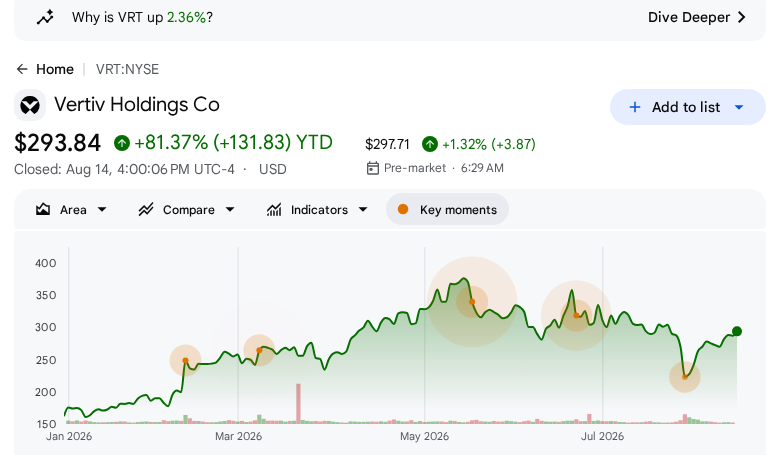
- $3.274 billion of Q2 sales grew 24.1% but missed $3.38 billion: Vertiv reported substantial year-over-year growth, but the reported consensus comparison focused attention on delivery timing. The next result must show that complex projects convert into revenue without another quarter of slippage.
- Adjusted EPS rose 60% to $1.52 as margin reached 22.6%: The profit profile was stronger than the sales headline alone suggests. Adjusted operating margin expanded 410 basis points year over year, which supports the operating-leverage part of the AI infrastructure thesis.
- Full-year sales guidance rose to $13.8 billion–$14.2 billion: Management raised its outlook despite the Q2 revenue timing issue. The midpoint implies that demand has not disappeared, but guidance delivery is now the most important confirmation point.
- Adjusted free-cash-flow guidance rose to $2.4 billion–$2.6 billion: Cash conversion matters because data-center equipment growth can consume working capital and execution capacity. Investors should compare later cash generation with the raised guide rather than rely on order commentary alone.
- Five named targets run from $301 to $358 after the Q2 release: Citi, RBC, KeyBanc, Oppenheimer and Goldman Sachs all retained or revised published views on July 30. Their range signals constructive long-term interest but more measured near-term underwriting after the revenue timing debate.
What Is Vertiv Holdings Co (VRT)?
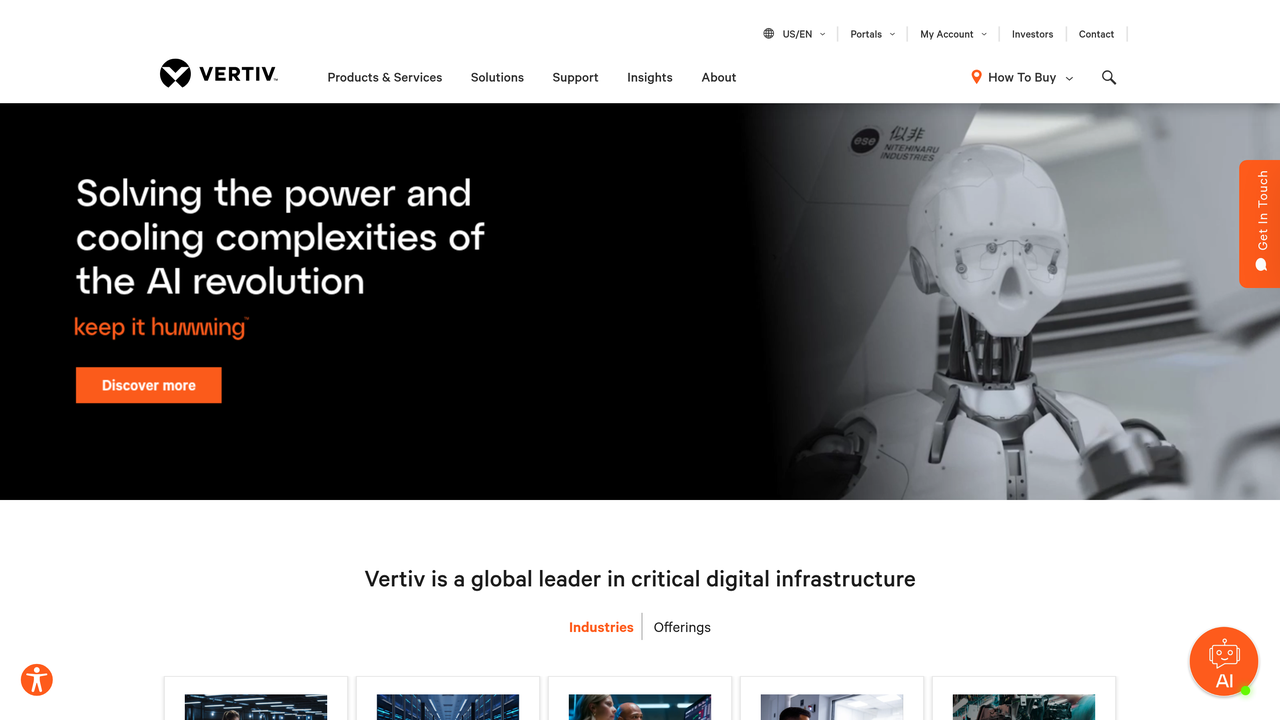
Vertiv Holdings Co provides critical digital-infrastructure equipment and services for data centers, communication networks, and commercial and industrial facilities. Its portfolio includes power management, UPS systems, switchgear, thermal management, liquid cooling, integrated infrastructure, racks and life-cycle services. It helps computing facilities receive power, remove heat and remain available when workloads increase.
AI raises the importance of that role because high-density computing needs different power architectures, thermal systems and facility designs. Revenue still depends on customer schedules, component availability, engineering execution, installation timing and acceptance. The investment case is a test of whether structural demand can convert into revenue, margin and cash flow at scale.
Vertiv (VRT) Q2 2026 Earnings Overview: What Drove Strong Margins and the Revenue-Timing Debate
- Revenue growth remained high but conversion fell short. Q2 net sales were $3.274 billion, up 24.1% year over year. The $3.38 billion reported sales expectation explains why a strong growth rate still left investors focused on timing and project execution.
- Organic growth confirmed broad demand. Vertiv reported 17.8% organic sales growth, including 21.1% in the Americas and 25.7% in APAC. EMEA organic sales declined 2.4%, so regional conversion remains uneven rather than uniformly strong.
- Margin expansion improved the quality of growth. Adjusted operating profit rose 51% to $738 million and adjusted operating margin reached 22.6%, up from 18.5% a year earlier. Management cited execution, productivity and price-cost as contributors, partly offset by tariffs.
- Cash generation gave the guide more credibility. Operating cash flow was $1.10 billion and adjusted free cash flow was $925 million. That conversion helps distinguish an operating cycle from a headline-only demand story, while still leaving working-capital and delivery risk to monitor.
- Guidance rose despite the timing issue. Q3 sales guidance was $3.65 billion–$3.85 billion and adjusted EPS guidance was $1.77–$1.83. Full-year adjusted EPS guidance increased to $6.65–$6.75 from the prior $6.30–$6.40 range cited by Quartz.
Vertiv Q2 2026 Financial and Consensus Profile: Revenue, EPS and Margins
Vertiv’s Q2 print showed strong profitability alongside a revenue-conversion tension. The financial profile separates issuer-reported figures from the dated external snapshot used to frame the earnings reaction.
|
Financial Metric |
Guidance / Consensus |
Reported / Actual |
Surprise |
|
Q2 2026 Revenue |
~$3.38 billion |
$3.274 billion, up 24.1% YoY |
Below Street. Timing and supply-chain congestion were cited. |
|
Q2 2026 Organic sales growth |
— |
17.8% |
Strong. Americas and APAC led growth. |
|
Q2 2026 Adjusted operating margin |
— |
22.6%, up 410 bps YoY |
Improved. Productivity and price-cost supported margins. |
|
Q2 2026 Adjusted EPS |
$1.42 |
$1.52, up 60% YoY |
Beat. Profitability exceeded the dated reference. |
|
Q2 2026 Adjusted free cash flow |
— |
$925 million |
Positive. Cash conversion supported the operating case. |
|
FY2026 Guidance |
Prior adjusted EPS $6.30–$6.40 |
$13.8B–$14.2B sales; $6.65–$6.75 adjusted EPS; $2.4B–$2.6B adjusted FCF |
Raised. The remaining test is execution against the higher guide. |
For context, the Q2 result did not present a simple demand collapse. It paired a revenue shortfall against the dated sales reference with stronger EPS, margins, cash generation and full-year guidance. The next report therefore matters less as a binary beat-or-miss event than as evidence on whether deferred or complex project revenue converts while profitability remains intact.
Vertiv (VRT) 2026 Investment Outlook: $358 Bull Case vs. $250 Bear Case
Vertiv’s outlook for the rest of 2026 depends on one central question: whether AI data-center demand converts into reported revenue and cash flow quickly enough to validate raised guidance, or whether complex-project timing remains a recurring limit on valuation.
The Bull Case: Project Conversion Pushes VRT Toward $358
The bull case begins with the evidence already reported: $3.274 billion of Q2 sales, 17.8% organic growth, a 22.6% adjusted operating margin, $925 million in adjusted free cash flow and raised full-year guidance. If those metrics reflect an expanding AI-infrastructure cycle rather than temporary mix, Vertiv’s systems can capture spending on power and thermal requirements that are difficult to defer once a data-center build is underway.
The required confirmation is operational, not rhetorical. Q3 revenue needs to land toward the higher end of the $3.65 billion–$3.85 billion guide while margins and cash conversion hold. Citi’s July 30 $358 target is an attributable upside reference, but the case is invalidated if project milestones again push recognized revenue out without a compensating improvement in backlog conversion or profitability.
The Base Case: Strong Demand and Timing Noise Keep VRT Between $300 and $340
The base case assumes demand remains real while valuation digestion continues. The raised full-year guide and strong margin performance keep the operating thesis intact, but the market may require several quarters of clean conversion before paying a higher multiple for that growth. The $300–$340 range is an editorial scenario, not a Street target, anchored by the dated $301–$337 cluster of Goldman Sachs, Oppenheimer, KeyBanc and RBC targets.
Under this path, VRT can remain volatile around earnings without breaking the structural thesis. The confirmation would be revenue delivery, stable regional conversion and free cash flow that tracks the $2.4 billion–$2.6 billion guide. The constraint is that a high-expectation stock can stall even if absolute results are good, because investors are measuring execution against an AI-capex narrative already reflected in the share price.
The Bear Case: Another Revenue-Timing Miss Pulls VRT Toward $250
The bear case does not require AI data-center demand to disappear. It requires supply-chain congestion, project complexity, regional weakness or customer deployment timing to become persistent enough that management repeatedly delivers revenue below the market’s expected conversion path. That outcome could coexist with respectable orders and still pressure the multiple if cash generation or margin quality weakens.
The observable trigger is a further miss on sales or lower guidance accompanied by less favorable margin or cash-flow commentary. The $250 reference is an editorial downside scenario, not a support prediction or analyst target. This case is invalidated by clean Q3 delivery, continued organic growth and evidence that the Q2 timing effect was isolated rather than a recurring execution pattern.
VRT Stock Price Forecasts for 2026 By Wall Street Analysts
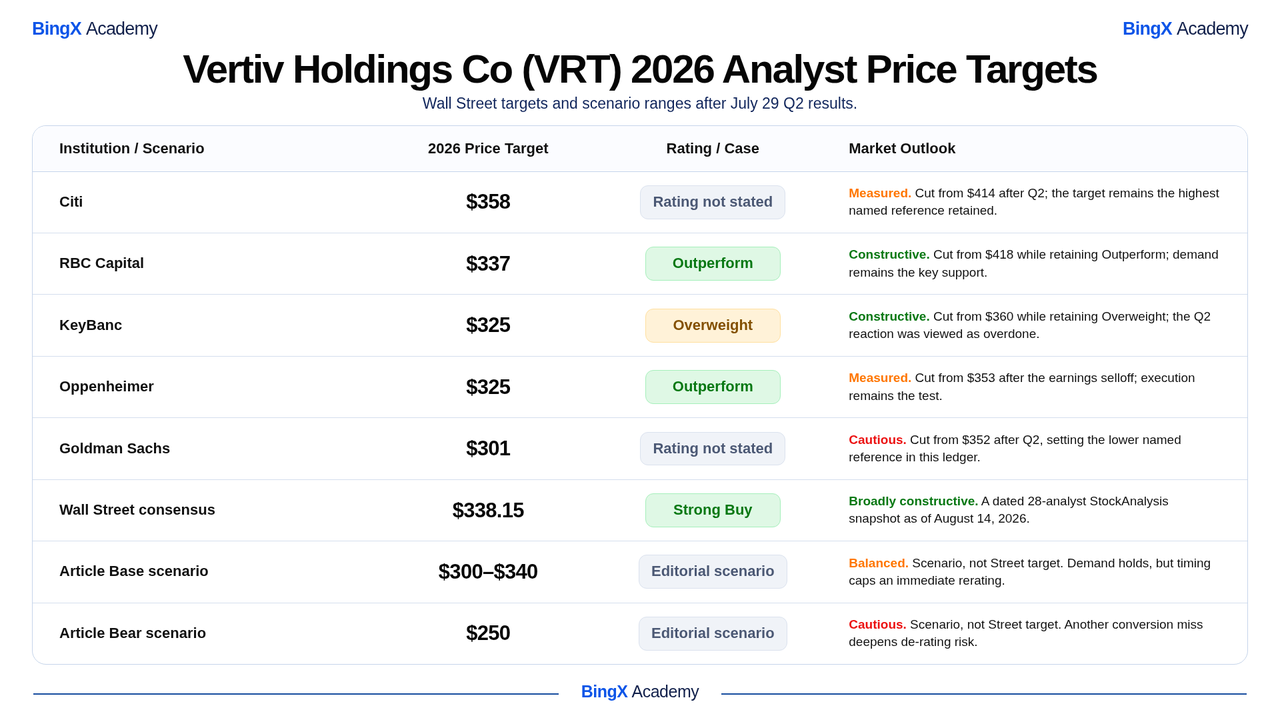
The post-Q2 Street posture remained constructive but targets were cut across the five dated named actions retained here. The dated snapshot also showed a $338.15 aggregate target, while the final two rows are explicitly labelled article scenarios rather than Street forecasts.
|
Institution / Scenario |
2026 Price Target |
Rating / Case |
Market Outlook |
|
Citi |
$358 |
Rating not stated |
Measured. Cut from $414 after Q2; the target remains the highest named reference retained. |
|
RBC Capital |
$337 |
Outperform |
Constructive. Cut from $418 while retaining Outperform; demand remains the key support. |
|
KeyBanc |
$325 |
Overweight |
Constructive. Cut from $360 while retaining Overweight; the Q2 reaction was viewed as overdone. |
|
Oppenheimer |
$325 |
Outperform |
Measured. Cut from $353 after the earnings selloff; execution remains the test. |
|
Goldman Sachs |
$301 |
Rating not stated |
Cautious. Cut from $352 after Q2, setting the lower named reference in this ledger. |
|
Wall Street aggregate consensus |
$338.15 |
Strong Buy |
Broadly constructive. A dated 28-analyst StockAnalysis snapshot as of August 14, 2026. |
|
Article Base scenario |
$300–$340 |
Editorial scenario |
Balanced. Scenario, not Street target. Demand holds, but timing caps an immediate rerating. |
|
Article Bear scenario |
$250 |
Editorial scenario |
Cautious. Scenario, not Street target. Another conversion miss deepens de-rating risk. |
How to Trade Vertiv Holdings Co (VRT) Stock on BingX
Navigate the volatility of Vertiv’s earnings cycle using BingX TradFi and BingX AI tools. By leveraging AI-driven predictive analytics, you can better anticipate market-sentiment shifts and price action around quarterly releases. BingX provides a USDT-collateralized VRT-USDT perpetual for directional exposure; it is a derivative rather than ownership of a Vertiv share and carries funding and liquidation risk.
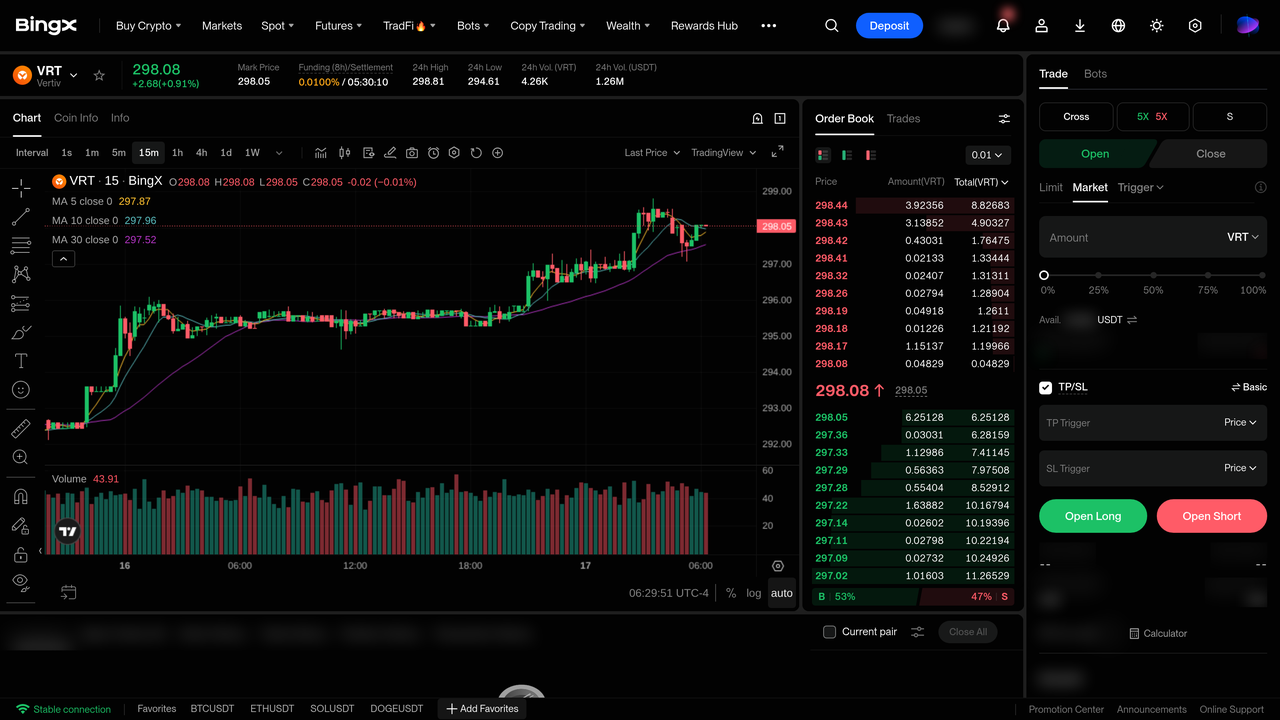
Step 1: Access BingX TradFi.Sign up and navigate to the specialized TradFi section on the BingX exchange dashboard.
Step 2: Select Vertiv Holdings Co (VRT). Search for and select the VRT-USDT perpetual futures contract, then confirm the displayed ticker and market type.
Step 3: Choose your direction. Select Open Long if you expect project conversion, margin delivery and raised guidance to remain intact. Select Open Short if you expect another revenue-timing miss, weaker capex conversion or margin pressure to challenge the operating case.
Step 4: Select leverage and margin mode. Choose Isolated or Cross-Margin based on risk tolerance. Because VRT re-priced sharply around a quarter that raised guidance, conservative leverage and clear position sizing are important.
Step 5: Execute strict risk protocols. Set Take-Profit and Stop-Loss (TP/SL) levels before or immediately after entry. Monitor earnings, guidance, project-timing commentary, margin performance and AI-data-center capex signals.
Top 5 Risks to Watch for Vertiv Holdings Co Investors in 2026
Vertiv’s AI data-center exposure remains a major growth driver, but investors should also watch whether strong demand translates into revenue, margins and cash flow as expected.
- Project conversion risk: Large data-center projects can take time to move from orders into reported revenue. Another delay would raise questions about execution, even if underlying AI infrastructure demand remains strong.
- Regional growth remains uneven: EMEA organic sales fell 2.4% in Q2, showing that demand and project conversion can vary materially across regions.
- Margin expectations are high: Vertiv’s 2026 adjusted operating-margin guidance of 23.3% to 24.3% leaves less room for tariffs, component costs, project complexity or an unfavorable product mix.
- Cash-flow conversion needs to keep pace: Full-year adjusted free-cash-flow guidance of $2.4 billion to $2.6 billion depends on working-capital discipline as the company scales equipment deliveries.
- Valuation remains sensitive to expectations: Analyst targets were revised to a roughly $301 to $358 range after Q2, highlighting how quickly the stock can reprice if growth, margins or project timing fall short of elevated expectations.
Final Thoughts: Should You Invest in Vertiv (VRT) in 2026?
Following its July 29 report, Vertiv combines a compelling operating profile with a specific conversion question. Q2 sales grew 24.1%, adjusted EPS rose 60%, margins expanded and management raised full-year guidance. The unresolved issue is whether the sales shortfall versus the dated external reference was an isolated timing event or an early signal that large AI-infrastructure projects are becoming harder to recognize on schedule.
The bull case is that sustained data-center demand, clean Q3 conversion and stable cash generation validate the raised guide and support the $358 dated Citi reference. The bear case is that another timing miss, regional weakness or margin pressure causes the market to lower its valuation tolerance. Investors who follow VRT should focus on revenue conversion, free cash flow and guidance delivery rather than treat an analyst target or a chart level as a forecast.
Risk Reminder: Trading and investing in equities like VRT involves a high risk of capital loss. Vertiv is exposed to data-center capital-spending cycles, project-execution risk, supply-chain constraints, regional demand differences, margin pressure and valuation volatility, any of which can move the stock independently of its earnings. Conduct independent research before allocating capital.
Related Reading
- Top AI Data Center Stocks to Buy in 2026: Cloud, Servers, and AI Compute Infrastructure
- Top AI Cloud Infrastructure Stocks to Buy in 2026 Amid Hyperscaler Capex and the Neocloud Boom
- Top AI Hyperscaler Stocks to Watch in 2026: The $700 Billion Cloud Infrastructure Race
- Top AI Compute and GPU Stocks to Buy in 2026: The Shift to Inference and Custom Silicon
- Top 10 AI Infrastructure Stocks to Buy in 2026: Chip Manufacturing and Design Leaders
- Nvidia (NVDA) Stock Price Outlook for 2026: Can Blackwell and Vera Rubin Take NVDA Back to $300?
