The U.S. ETF market in 2026 gives investors a simple way to access some of the biggest themes driving equities, from the S&P 500 and total market to Nasdaq technology, semiconductors, AI hardware, memory, and mega-cap platforms. Broad-market ETFs can form the foundation of a portfolio, while more focused funds let investors add exposure to specific sectors or growth themes without choosing every stock individually.
This guide compares eight U.S. ETFs across 2026 performance, fees, major holdings, and investment focus. It explains which funds are better suited to broad-market accumulation, which provide more concentrated technology exposure, and how eligible users can buy selected ETFs through BingX Stocks Trading using USDT or USDC.
What Is BingX Stocks Trading?
BingX Stocks Trading lets eligible users buy and hold U.S. stocks and ETFs alongside crypto through the same BingX account. Users can pay with USDT or USDC, access over 7,000 U.S. securities, and buy fractional shares from 5 USDC or 0.0001 shares. Unlike tokenized stocks or stock perpetuals, Stocks Trading provides brokerage-held securities, with orders executed through Alpaca Securities LLC and assets held under its regulated custody structure. Stocks offer exposure to individual companies, while ETFs cover broader markets, sectors, and investment themes. Eligible holdings may receive dividends or distributions in USDC. With fully paid securities, no leverage, funding rates, or margin-based liquidation, plus 24/5 trading access and T+1 settlement, BingX Stocks Trading provides a practical way to build longer-term positions alongside crypto.
Read More: What Is BingX Stocks Trading? A Beginner's Guide to Trading U.S. Stocks and ETFs With Crypto
What Are U.S. ETFs and How Should You Choose the Right ETF?
An ETF is an exchange-traded fund that holds a basket of securities. Some track broad indexes such as the S&P 500 or total U.S. market, while others focus on specific sectors or investment themes. For beginners, ETFs offer a simple way to diversify and build positions through regular investing. Broad-market funds can form a portfolio's foundation, while focused ETFs add exposure to technology, semiconductors, memory, and other growth themes. Five factors can help investors choose the right combination.
- Build positions through regular contributions. Investing a planned amount on a recurring schedule can reduce reliance on choosing one perfect entry point. The same contribution naturally buys more shares when prices are lower and fewer when they are higher.
- Choose the right level of diversification. VOO and SPY track the S&P 500, while VTI covers a broader range of U.S. companies. QQQ concentrates more heavily on large Nasdaq names, while SOXX, SMH, DRAM, and MAGS target narrower technology themes.
- Compare expense ratios and trading costs. Small annual fees can add up over long holding periods. A 0.03% expense ratio costs about $3 a year on $10,000, compared with about $65 at 0.65%, before spreads, taxes, or other trading costs.
- Consider reinvesting distributions. Reinvesting ETF distributions can increase the number of shares held over time, allowing future returns to compound across a larger position when the underlying investments perform well.
- Check for overlap between ETFs. Owning several funds does not automatically mean greater diversification. Combining an S&P 500 ETF with QQQ, MAGS, and semiconductor funds can significantly increase exposure to the same large technology companies, so each ETF should serve a clear role in the portfolio.
Top U.S. ETFs for Beginners Overview: 2026 YTD Performance and Fees
The ETFs below cover different approaches to investing in the U.S. market, from broad diversification through the S&P 500 and total stock market to concentrated exposure in AI hardware, semiconductors, memory, and mega-cap technology. Grouping them by investment focus helps beginners understand how each fund fits into a portfolio before comparing expense ratios and 2026 YTD performance.
- Broad-Market ETFs: VOO and SPY track the S&P 500, while VTI covers large-, mid-, and small-cap U.S. companies. These funds can serve as a foundation for long-term portfolio building.
- Nasdaq and Mega-Cap Growth ETFs: QQQ tracks the Nasdaq-100, while MAGS provides equal-weight exposure to the Magnificent Seven. Both emphasize major technology and growth companies.
- Semiconductor and AI Hardware ETFs: SOXX and SMH invest in semiconductor designers, manufacturers, and equipment suppliers supporting AI infrastructure and computing demand.
- AI Memory and Storage ETFs: DRAM focuses on companies producing HBM, DRAM, NAND, and storage technology, offering targeted exposure to the AI memory supply chain.
The table below compares annual expense ratios and 2026 YTD returns before examining each ETF's holdings, investment focus, and portfolio allocation in more detail.
| ETF | Index or Strategy | Annual Expense Ratio | 2026 YTD Total Return | Potential Portfolio Role |
| VOO | S&P 500 | 0.03% | 15.19% | Broad U.S. large-cap equity foundation |
| VTI | U.S. total stock market | 0.03% | 15.08% | U.S. equities across company sizes |
| QQQ | Nasdaq-100 | 0.18% | 24.08% | Large-company growth exposure |
| SPY | S&P 500 | 0.09% | 15.14% | Broad large-cap exposure with an established trading market |
| SOXX | NYSE Semiconductor Index | 0.33% | 96.07% | Semiconductor industry exposure |
| SMH | MVIS U.S. Listed Semiconductor 25 Index | 0.35% | 75.63% | Concentrated semiconductor exposure |
| DRAM | Actively managed global memory and storage portfolio | 0.65% | +114.41% since April 2 close* | Focused memory and storage theme |
| MAGS | Actively managed, equal-weight Magnificent Seven exposure | 0.30% | 12.04% | Concentrated exposure to seven major growth companies |
What Are the Top U.S. ETFs for Beginners in 2026?
VOO, VTI, and SPY offer broad U.S. market exposure, making them useful starting points for long-term portfolio building. QQQ adds a stronger emphasis on large growth companies, while SOXX, SMH, DRAM, and MAGS provide more concentrated exposure to semiconductors, AI hardware, memory, and mega-cap technology. The following profiles compare each ETF's costs, 2026 performance, investment focus, and largest holdings to help investors understand how each fund could fit within a portfolio.
1. Vanguard S&P 500 ETF (VOO)
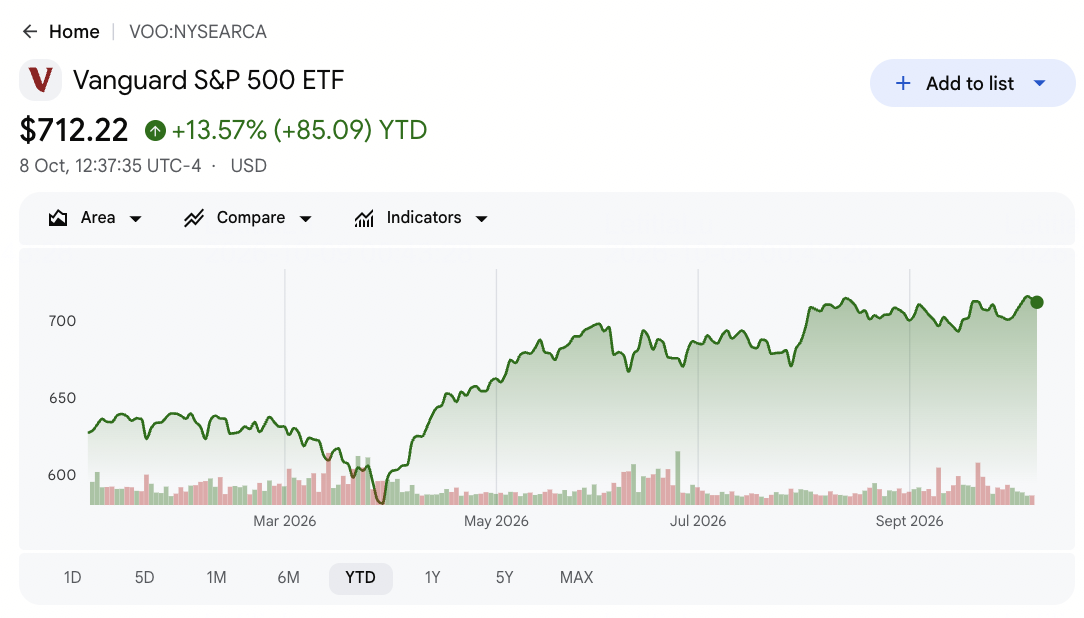
- Expense Ratio: 0.03%
- 2026 YTD Return: 13.57%
- Core Exposure: Large U.S. companies across major sectors
- Portfolio Role: Broad-market foundation for long-term accumulation
VOO tracks the S&P 500, giving investors exposure to large U.S. companies across technology, finance, healthcare, consumer industries, and other major sectors. Its market-cap weighting gives the largest companies more influence on performance, while the 0.03% expense ratio keeps ongoing costs low. For beginners, VOO can work as a core holding for broad U.S. equity exposure, though its substantial mega-cap technology allocation means overlap should be checked before adding more focused funds. (Source: advisors.vanguard.com)
| Top Holdings | Ticker | Portfolio Weight |
| NVIDIA | NVDA | 7.50% |
| Apple | AAPL | 6.57% |
| Microsoft | MSFT | 4.29% |
| Amazon | AMZN | 3.61% |
| Alphabet Class A | GOOGL | 3.24% |
2. Vanguard Total Stock Market ETF (VTI)
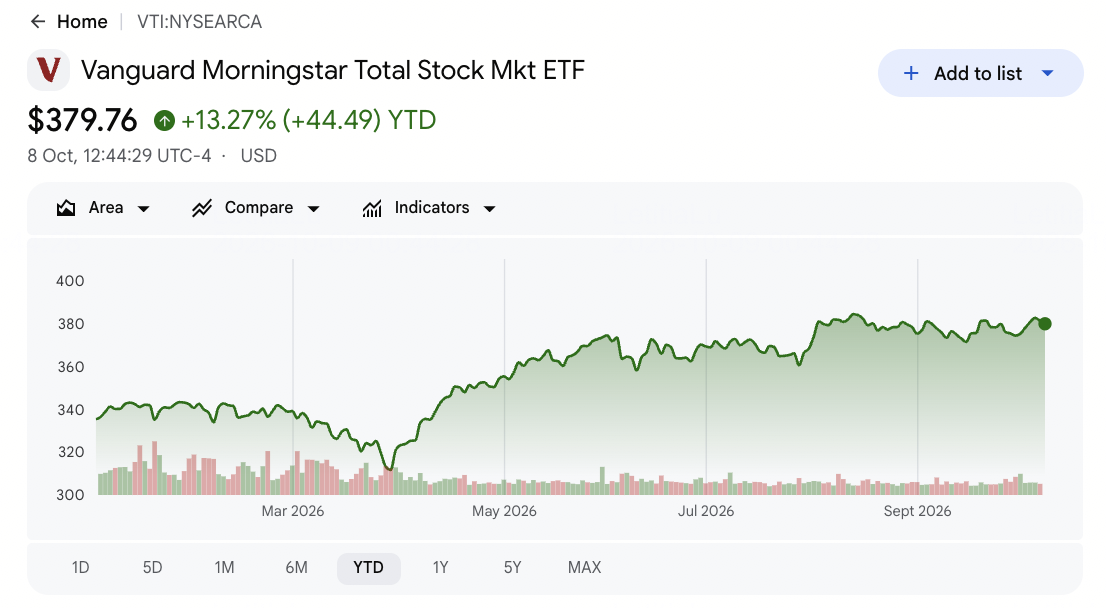
- Expense Ratio: 0.03%
- 2026 YTD Return: 13.27%
- Core Exposure: Large-, mid-, and small-cap U.S. companies
- Portfolio Role: Broad U.S. equity exposure across company sizes
VTI tracks the overall U.S. stock market and holds thousands of companies, extending beyond the large-cap names found in the S&P 500. Its low expense ratio makes it suitable for regular accumulation, while market-cap weighting still gives the largest technology companies substantial influence. For beginners choosing between VTI and VOO, the main difference is whether they want broader exposure to mid- and small-cap companies alongside established U.S. market leaders. (Source: advisors.vanguard.com)
| Top Holdings | Ticker | Portfolio Weight |
| NVIDIA | NVDA | 6.87% |
| Apple | AAPL | 6.30% |
| Microsoft | MSFT | 5.10% |
| Amazon | AMZN | 3.40% |
| Alphabet Class A | GOOGL | 2.69% |
3. Invesco QQQ ETF (QQQ)
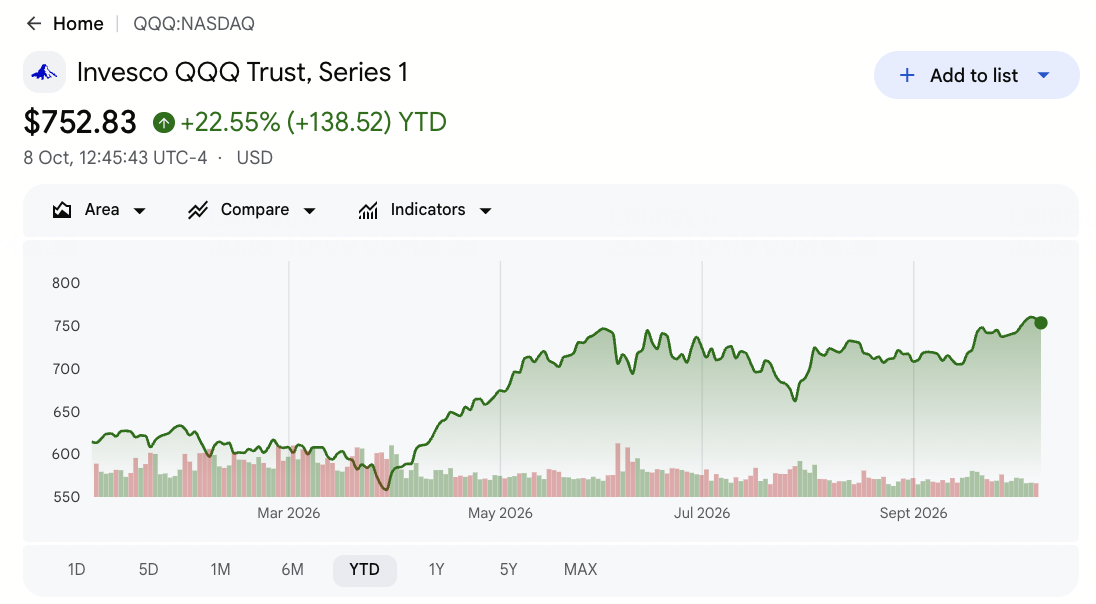
- Expense Ratio: 0.18%
- 2026 YTD Return: 24.08%
- Core Exposure: Large nonfinancial companies listed on Nasdaq
- Portfolio Role: Growth-oriented exposure to technology and innovation
QQQ tracks the Nasdaq-100, which includes 100 of the largest nonfinancial companies listed on Nasdaq. Its portfolio emphasizes technology, communications, and consumer growth, providing exposure to AI computing, cloud infrastructure, digital platforms, and other innovation-driven industries. Its 24.08% YTD return highlights growth-stock momentum in 2026, but the fund's concentration also increases sensitivity to earnings expectations and technology valuations. (Source: invesco.com)
Read More: Invesco QQQ Trust (QQQ) Prediction 2026: $870 AI Breakout or 'Epic Fury' Correction?
| Top Holdings | Ticker | Portfolio Weight |
| NVIDIA | NVDA | 8.33% |
| Apple | AAPL | 7.35% |
| Microsoft | MSFT | 5.76% |
| Micron Technology | MU | 5.02% |
| Advanced Micro Devices | AMD | 4.17% |
4. State Street SPDR S&P 500 ETF Trust (SPY)
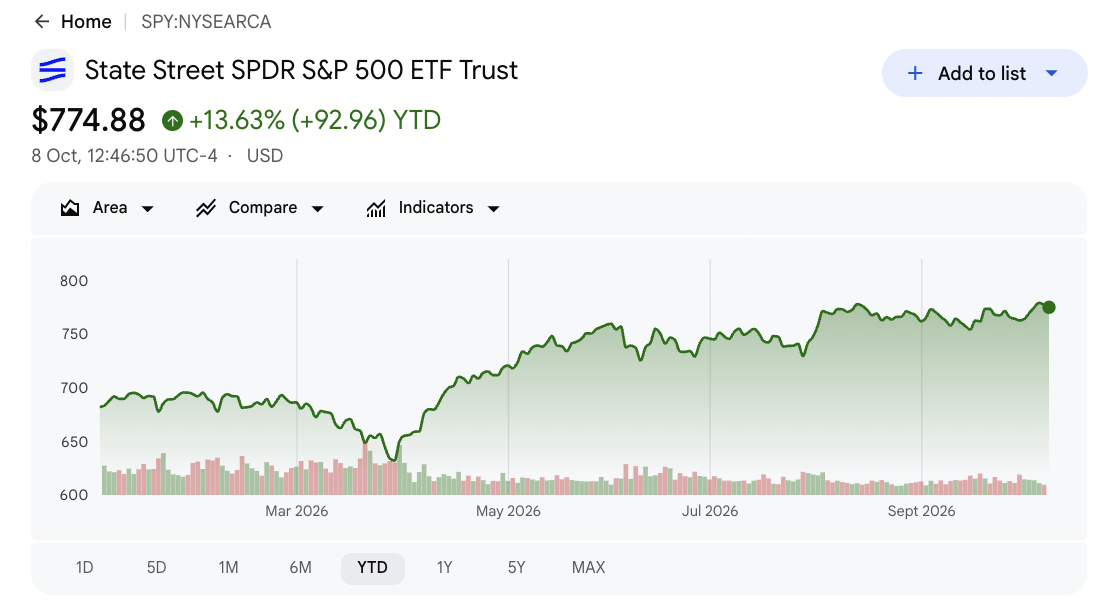
- Expense Ratio: 0.09%
- 2026 YTD Return: 13.63%
- Core Exposure: Large U.S. companies in the S&P 500
- Portfolio Role: Broad large-cap exposure with an established trading market
SPY tracks the same S&P 500 benchmark as VOO, providing exposure to leading U.S. businesses across major industries. Its long trading history and highly active market make it a widely used ETF, although its annual expense ratio is higher than VOO's. SPY returned 15.14% YTD through October 6, closely matching VOO's performance. For beginners, choosing between the two generally comes down to ongoing costs, trading access, and execution rather than meaningful differences in diversification. (Source: ssga.com)
| Top Holdings | Ticker | Portfolio Weight |
| NVIDIA | NVDA | 8.16% |
| Apple | AAPL | 7.46% |
| Microsoft | MSFT | 5.74% |
| Amazon | AMZN | 3.67% |
| Alphabet Class A | GOOGL | 3.02% |
5. iShares Semiconductor ETF (SOXX)
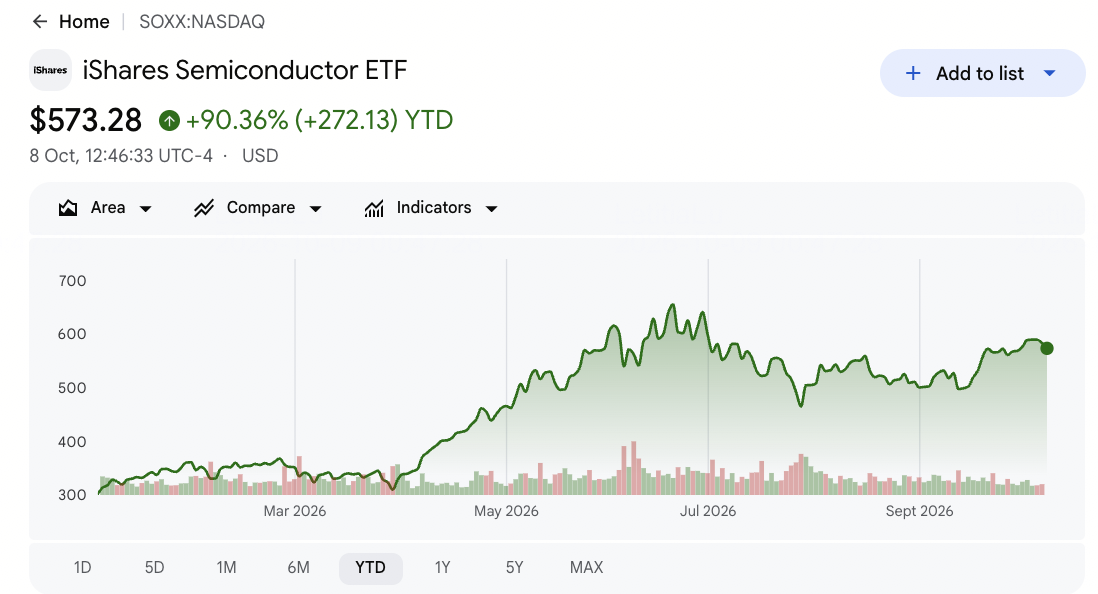
- Expense Ratio: 0.33%
- 2026 YTD Return: 90.36%
- Core Exposure: Semiconductor designers, manufacturers, and equipment suppliers
- Portfolio Role: Semiconductor industry and AI hardware exposure
SOXX tracks the NYSE Semiconductor Index, providing exposure to companies involved in chip design, manufacturing, memory, networking, and semiconductor equipment. These businesses supply essential components for AI data centers, consumer electronics, and industrial computing. Its 96.07% YTD return reflects strong momentum across the semiconductor industry in 2026. For beginners, SOXX offers exposure to multiple chip companies without selecting individual stocks, although industry downturns, export restrictions, and changes in AI spending can affect several holdings simultaneously. (Source: ishares.com)
Read More: iShares Semiconductor ETF (SOXX) Price Prediction 2026: Can AI Chip Demand Drive SOXX to $650?
| Top Holdings | Ticker | Portfolio Weight |
| NVIDIA | NVDA | 9.22% |
| Micron Technology | MU | 8.97% |
| Advanced Micro Devices | AMD | 8.70% |
| Broadcom | AVGO | 7.20% |
| Intel | INTC | 5.64% |
6. VanEck Semiconductor ETF (SMH)
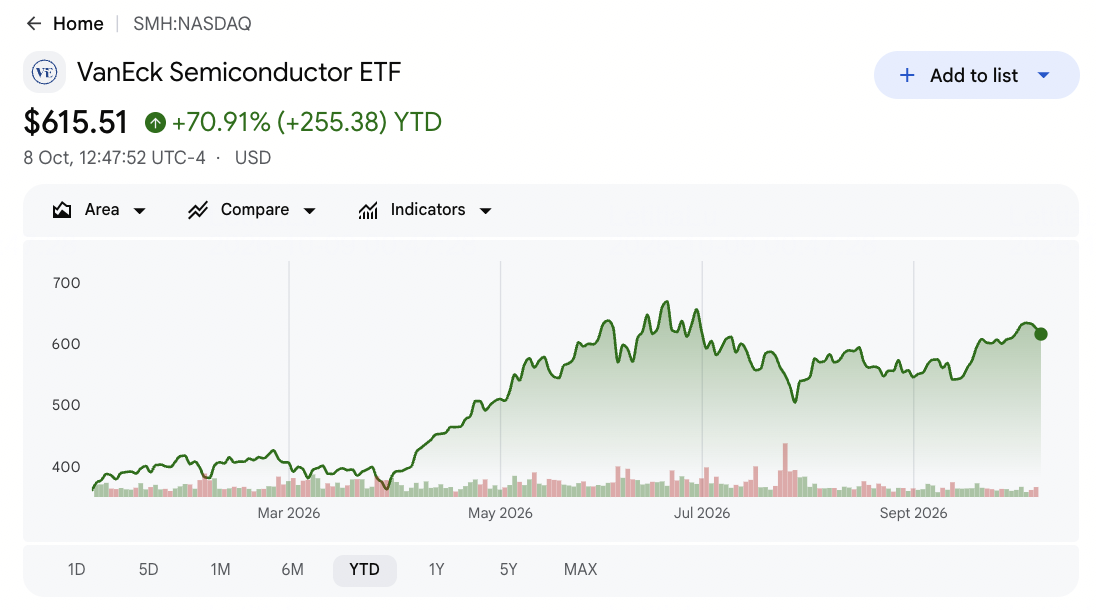
- Expense Ratio: 0.35%
- 2026 YTD Return: 70.94%
- Core Exposure: Concentrated U.S.-listed semiconductor companies
- Portfolio Role: Concentrated semiconductor and AI infrastructure exposure
SMH tracks the MVIS U.S. Listed Semiconductor 25 Index, covering major chip designers, foundries, memory suppliers, and equipment manufacturers. Its portfolio is more concentrated than SOXX, with NVIDIA and Taiwan Semiconductor Manufacturing carrying substantial weights. SMH returned 75.63% YTD through October 6, reflecting strong demand across the AI hardware supply chain. Investors comparing SMH with SOXX should look closely at individual company weights, industry overlap, and how concentrated positions influence overall performance. (Source: vaneck.com)
| Top Holdings | Ticker | Portfolio Weight |
| NVIDIA | NVDA | 19.36% |
| Taiwan Semiconductor Manufacturing | TSMC | 9.16% |
| Advanced Micro Devices | AMD | 5.66% |
| Broadcom | AVGO | 5.32% |
| Micron Technology | MU | 5.01% |
7. Roundhill Memory ETF (DRAM)
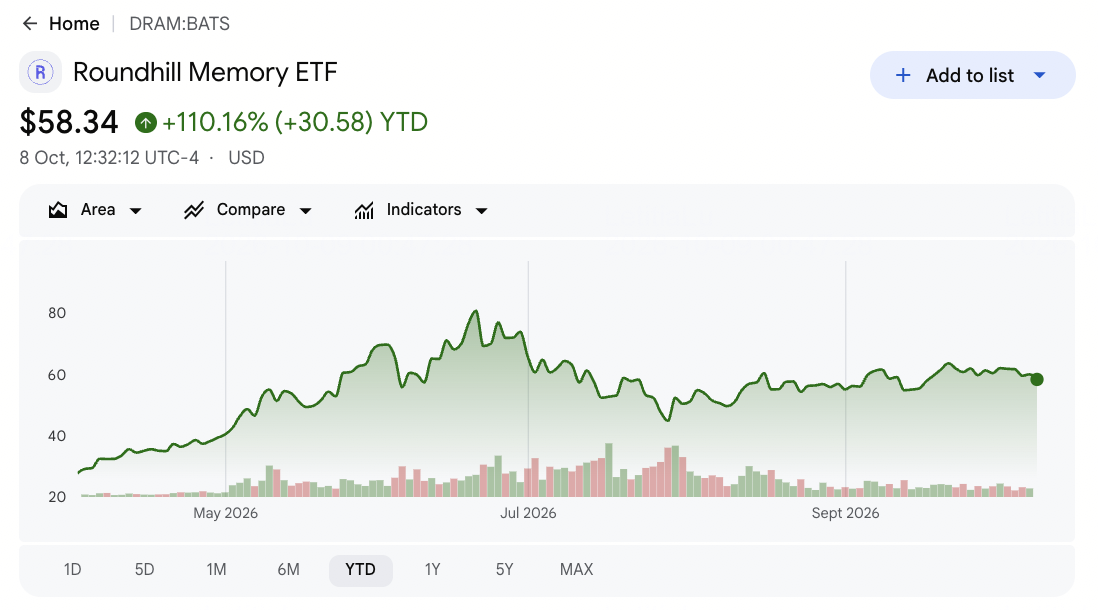
- Expense Ratio: 0.65%
- 2026 Return Since Launch: 110.16%
- Core Exposure: Global memory and storage companies
- Portfolio Role: Focused AI memory and storage exposure
DRAM is an actively managed ETF launched in April 2026, targeting companies that produce high-bandwidth memory (HBM), DRAM, NAND, and storage technology used in AI and data-intensive computing. The fund uses both direct equity positions and total return swaps, with Micron, Samsung Electronics, and SK hynix accounting for nearly three-quarters of its disclosed exposure. Its 114.41% return from April 2 through October 6 reflects strong momentum in AI memory, but investors should consider its concentrated holdings, higher expense ratio, short performance history, and sensitivity to memory pricing and semiconductor supply cycles. (Source: roundhillinvestments.com)
Read More: Roundhill Memory ETF (DRAM) Forecast 2026: Can AI Memory Demand Push DRAM Toward $75?
| Top Holdings / Exposures | Ticker | Portfolio Weight |
| Micron Technology | MU | 25.81% |
| Samsung Electronics | 005930:KRX | 25.04% |
| SK hynix | 000660:KRX | 23.99% |
| SanDisk | SNDK | 5.21% |
| Kioxia Holdings | 285A:TYO | 4.36% |
8. Roundhill Magnificent Seven ETF (MAGS)
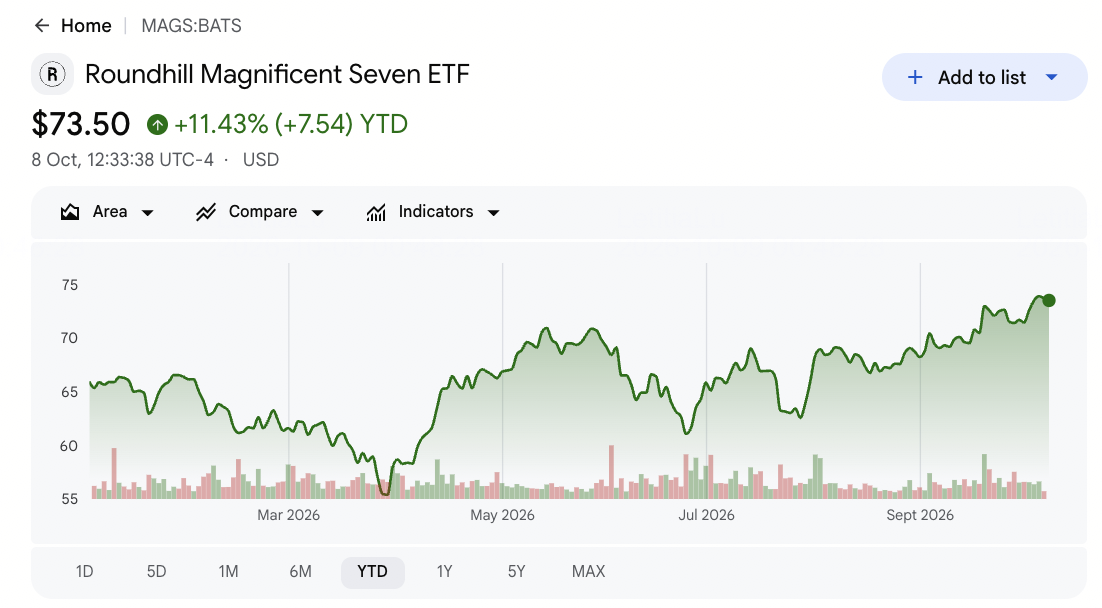
- Expense Ratio: 0.30%
- 2026 YTD Return: 11.43%
- Core Exposure: Alphabet, Amazon, Apple, Meta, Microsoft, NVIDIA, and Tesla
- Portfolio Role: Concentrated mega-cap technology and growth exposure
MAGS provides roughly equal-weight exposure to the seven companies commonly known as the Magnificent Seven. Its actively managed strategy rebalances quarterly, keeping each company closer to a one-seventh allocation rather than allowing the largest companies to dominate as they would in a market-cap-weighted index. MAGS returned 12.04% YTD through October 6. For beginners, it offers a convenient way to hold major technology leaders through one fund, but its concentrated structure and substantial overlap with VOO, VTI, and QQQ should be considered before adding it to an existing portfolio. (Source: roundhillinvestments.com)
| Top Holdings | Ticker | Portfolio Weight |
| Meta Platforms | META | 14.34% |
| NVIDIA | NVDA | 14.33% |
| Alphabet | GOOGL | 14.32% |
| Apple | AAPL | 14.29% |
| Tesla | TSLA | 14.27% |
| Microsoft | MSFT | 14.25% |
| Amazon | AMZN | 14.24% |
How to Build a Diversified ETF Portfolio in 2026?
Building a diversified ETF portfolio starts with combining funds that serve different investment goals. Broad-market ETFs can provide a foundation for long-term growth, while Nasdaq, semiconductor, memory, and mega-cap technology ETFs add more targeted exposure. The key is to balance diversification, growth potential, costs, and concentration rather than simply holding more funds.
|
Investment Goal |
ETFs to Consider |
Why They May Fit |
|
Long-term portfolio building |
VOO, VTI |
Broad exposure, low fees, and diversification |
|
S&P 500 investing |
VOO, SPY |
Exposure to leading U.S. companies |
|
Technology and growth |
QQQ, QQQM |
Nasdaq-100 exposure, including major technology companies |
|
AI hardware and semiconductors |
SOXX, SMH |
Focused exposure to semiconductor and AI infrastructure growth |
|
AI memory and storage |
DRAM |
Targeted exposure to HBM, DRAM, NAND, and storage companies |
|
Mega-cap technology |
MAGS |
Roughly equal-weight exposure to the Magnificent Seven |
For beginners, broad-market ETFs can form the core of a portfolio, while sector and thematic ETFs can provide additional growth exposure. Before combining funds, compare their expense ratios, largest holdings, and sector weights to avoid excessive overlap. Regular contributions and periodic rebalancing can also help keep the allocation aligned with long-term investment goals.
How to Start Investing in U.S. ETFs on BingX
BingX Stock Trading is designed for users who want to buy and hold U.S. stocks and ETFs directly from the same account used for crypto. The process starts with account setup and funding, then moves into the Stocks market where an order can be placed and managed through the same interface.
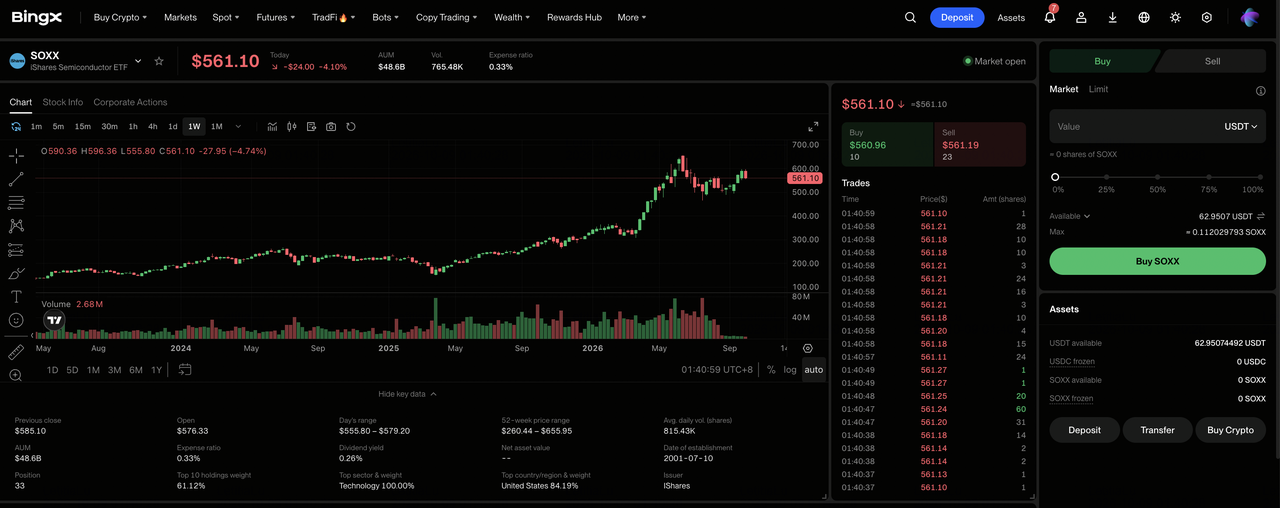
Step 1: Account setup and verification. Sign up or log in to BingX, complete KYC under "Profile → Identity Verification", then open "TradFi → Stocks" and accept the required Stock Trading Risk Disclosure.
Step 2: Prepare investment Fund. Make sure your Spot Account has enough USDT or USDC. Transfer funds from your Fund or Wealth Account if needed. Supported combined payments use the Spot balance first.
Step 3: Select your ETF. Open TradFi → Stocks and search the exact fund ticker such as SOX, DRAM or QQQ. Confirm availability and review its holdings, concentration, and expense ratio before selecting Buy.
Step 4: Choose the amount and order type. Enter the purchase amount or share quantity, select a market or limit order, and review the quoted price and spread before confirming. A market order submitted outside market hours waits until the market reopens.
Step 5: Review and manage your holdings. Open "Stocks → Positions" to check your shares and PnL, and use All Orders to review order status. Shares can be sold before settlement completes, and sale proceeds generally become withdrawable after T+1 settlement.
What Are the Risks of Investing in U.S. ETFs?
Even diversified U.S. ETFs can experience significant losses during market downturns. For investors considering broad-market, technology, semiconductor, and memory funds, portfolio overlap, industry cycles, expenses, and valuation can affect returns alongside long-term growth opportunities.
- Broad-market ETFs can still experience significant losses. VOO, VTI, and SPY spread exposure across many companies but remain sensitive to economic slowdowns, interest rates, and weaker earnings. Diversification reduces company-specific risk without eliminating market risk.
- Holding multiple ETFs can increase concentration. QQQ, MAGS, SOXX, and SMH may hold companies already represented in VOO or VTI. Combining funds can increase exposure to the same technology leaders and AI investment cycle.
- Semiconductor and memory cycles can trigger sharp declines. SOXX, SMH, and DRAM depend on AI infrastructure spending, chip demand, and memory pricing. Weaker investment, excess supply, export restrictions, or geopolitical tensions can affect several holdings at once.
- Fund expenses and structures can affect returns. Expense ratios reduce returns over time, while trading spreads and differences between market prices and net asset value (NAV) can add costs. Funds using swaps may also carry derivative and counterparty risks.
- Strong recent gains can increase correction risk. Semiconductor, AI hardware, and memory ETFs have rallied sharply in 2026, raising growth expectations. High valuations can amplify corrections, while newer funds such as DRAM have limited performance histories across market cycles.
Final Thoughts
U.S. ETFs offer investors flexible ways to access the stock market, from broad exposure through the S&P 500 and total-market funds to more targeted opportunities in technology, AI hardware, semiconductors, and memory. Broad-market ETFs can provide a foundation for long-term investing, while growth and thematic funds allow investors to increase exposure to specific industries. Understanding their holdings, costs, and concentration helps determine how each ETF can contribute to a diversified investment strategy.
For beginners, building a successful ETF strategy starts with choosing funds that match their investment goals, time horizon, and risk tolerance. Regular contributions, reinvesting eligible distributions, and reviewing portfolio allocations can support long-term accumulation. With BingX Stocks Trading, eligible users can also buy selected U.S. ETFs using USDT or USDC, making it easier to build traditional market exposure alongside existing crypto holdings.
Related Reading
- What Is BingX Stocks Trading? A Beginner's Guide to Trading U.S. Stocks and ETFs With Crypto
- How to Buy U.S. Stocks on BingX With USDT or USDC: A Beginner's Guide
- Top 10 AI Infrastructure Stocks to Buy in 2026: Chip Manufacturing and Design Leaders
- Top 7 U.S. Stocks to Watch in 2026 and How to Buy on BingX
- BingX U.S. Stocks Trading vs. Stock Perpetuals: What Are the Key Differences?
