

In crypto trading, the challenge isn’t just spotting price moves; it’s knowing when those moves are strong enough to act on. Many traders enter too early and get caught in false breakouts, while others wait too long and miss the momentum entirely.
The Donchian Channel offers a way to cut through that uncertainty. It doesn’t try to predict the future; instead, it frames the market’s recent behavior so traders can react with more confidence. By showing where price has stretched to its recent extremes, it helps traders identify moments when the market might be ready to run.
This guide unpacks how the Donchian Channel works, why it’s widely used by trend-followers, and how you can apply it to catch cleaner moves in the volatile world of crypto.
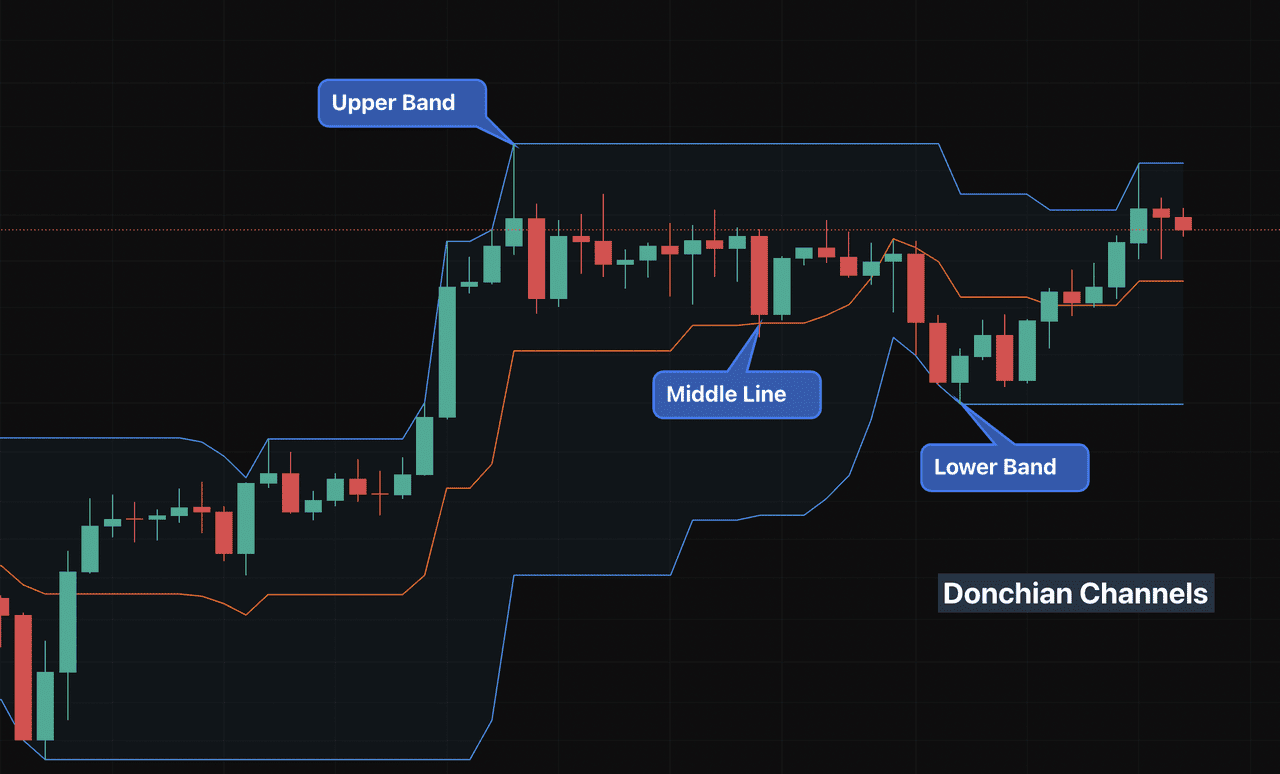
What Is the Donchian Channel?
The Donchian Channel is a chart indicator that shows the highest high and lowest low over a set number of periods, creating a visible price range. It’s made up of three lines:
• Upper band – the highest price reached during the selected period, which can be set to any timeframe (e.g., 20 days, 20 hours, or even 20 minutes, depending on your chart).
• Lower band – the lowest price reached during the selected period on the chosen timeframe.
• Middle line – the average of the upper and lower bands, also calculated over the same selected timeframe.
Source: BTC/USDT on BingX spot market
In crypto trading, the period often used is 20 days, but it can be adjusted based on your strategy. The idea is simple: when price breaks above the upper band, it may signal strength; when it falls below the lower band, it may signal weakness.
By plotting recent extremes directly on the chart, the Donchian Channel makes it easier to see whether the market is breaking into new territory or staying within its range.
How Donchian Channels Work
The Donchian Channel acts as a moving boundary for price action. Its upper and lower limits shift whenever the market sets a new high or low within your chosen timeframe, making it a real-time reflection of the most aggressive buying and selling activity.
The channel expands during volatile periods and contracts when the market is stable. A sudden widening often means volatility is picking up, while a narrowing can signal a pause before the next move.
This dynamic behavior makes the Donchian Channel more than just a range marker, it’s a way to track market energy and spot conditions where breakouts or reversals are more likely.
Key Trading Signals to Know From Donchian Channels
The Donchian Channel’s signals come from how price interacts with its upper and lower boundaries in real time. Since the bands reflect the highest and lowest prices of your chosen period, price rarely “sits” outside the channel once a candle closes. Breakout signals are best observed as they happen before the bands update.
Main signals to watch:
• Price pushing above the current upper band: This happens intraday when price trades higher than the previous highest high. If the breakout holds until the candle closes, the upper band will move up to match the new high. This can indicate bullish strength if confirmed by volume and trend direction.
• Price dipping below the current lower band: The opposite setup, where price breaks the previous lowest low before the band updates. This can hint at bearish pressure when supported by other indicators.
• Narrowing channel width: A sign of reduced volatility, often before a breakout.
• Widening channel width: Suggests volatility is increasing, common during strong trends or after major news.
• Price crossing the middle line: Movement above the midpoint can hint at a shift toward buyers, while movement below it may point toward sellers.
Important for traders: Unlike Bollinger Bands, where price can visibly close outside the bands, Donchian Channels adjust to include any new high or low. On historical charts, you won’t usually see candles outside the channel, breakouts are most visible in live market conditions.
Popular Donchian Channel Strategies in Crypto Trading
1. Use Donchian in Breakout Trading
A breakout above the upper band suggests buyers are pushing beyond the highest price of the selected period, while a move below the lower band points to sellers breaking past recent lows. Traders can enter long positions on an upper band breakout or short positions on a lower band breakout, ideally confirmed by strong volume or a trending market.
Stop-loss orders are often placed just inside the opposite band to limit losses on failed moves. Profit targets can be set using a fixed risk-to-reward ratio (e.g., 1:2) or by exiting when reversal signals appear.
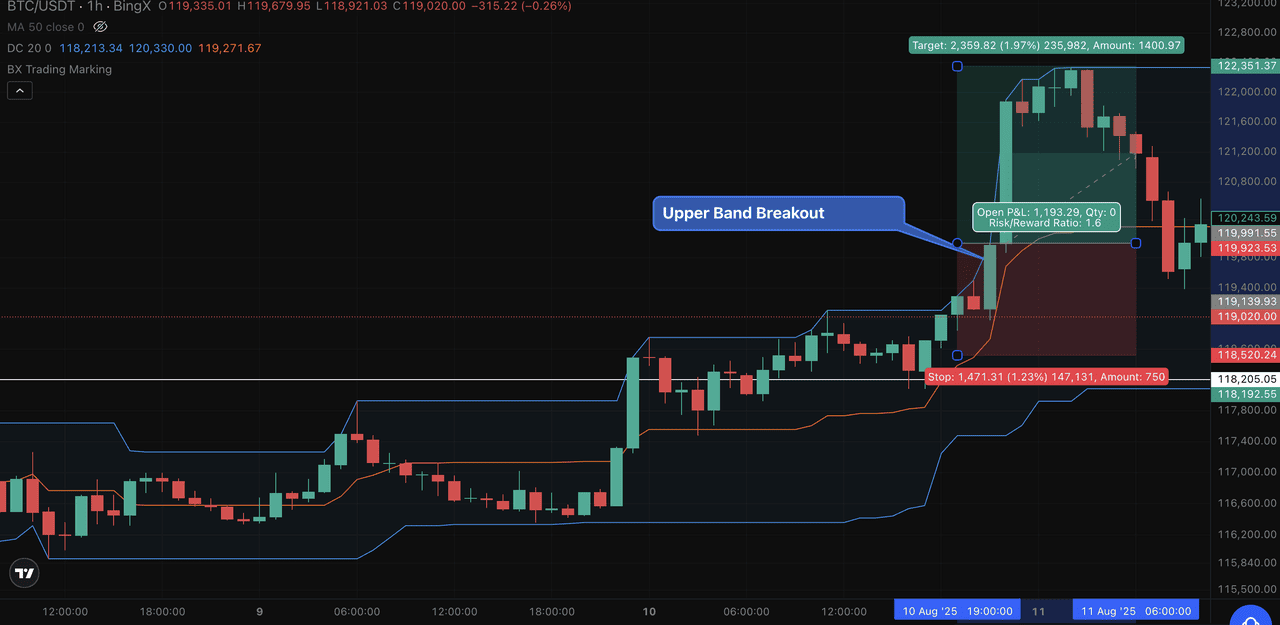
Source: BTC/USDT on BingX spot market
On the BTC/USDT chart above, a bullish engulfing candle formed, immediately followed by another bullish engulfing candle. This created a strong bullish setup for breaking the upper Donchian band. In a live market, before the indicator adjusted to the new high, price would have clearly appeared above the channel, making the breakout easy to spot in real time.
In this scenario, the ideal entry would have been as price moved above the recent high near $119,400. The stop-loss could be placed just below the lower band at around $118,205 to protect against a false breakout. The take-profit target, as per the chart, was set near $122,351, aligning with a reward-to-risk ratio of approximately 1.6. This provided a structured trade plan that combined clear breakout confirmation with disciplined risk management.
2. Middle Band Trading
The middle band, calculated as the average of the upper and lower bands, can act as a quick bias filter. A price move above the middle band may suggest looking for long opportunities, while a move below it can signal short setups.
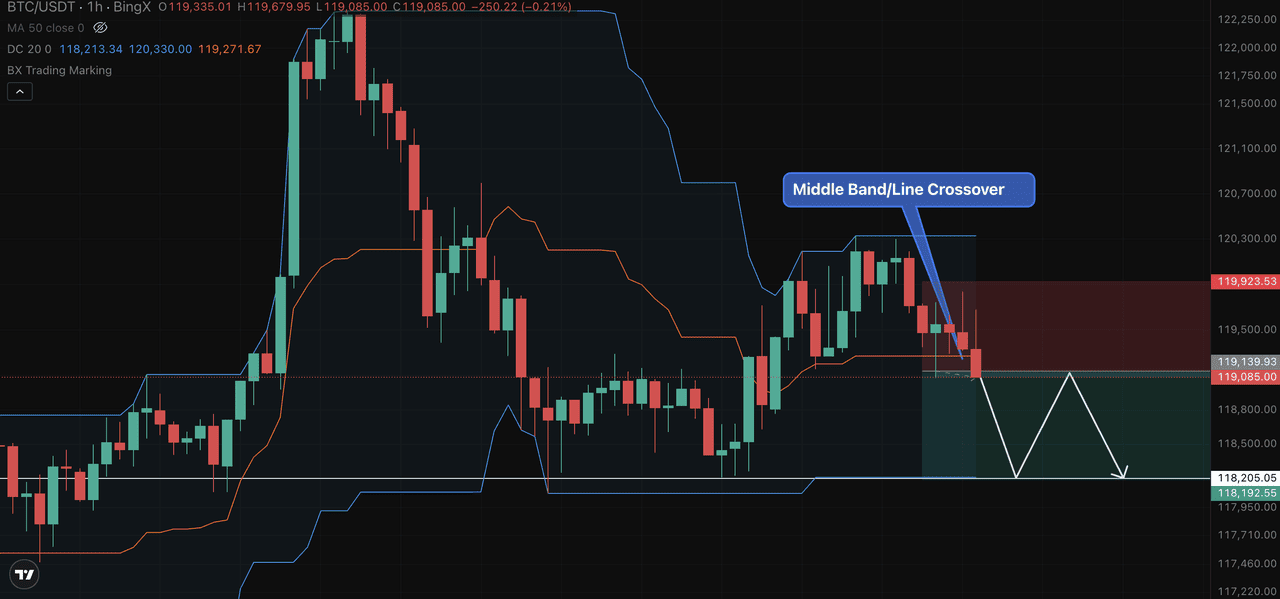
Source: BTC/USDT on BingX spot market
On the BTC/USDT chart above, the “Middle Band/Line Crossover” marks the point where price dropped from above to below the orange middle band. This crossover suggested that sellers were gaining control, making it a potential short setup.
In this case, a trader could have entered a short position at the crossover, placed a stop-loss just above the recent swing high near $119,925, and targeted the lower band at around $118,200 as the first take-profit level.
This approach aims to catch directional shifts earlier than waiting for a breakout of the upper or lower band, though it may also produce more false signals in sideways markets.
Donchian Channels vs. Bollinger Bands: What are the Key Differences
While Donchian Channels and Bollinger Bands may look similar on a chart, their logic and purpose are different.
• Calculation method: Bollinger Bands use a moving average (usually 20 periods) as the center line and plot the upper and lower bands at a set number of standard deviations from that average. Donchian Channels ignore averages and instead plot the highest high and lowest low over the selected period.
• Price behavior: In Bollinger Bands, price can close and remain outside the bands for extended periods during strong trends. In Donchian Channels, the bands instantly shift to include new highs or lows, so price rarely appears outside them after a candle closes.
• Purpose: Bollinger Bands are designed to measure volatility and identify overbought or oversold conditions. Donchian Channels are focused on defining breakout levels and market range extremes.
• Best use case: Bollinger Bands work well for spotting mean-reversion or volatility squeezes, while Donchian Channels excel in trend-following and breakout strategies.
How to Combine Donchian Channels With Other Indicators
Donchian Channels work best when paired with other tools that confirm the market’s direction or filter out false signals. Since the channel only shows price extremes, adding indicators that measure momentum, trend strength, or volatility can help traders avoid chasing moves that quickly reverse.
Common combinations include:
• Moving Averages: Adding a 50-period EMA or SMA can help confirm trend direction. For example, only take upper band breakouts if the price is also above 50 EMA, and lower band breakouts if the price is below it.
• Relative Strength Index (RSI): Helps spot overbought or oversold conditions. A breakout that aligns with RSI moving out of overbought or oversold zones can be stronger.
• Volume Indicators: Breakouts supported by above-average volume tend to be more reliable. Low-volume breakouts are more prone to failing.
• MACD (Moving Average Convergence Divergence): Useful for confirming momentum. A bullish MACD crossover before an upper band breakout can strengthen the signal.
By combining Donchian Channels with these tools, traders can build higher-probability setups. For example, if BTC breaks above the upper band, is trading above the 50 EMA, and volume spikes, that’s a stronger confirmation than relying on the channel alone.
Limitations of Donchian Channels
Donchian Channels offer traders valuable insights into market volatility and trend direction, but like any technical tool, they come with some drawbacks that should be understood before use.
1. Provides no trend direction on its own – The indicator only shows price ranges and volatility, so you need other tools to confirm whether the market is moving up or down.
2. Can produce false signals in choppy markets – In sideways or low-volume markets, the channels may trigger buy or sell signals that don’t lead to sustained moves.
3. Reacts to past price, not future predictions – Donchian Channels are based on historical highs and lows, meaning they lag behind sudden market changes.
4. Breakouts may not be visible on historical charts due to band adjustments – Once the channel recalculates, past breakout points may no longer be clear, making it harder to review trade setups later.
Conclusion
Donchian Channels give traders a clear view of where the market has recently stretched and where it might break next. They’re simple, visual, and adaptable, but they’re not magic on their own. Watch them in real time, combine them with other confirmations, and use them to plan trades with clear entries, stops, and targets. In the fast pace of crypto, that structure can be the difference between chasing moves and trading with confidence.
Related Reading
3. Simple Moving Average(SMA) vs Exponential Moving Average(EMA) in Crypto Trading: Differences to Know
FAQ – Donchian Channels in Crypto Trading
1. What is the Donchian Channel in crypto trading?
The Donchian Channel is a technical indicator that plots the highest high and lowest low over a set number of periods, helping traders spot breakouts and market ranges.
2. How is the middle band of the Donchian Channel calculated?
It’s the average of the upper and lower bands, giving a midpoint that can be used as a quick bullish or bearish bias filter.
3. Can the price close outside the Donchian Channel?
Not in historical charts. The bands adjust to include new highs or lows, so breakouts are most visible in real-time trading before the bands update.
4. What’s the best period setting for Donchian Channels in crypto?
A 20-period setting is common, but traders adjust it depending on their timeframe, strategy, and market volatility.
5. How do Donchian Channels differ from Bollinger Bands?
Bollinger Bands are based on a moving average and standard deviation, while Donchian Channels use only the highest and lowest prices in a set period, making them more rigid and breakout-focused.
