
In crypto futures trading, price alone does not show how much participation is behind a move. Traders want to know whether money is entering, exiting, or simply rotating. Open interest answers that by measuring how many contracts remain active.
Tracking open interest helps reveal if new positions are building, if positions are being closed, or if sentiment is shifting. Used well, it can separate durable trends from short-lived spikes.
This article explains what open interest is in crypto futures, how it changes in practice, how it differs from trading volume, and how to combine it with indicators such as the Relative Strength Index, moving averages, support and resistance, trading volume, and funding rates.
What Is Open Interest(OI) in Crypto Futures Trading?
Open interest (OI) in crypto futures is the total number of contracts that remain active in the market. These contracts have not yet been settled or closed, which means they are still part of open positions driving market activity. Unlike trading volume, which resets every day to show how many contracts were exchanged during a period, open interest is cumulative. It reflects how many contracts are currently outstanding.
A simple example makes this clearer. Imagine Trader A opens a long position in Bitcoin futures, and Trader B takes the opposite side with a short position. Together, they create one new contract, so open interest increases by one. Later, if both traders decide to close their positions, that contract is removed and open interest decreases by one.
Because contracts are constantly being opened and closed, open interest rises and falls throughout the day. Rising open interest usually shows more positions are being opened — often meaning new money is entering the market. Falling open interest indicates contracts are being closed, which may suggest that momentum is slowing down.
How Open Interest Works in Futures Trading
Open interest rises when new contracts are created and falls when existing contracts are closed. If contracts simply change hands between traders, open interest remains unchanged.
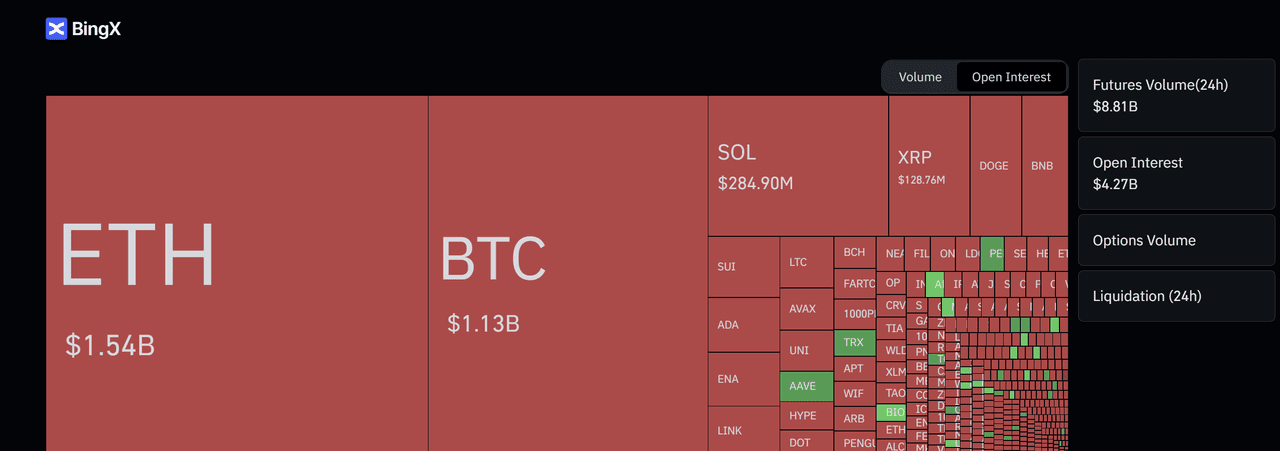
The BingX data helps illustrate this.
Ethereum (ETH) futures hold about 1.54 billion dollars in open interest, while Bitcoin (BTC) stands at 1.13 billion dollars. Together, they make up a large share of the total 4.27 billion dollars in open interest across the platform.
Open Interest - Source: Coinglass
Now consider two scenarios. If ETH open interest increases from 1.54 billion to 1.7 billion dollars while price also rises, it shows that new contracts are being opened and fresh capital is entering the market, a sign of growing participation.
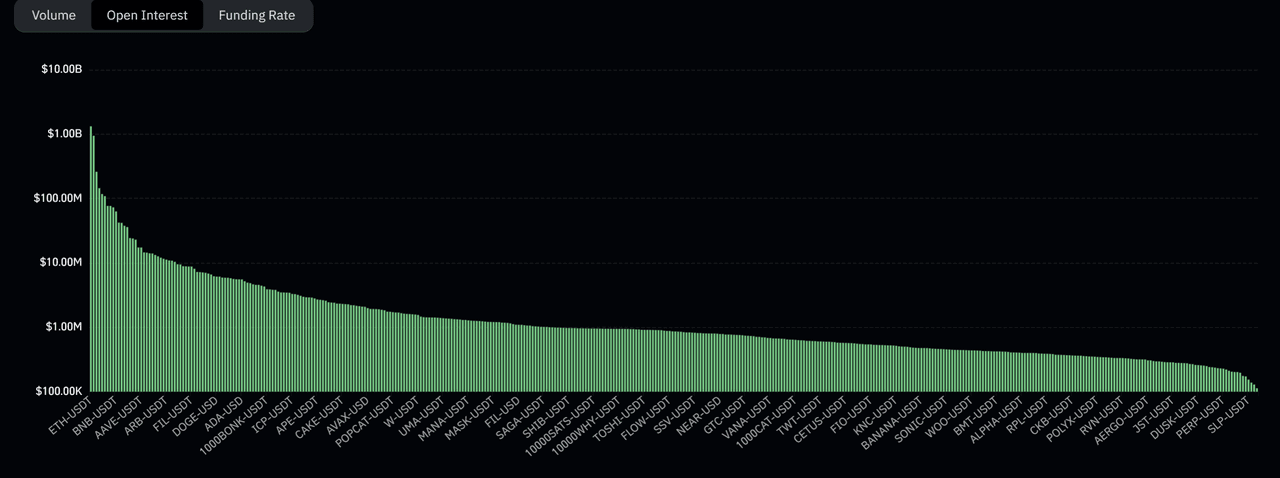
Open Interest By Pairs - Source: Coinglass
By contrast, if BTC open interest drops from 1.13 billion to below 1 billion dollars while the price continues to climb, it suggests that contracts are being closed. That often means short sellers are exiting, which can push the price up temporarily, but without new positions being added, the move may lack lasting strength.
This constant change in open interest gives traders insight into how much conviction is behind a price trend and whether participation is growing or shrinking.
Open Interest vs. Trading Volume in Futures
Open interest and trading volume often get confused, but they measure different things. Trading volume shows how many contracts were bought or sold during a given period. Open interest shows how many contracts remain open after that trading.
Traders often read them together:
• Price Up + Volume Up + Open Interest Up: Trend is strong, often a good sign to ride the move with the trend.
• Price Up + Volume Up + Open Interest Down: Shorts are being forced out, rally may not last. Caution before buying.
• Price Down + Volume Up + Open Interest Up: Fresh short positions entering, bearish momentum is building.
• Price Down + Volume Down + Open Interest Down: Traders closing out, trend may be weakening or ready to reverse.
In short, volume shows short-term activity, while open interest shows lasting exposure. A market with both high volume and rising open interest usually signals stronger participation than one where open interest stays flat.
Why Open Interest Matters in Crypto Futures Trading
Open interest matters because it shows how much participation is behind a price move. Price alone can rise or fall, but open interest reveals whether traders are adding new contracts, closing existing ones, or simply shifting positions.
If price climbs while open interest also rises, it indicates that new money is entering and the trend has stronger support. If price rises while open interest falls, it suggests contracts are being closed, often short positions, which may lift price temporarily but without fresh commitment.
For traders, open interest acts as a sentiment gauge. It helps confirm whether a trend is strong, losing momentum, or at risk of reversal, making it an important part of futures analysis.
How to Combine Open Interest with Other Technical Indicators
Open interest is powerful on its own, but it becomes even more valuable when combined with other indicators. Together, they give traders a clearer view of whether a trend has real strength or if it might be running out of steam.
1. Relative Strength Index (RSI) with Open Interest
The Relative Strength Index shows when a market is overbought (too many buyers) or oversold (too many sellers). Open interest shows how many contracts are still active. When you combine them, you can see not only if the market is stretched, but also whether traders are still adding new positions or backing away.
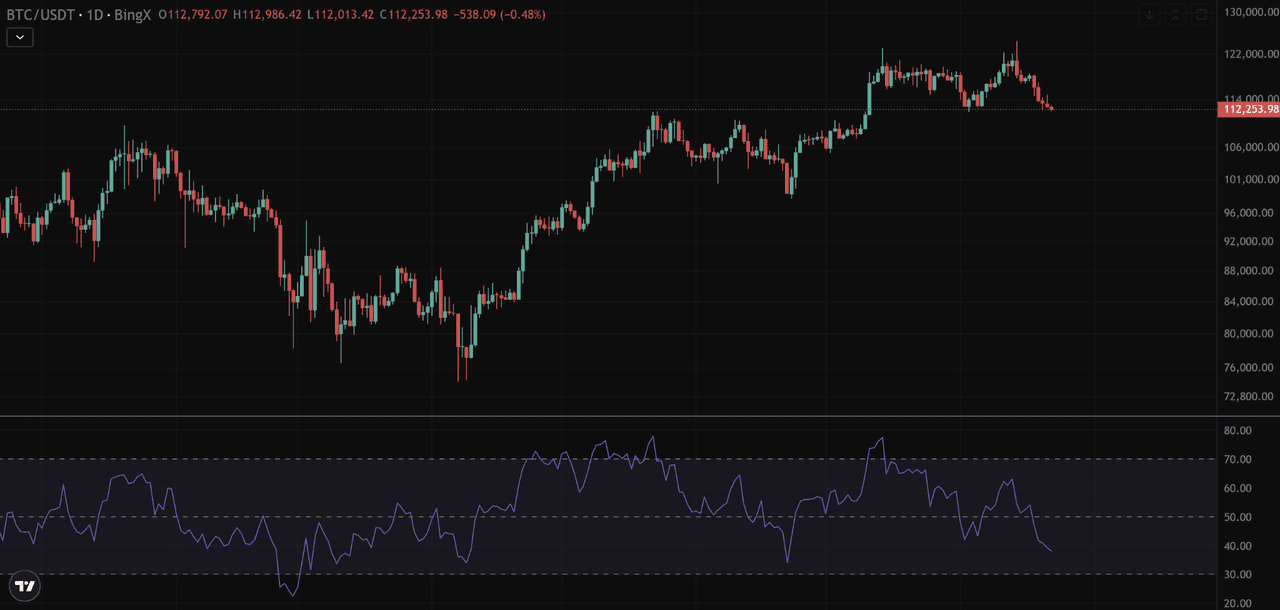
Source: BTC/USDT Perpetual Futures Contract
In the first chart, Bitcoin is trading around 112,253 dollars, and the RSI has fallen below the 50 mark, heading closer to oversold territory. This suggests selling pressure has been increasing.
Open Interest Rate - Source: Coinglass
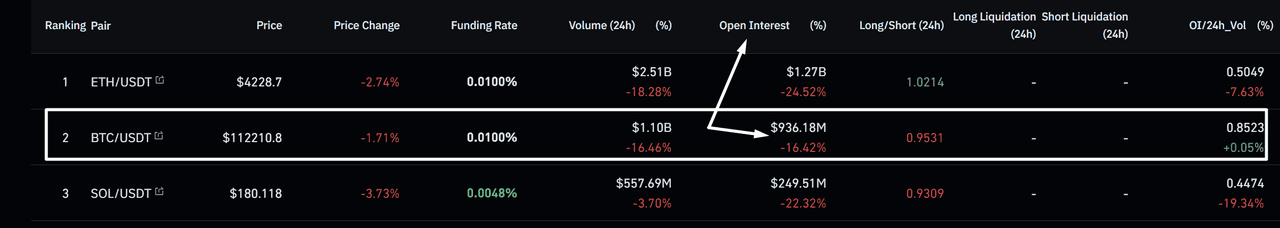
Now look at the BingX data in the second screenshot. Bitcoin’s open interest is 936 million dollars, down more than 16 percent in 24 hours. This tells us many traders have closed their futures positions while the price is sliding lower.
For a trader, this combination has a clear message:
• The RSI points to weakening momentum.
• The drop in open interest confirms that traders are not adding new short positions aggressively; instead, they are closing trades.
Together, these signals suggest that while Bitcoin is under pressure now, selling may not have firm conviction behind it. A beginner could read this as a possible warning that the downtrend is losing strength and that price might find support soon.
2. Moving Averages with Open Interest
Moving averages smooth out price action and help traders see the overall trend. The 50-day moving average (red line) often reflects short- to mid-term trend direction, while the 200-day moving average (blue line) shows the longer-term picture.
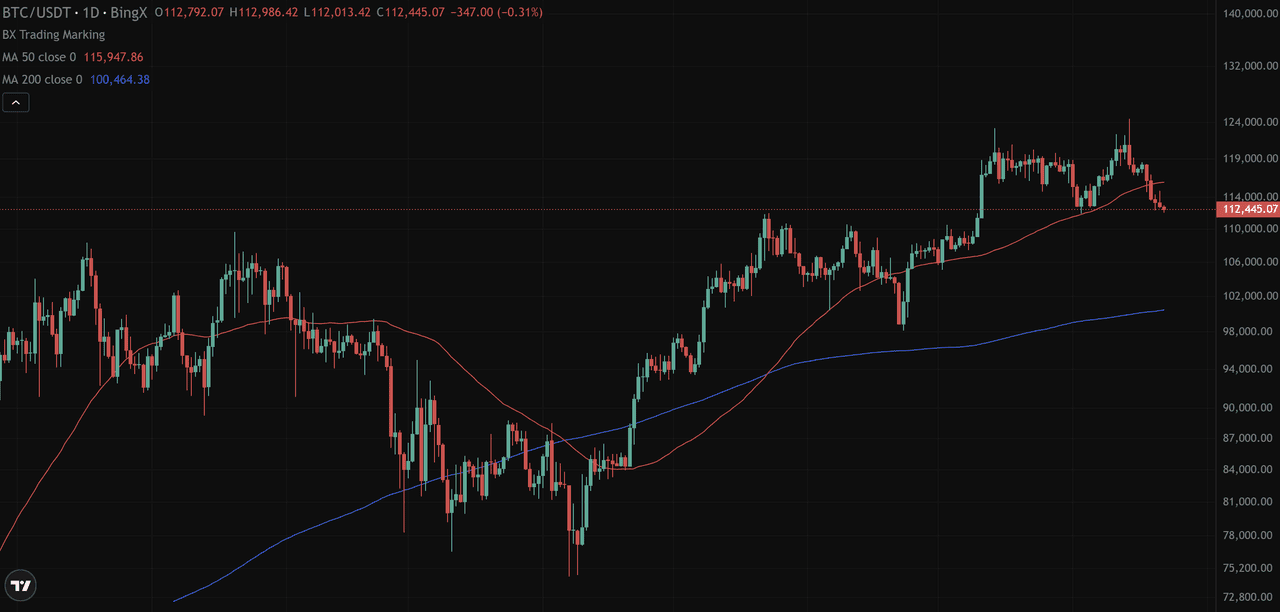
Source: BTC/USDT Perpetual Futures Contract
In the first chart, Bitcoin is trading around 112,445 dollars. It is still above the 200-day moving average (near 100,464 dollars), which suggests the long-term trend is intact, but it has slipped below the 50-day moving average (around 115,947 dollars). This signals weakness in the shorter-term trend.

Open Interest Rate - Source: Coinglass
Now look at the BingX data in the second screenshot. Bitcoin’s open interest has dropped to about 936 million dollars, down more than 16 percent in 24 hours. That means many traders closed their positions while price moved lower.
For a trader, combining these signals gives a clear story:
• Price slipping under the 50-day moving average shows the short-term trend is weakening.
• Falling open interest confirms traders are closing positions rather than adding new ones, which means the breakdown is not strongly supported by fresh money.
In simple terms, Bitcoin losing the 50-day moving average would normally be a bearish sign. But because open interest is also falling, it suggests the move may not have much conviction behind it. This could mean the selling pressure is fading, and the 200-day moving average becomes the next key level to watch.
3. Support and Resistance Levels
Support and resistance levels show where the price has historically struggled to move past. Open interest helps confirm whether traders believe those levels will hold or break.
In the chart, Bitcoin is trading around $112,360, sitting right at a major support area near $111,800. Price has tested this level multiple times before, making it a critical zone for traders.
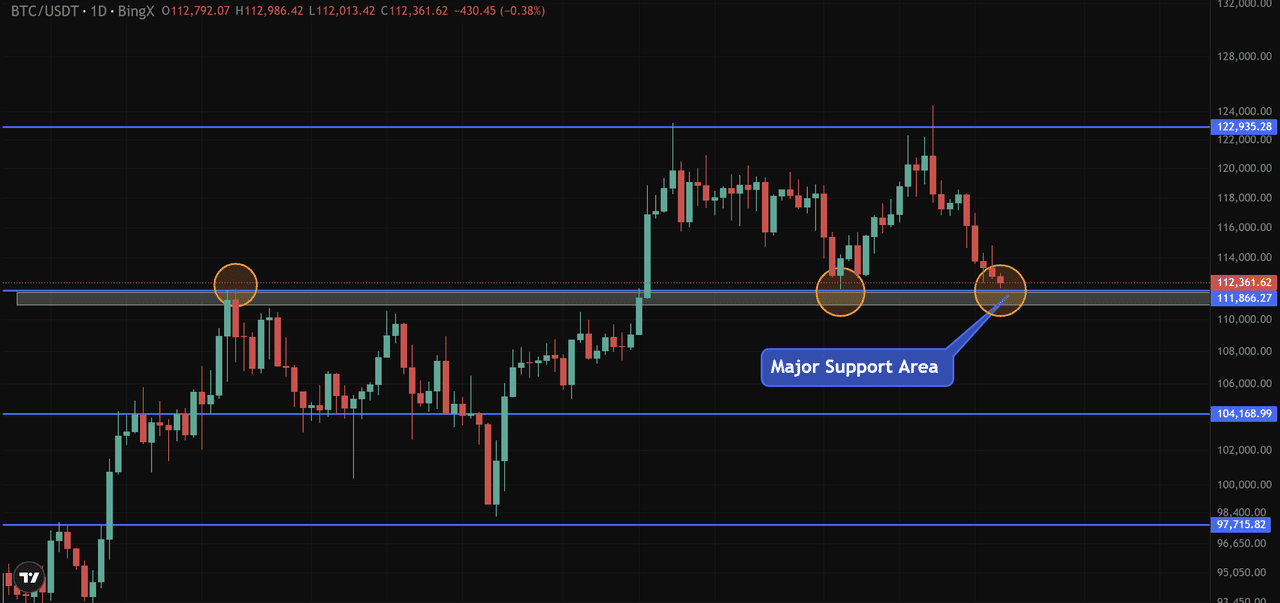
Source: BTC/USDT Perpetual Futures Contract
Let's continue to use the same BTC/USD open interest data. Bitcoin futures open interest recently dropped to about 936 million dollars, down 16 percent in 24 hours. This tells us many positions were closed as Bitcoin slid into support.
Here’s how to read it:
• If Bitcoin holds above this $111,800 support and open interest starts rising again, it would show that buyers are stepping in with confidence, opening new long positions. That would strengthen the case for a bounce.
• But if price hovers at support while open interest continues to fall, it suggests traders are backing out rather than defending the level. In that case, the support becomes weaker, and a breakdown to lower zones like 104,000 dollars could follow.
In short, combining support/resistance with open interest tells traders whether a level is being defended with real money, or whether positions are being closed and conviction is fading.
4. Trading Volume with Open Interest
Volume shows how much trading activity took place, while open interest reveals how many of those contracts remain open. Looking at both together helps traders judge whether market moves are supported by lasting positions or just short-term activity.
The BingX data makes this clear. In the Volume chart, Ethereum (ETH) futures led with $2.92 billion traded in 24 hours, followed by Bitcoin (BTC) at $1.32 billion and Solana (SOL) at $624 million. These figures reflect how active each market was during the day.
In the Open Interest chart, ETH shows $1.52 billion, BTC $1.13 billion, and SOL $282 million. These lower numbers highlight how many contracts stayed open after trading rather than being closed.
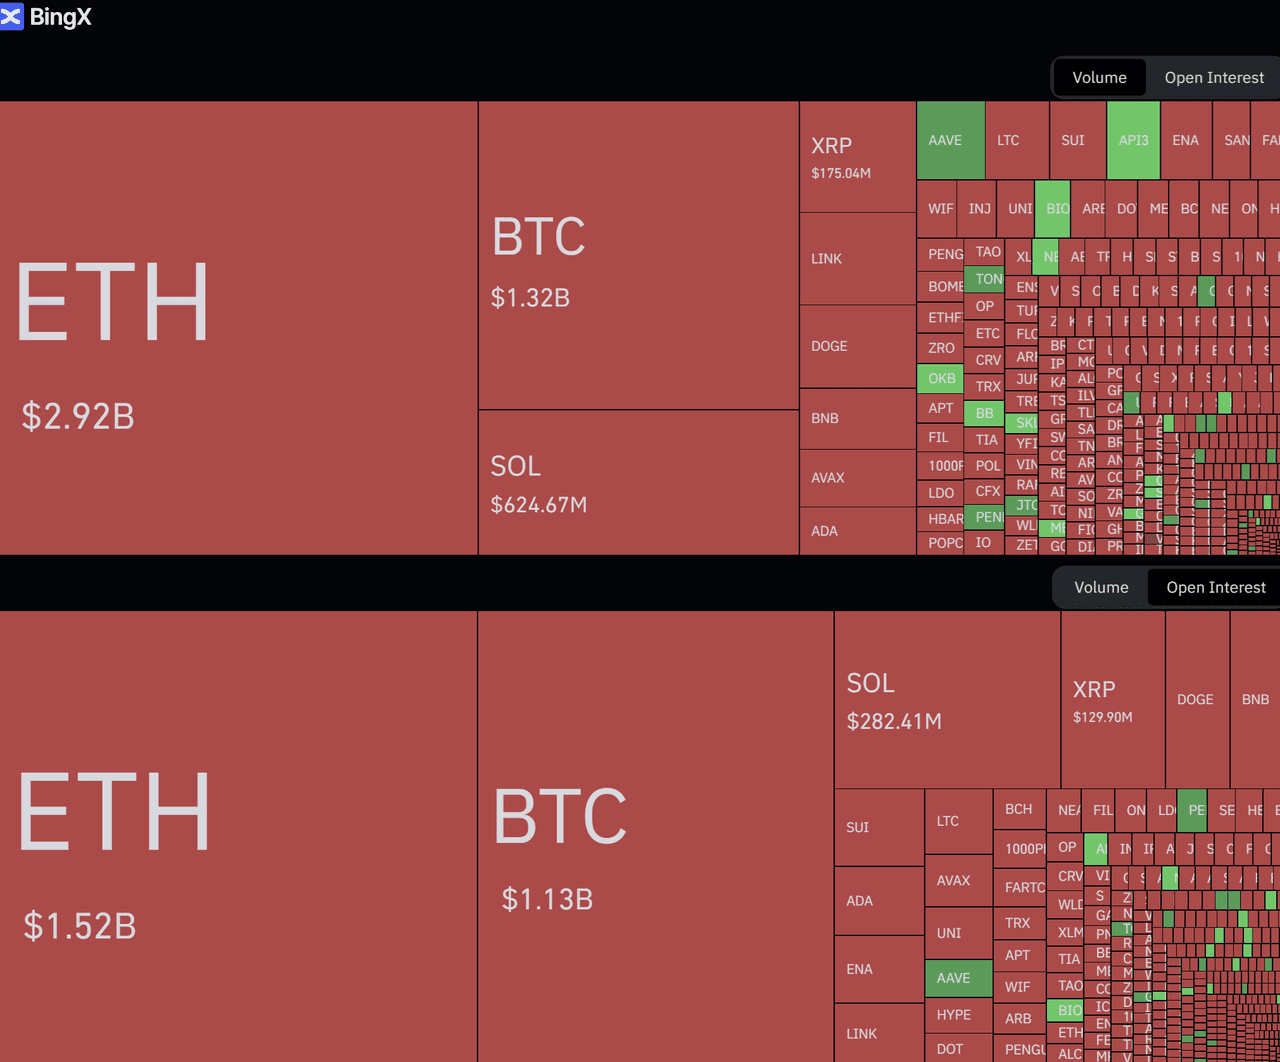
Open Interest Rate & Trading Volume - Source: Coinglass
Take ETH as an example. Ethereum futures recorded $2.92 billion in daily volume, but open interest was $1.52 billion. This means many traders entered and exited quickly, without leaving lasting positions. If ETH’s price was climbing during this time while open interest stayed flat, the rally may have been driven by short-term trading or liquidations rather than new positions being built.
On the other hand, if volume remained high and open interest increased from $1.5 billion to $1.8 billion, it would show that traders were not only active but also keeping contracts open. That indicates stronger participation behind the move, giving the trend more reliability.
By combining the two, traders can see whether heavy activity is supported by money staying in the market or whether it is simply fast turnover with less conviction.
5. Combine Funding Rates with Open Interest
In perpetual futures, funding rates are small payments exchanged between long and short traders to keep the contract price close to the spot market. A positive funding rate means long traders pay shorts, while a negative rate means shorts pay longs.
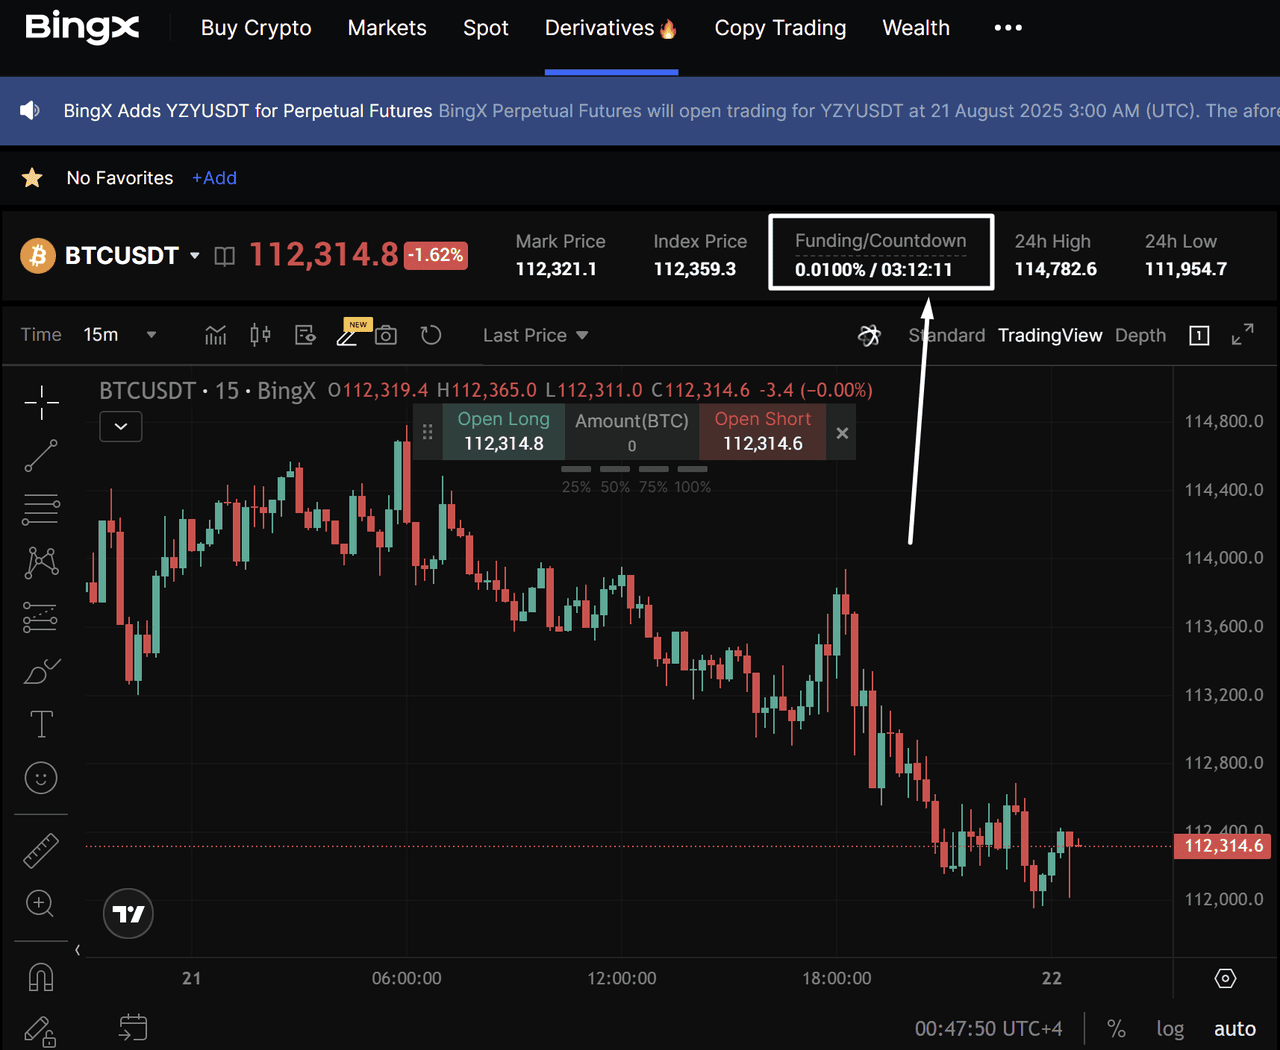
Source: BTC/USDT Perpetual Futures Contract
The chart shows Bitcoin trading around $112,314, with a funding rate of 0.0100%. This rate is positive, which tells us that long traders are currently paying shorts to hold their positions. It usually happens when more traders are leaning bullish.

Open Interest Rate - Source: Coinglass
Now connect this with the open interest data we looked at earlier, where Bitcoin open interest had dropped by 16 percent to about 936 million dollars. This means that while longs are paying a premium to shorts, many traders have been closing positions rather than adding new ones.
For traders, this creates an important clue:
• If funding rates stay positive and open interest rises, it means bullish positions are building aggressively. While this can push prices higher, it also creates the risk of a long squeeze if price suddenly drops and overleveraged longs are forced out.
• If funding rates are positive but open interest falls (like in this example), it suggests traders are pulling back. That means the bullish sentiment isn’t strongly backed by new money, and price may struggle to hold its level.
In this case, Bitcoin's price dropped from $114,700 to $112,300, while funding remained positive and open interest decreased, indicating that longs were paying to hold their bets, but the market wasn’t adding new contracts. That weakens the bullish case and explains why price drifted lower.
Limitations of Open Interest in Futures Crypto Trading
Open interest is useful, but it is not complete on its own. A rise in open interest shows that new contracts are being opened, but it does not reveal whether those contracts are long or short. Strong bullish and bearish bets both increase the number, so direction must be confirmed with other data.
It can also lag behind fast price moves. In volatile markets, open interest may shift after the move has already taken place, limiting its use as a real-time signal.
Finally, open interest is not uniform across exchanges. A drop on one platform might simply mean traders moved their positions elsewhere, not that overall sentiment weakened.
Because of these limits, traders rarely use open interest in isolation. It works best alongside price action, volume, funding rates, and other indicators.
Conclusion
Open interest is a core metric in crypto futures because it shows how many contracts remain active and how much participation supports a trend. On its own, it cannot show whether traders are long or short, but when paired with tools like volume, funding rates, moving averages, RSI, and support or resistance levels, it helps confirm whether momentum is building or fading.
The real value of open interest lies in context. It shows whether money is entering, leaving, or simply rotating in the market. Used with other indicators, it gives traders clearer signals and a stronger understanding of market dynamics.
Related Articles
FAQs on Open Interest (OI)
1. What is open interest (OI) in crypto futures?
Open interest is the total number of contracts in the futures market that remain open and have not yet been settled or closed.
2. How is open interest different from trading volume?
Volume shows how many contracts were traded during a specific period, while open interest shows how many contracts are still active after that trading.
3. Does rising open interest always mean the market will go up?
No. Rising open interest means more contracts are being opened, but they can be either long or short. It signals participation, not guaranteed direction.
4. Why does open interest sometimes fall when prices rise?
This usually means short sellers are closing positions. Closing shorts can push prices higher temporarily, but without new contracts being added, the move may lack strength.
5. Can open interest predict trend reversals?
Not by itself. But a sudden drop in open interest combined with weakening volume often signals that a trend is losing momentum and could reverse.
