
The inside bar pattern is one of the simplest yet most powerful candlestick formations in technical analysis. Commonly used in crypto trading, it helps traders spot moments of consolidation before a potential breakout. At its core, the pattern consists of two bars: the larger “mother bar” and a smaller “inside bar” that forms entirely within the range of the previous bar.
This setup reflects market indecision. Buyers and sellers temporarily pause, creating a tighter trading range. Once price breaks out of the inside bar’s range, it can signal either a continuation of the current trend or the start of a reversal.
Because of this flexibility, the inside bar candlestick pattern has become a key tool for traders looking to refine entry points, manage risk, and catch profitable breakout moves in trending markets.
What is an Inside Bar Pattern?
An inside bar pattern is a two-candle formation where the second candle, known as the inside bar, stays completely within the high and low range of the first candle, called the mother bar. This means the market’s trading activity has narrowed, showing a period of consolidation and indecision among buyers and sellers.
The psychology behind this setup is simple: when price compresses inside the mother bar’s range, market participants are waiting for confirmation before committing to the next move. This often leads to a sharp breakout once price escapes the inside bar’s boundaries.
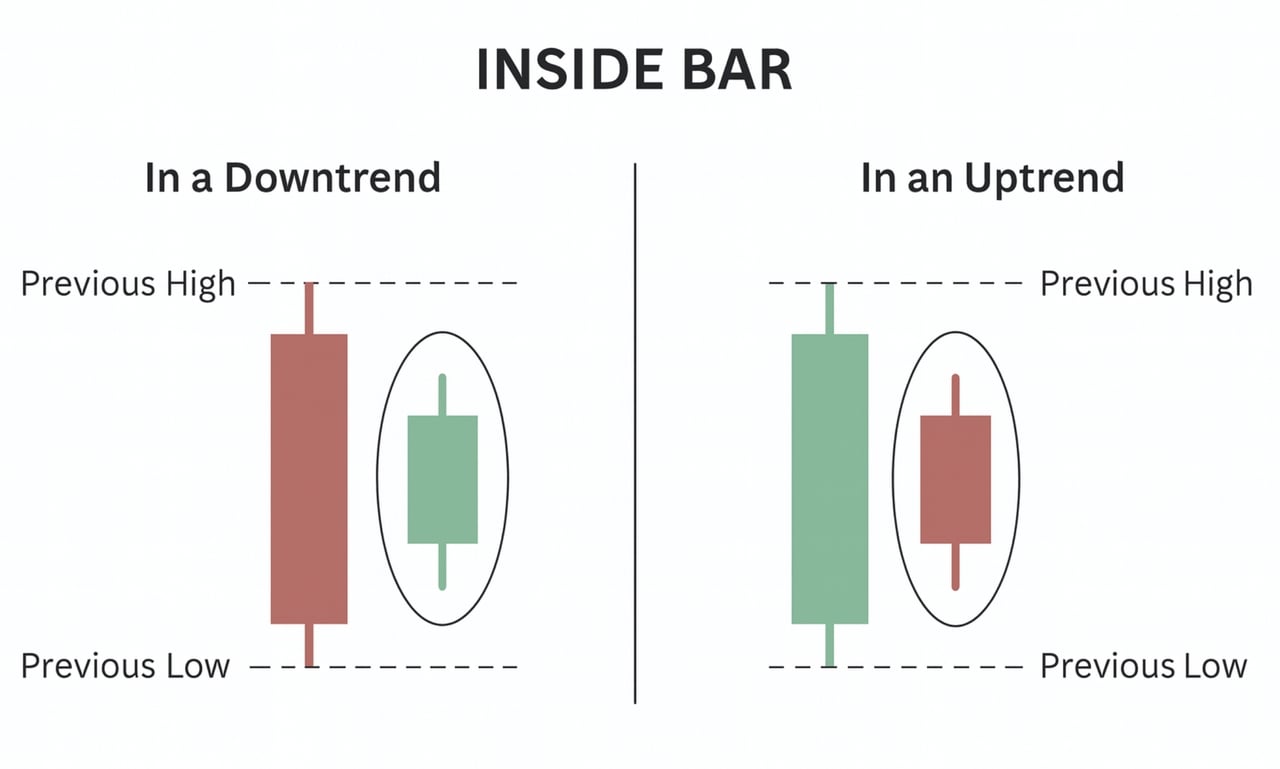
Inside bar candlestick patterns can appear anywhere on a chart, but they carry the most weight when they form at key support or resistance levels, or after a strong directional move. Traders usually interpret them in two main ways:
• Bullish inside bar suggests price may break above the mother bar’s high, continuing upward momentum.
• Bearish inside bar points to a potential break below the mother bar’s low, signaling selling pressure.
Because of their ability to highlight market consolidation, inside bar setups are especially valuable in trending markets, where traders look to join the dominant direction after a pause.
How Inside Bar Patterns Work
The inside bar signals a pause in market momentum, where price contracts within the range of the previous mother bar. This narrowing of price action acts like a period of “breathing room” in the market. After a strong move, traders step back to reassess, and the reduced volatility sets up conditions for the next breakout.
The pattern usually plays out in two ways:
Trend Continuation
In trending markets, an inside bar often points to a short consolidation before the trend resumes. For example, during a crypto uptrend, a bullish inside bar breakout above the mother bar’s high confirms that buyers remain in control.
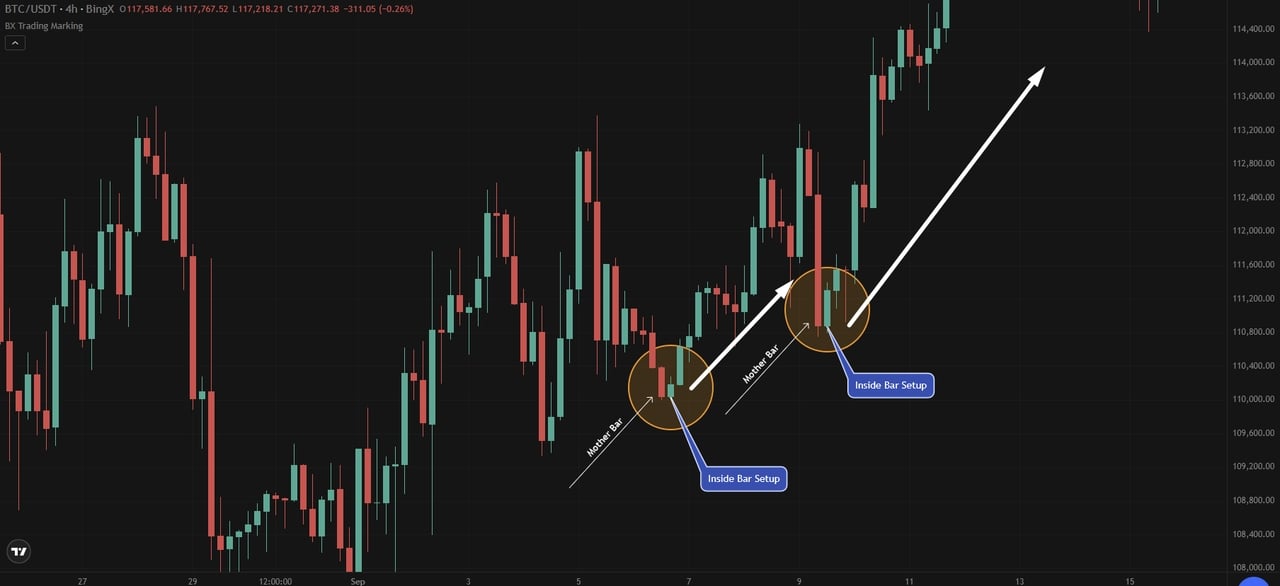
Source: BTC/USDT Trading Chart on BingX
On the BTC/USDT 4-hour chart, an inside bar setup appeared around $110,800–$111,200, inside the range of a bullish mother bar. When price broke above the inside bar’s high near $111,200, it confirmed the continuation of the uptrend.
A second setup followed at $112,000–$112,400. Once price cleared the high at $112,400, Bitcoin pushed toward $114,000 and beyond, showing how inside bars can help traders capture continuation moves in strong trends.
Trend Reversal
At the end of a trend, an inside bar can signal a potential shift in sentiment. If price breaks in the opposite direction, it may mark the start of a new move.
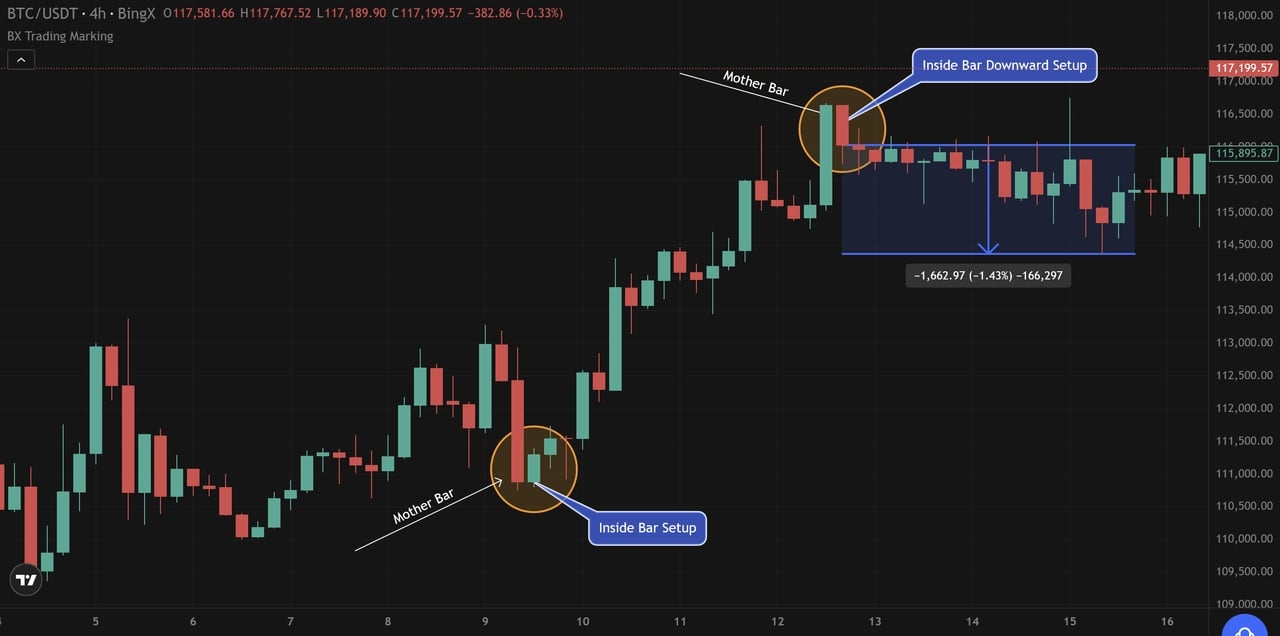
On the same BTC/USDT 4-hour timeframe, another inside bar formed near $116,800–$117,200, at the top of a strong rally. The high at $117,200 failed to break, and instead, price moved below the mother bar’s low around $115,800. This triggered a reversal setup that pulled Bitcoin down toward $114,500, highlighting selling pressure after consolidation.
Timeframe Matters
Inside bars that form on the 4-hour, daily charts or higher timeframes (like weekly) are generally more reliable than those on intraday charts. Shorter timeframes often produce false signals due to noise, while higher timeframes provide clearer insight into the market’s broader trend.
Traders usually confirm direction by watching whether price closes above the mother bar’s high or below its low, using that as a signal to enter trades.
Inside Bar Trading Strategies
Inside bars often act as a pause before the market resumes its direction. Continuation setups are most effective when they appear in strong trending markets.
1. Trading Trend Continuations
Inside bars often act as a pause before the trend resumes. Traders look for continuation setups in the direction of the prevailing trend.
How to trade it:
• Identify the trend: Confirm the market is moving clearly in one direction.
• Spot the inside bar: Look for the second candle forming fully within the mother bar’s range.
• Entry point: Place a buy order just above the mother bar’s high in an uptrend, or a sell order just below the mother bar’s low in a downtrend.
• Stop-loss: For bullish setups, place it just below the mother bar’s low; for bearish setups, just above the high.
• Profit target: Aim for the next resistance level in an uptrend, or the next support level in a downtrend.
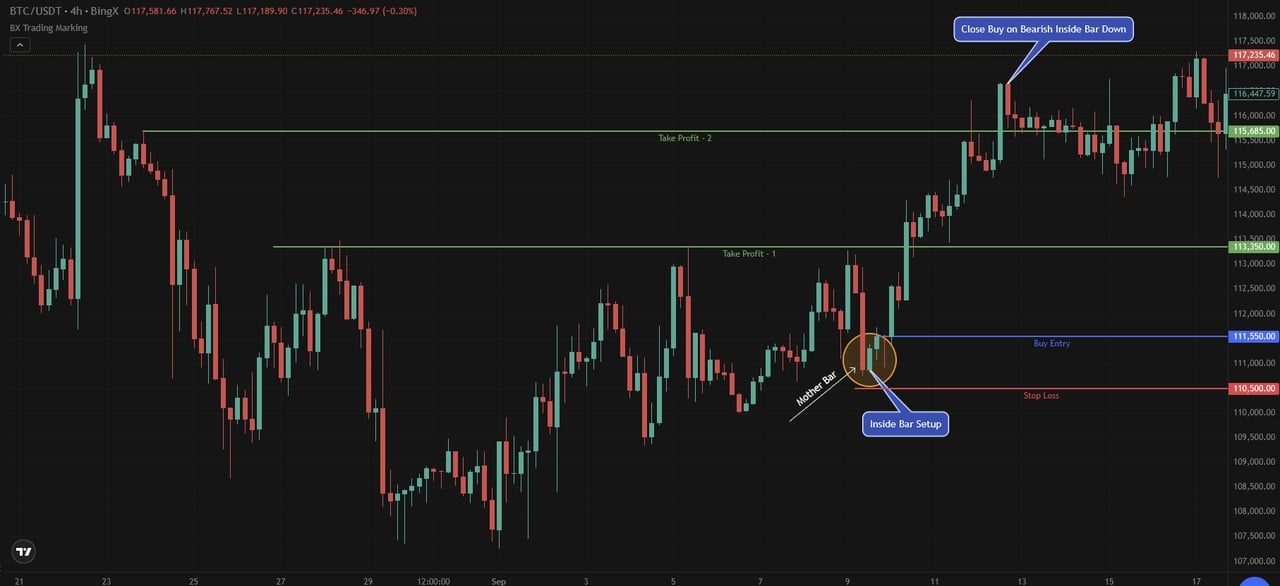
Source: BTC/USDT Trading Chart on BingX
On the BTC/USDT 4-hour chart, an inside bar setup formed near $111,550, with a stop-loss at $110,500. Once price broke the inside bar’s high, it rallied to the first target at $113,350, then extended toward $116,400 before a bearish inside bar signaled exit. This trade captured multiple profit targets while staying aligned with the trend.
2. Trading Trend Reversals
At the end of a strong move, an inside bar can signal fading momentum and a potential shift in direction. These setups work best around key support or resistance zones where traders anticipate exhaustion.
How to trade it:
• Look for exhaustion: Find an inside bar at the end of a strong trend or near a key support/resistance level.
• Entry point: Place a buy order above the inside bar’s high for bullish reversals, or a sell order below its low for bearish reversals.
• Stop-loss: Use the opposite side of the mother bar’s range to contain risk.
• Profit target: Set at the next logical support/resistance zone or use a risk-reward ratio like 1:2.
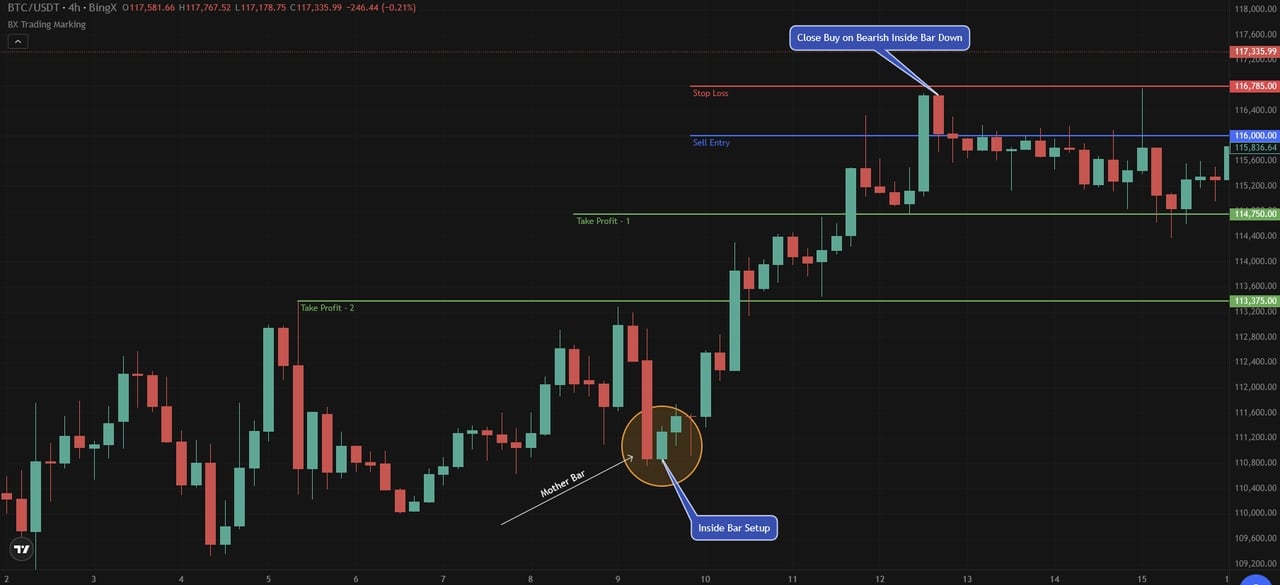
Source: BTC/USDT Trading Chart on BingX
On the BTC/USDT 4-hour chart, an inside bar formed near $116,000 after a sharp upward rally. Price broke down below the inside bar’s low, triggering a sell entry at $116,000 with a stop-loss set at $116,785 (above the mother bar’s high).
The move extended toward $114,750 and $113,375, both of which served as profit targets. This reversal trade captured the shift in momentum and locked in gains as Bitcoin retreated from its highs.
Combining Inside Bars with RSI and MACD
Inside bar patterns become far more reliable when paired with momentum indicators. Two of the most widely used tools in technical analysis, the Relative Strength Index (RSI) and the Moving Average Convergence Divergence (MACD), help traders confirm whether a breakout is likely to succeed or fail. By combining these indicators with inside bar candlestick patterns, traders can filter out false setups and trade with greater confidence.
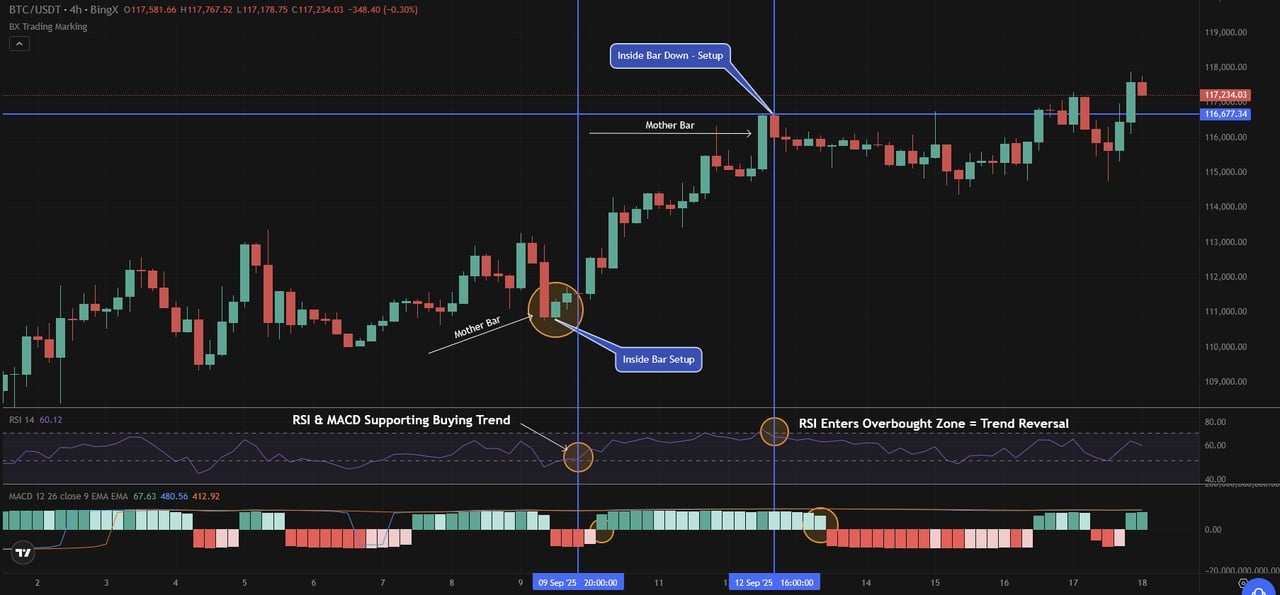
Source: BTC/USDT Trading Chart on BingX
Using RSI with Inside Bar Patterns
The Relative Strength Index (RSI) measures momentum on a 0–100 scale and adds critical confirmation to inside bar setups. When the RSI holds above 50, it suggests bullish momentum, making a bullish inside bar breakout more trustworthy.
On the BTC/USDT 4-hour chart, an inside bar formed near $111,200 while the RSI stayed above the midline, confirming that buyers were still in control.
Conversely, when RSI climbs into the overbought zone above 70, as seen near $117,000, a bearish inside bar becomes more reliable since momentum shows signs of exhaustion.
Using MACD with Inside Bar Patterns
The Moving Average Convergence Divergence (MACD) helps assess the strength and direction of potential breakouts. When the MACD line crosses above the signal line and the histogram turns green, it confirms bullish continuation.
On the BTC/USDT chart, this confirmation appeared alongside an inside bar at $111,200, signaling strength in the upward move. Later, as the histogram flipped from green to red and momentum weakened, a bearish inside bar near $117,000 aligned with the MACD’s warning of a reversal.
Combining MACD with inside bar patterns helps traders gauge breakout quality and avoid false signals.
Conclusion
The inside bar is a simple candlestick pattern that highlights consolidation within the range of a larger mother bar. It can mark either a continuation in trending markets or a potential reversal near key levels. While not foolproof, its reliability improves on higher timeframes and when confirmed with indicators such as the Relative Strength Index (RSI) and the Moving Average Convergence Divergence (MACD).
Used with clear entry, stop-loss, and risk management rules, inside bars can help traders identify structured opportunities in volatile markets.
Related Reading
FAQ
1. What is an inside bar pattern in trading?
An inside bar is a candlestick formation where the second candle stays within the high and low of the first (mother bar), signaling consolidation.
2. How do traders use inside bar patterns?
Traders use inside bars to anticipate breakouts. A break above the mother bar’s high suggests continuation, while a break below signals potential reversal.
3. What timeframe is best for inside bar trading?
Inside bars are most reliable on the daily and weekly charts, where market noise is reduced. Intraday setups often create more false signals.
4. Can inside bar patterns be combined with indicators?
Yes. The Relative Strength Index (RSI) and Moving Average Convergence Divergence (MACD) help confirm momentum and filter out false breakouts.
5. Are inside bar patterns profitable?
They can be, but profitability depends on context and risk management. Inside bars work best with trend alignment, clear stop-losses, and disciplined exits.
