
The Ichimoku Cloud, also known as Ichimoku Kinko Hyo, has become a favorite among crypto traders for its ability to simplify complex market conditions into a single chart view. Originally designed for equities in Japan, it has gained traction in digital assets where volatility and rapid trend shifts demand reliable tools.
What sets the Ichimoku Cloud apart is its “all-in-one” design, it not only identifies trend direction but also maps momentum and forward-looking support and resistance zones. For traders navigating Bitcoin, Ethereum, or altcoins, the cloud’s projections often highlight levels that traditional moving averages or oscillators miss.
This guide focuses on how the Ichimoku Cloud applies specifically to cryptocurrency trading, breaking down its components, strategies, and best practices for building confidence in volatile markets.
What Is Ichimoku Cloud?
The Ichimoku Cloud was created by Japanese journalist Goichi Hosoda in the 1930s and formally published in the 1960s after decades of refinement. Originally intended for stock markets, its multi-layered approach quickly became valued for analyzing complex price action.
In today’s crypto markets, where volatility is extreme and trends can reverse in minutes, the Ichimoku Cloud proves especially useful. Its forward-projected “cloud” offers traders a glimpse of potential support and resistance levels ahead of time, something traditional lagging indicators cannot match.
This forward-looking feature makes it well-suited for fast-moving assets like Bitcoin, Ethereum, and altcoins.
Core Components of the Ichimoku Cloud Indicator
The Ichimoku Cloud is built from five key lines, each offering unique insights into market behavior:
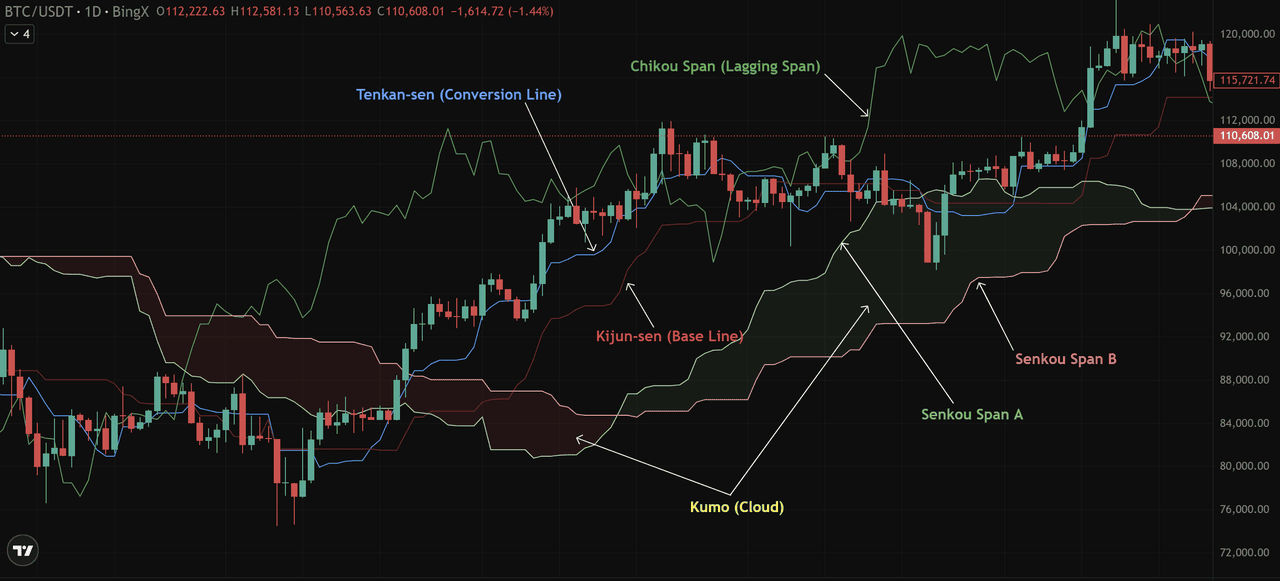
Source: BTC/USDT Trading Chart on BingX
• Tenkan-sen (Conversion Line): Calculated as the average of the highest high and lowest low over the past nine periods, this line reacts quickly to price changes and highlights short-term momentum. In crypto markets, it often signals the first shift in trend direction.
• Kijun-sen (Base Line): Derived from the 26-period high/low average, this slower line acts as a trend confirmation tool. It frequently serves as a dynamic support or resistance level, helping crypto traders trail stop-losses during strong moves.
• Senkou Span A: The midpoint between Tenkan and Kijun, projected 26 periods forward. Along with Span B, it forms the boundaries of the cloud (Kumo), giving traders a forward-looking view of potential support and resistance.
• Senkou Span B: Calculated from the 52-period high/low average and also plotted forward, this slower line adds stability. Its interaction with Span A creates cloud “twists,” often signaling potential trend shifts in volatile crypto markets.
• Kumo (Cloud): The shaded area between Span A and B. A green cloud (Span A above Span B) signals bullish conditions, while a red cloud points to bearish momentum.
• Chikou Span (Lagging Span): The current closing price plotted 26 periods back. It confirms trend strength, if it sits above price action, the market is considered bullish, and vice versa.
How to Read Cloud Strategy for Crypto Trading
The Ichimoku Cloud’s real value comes from how its signals guide traders in fast-moving markets like Bitcoin. The BTC/USDT chart above shows how these elements work together.
1. Trend Identification
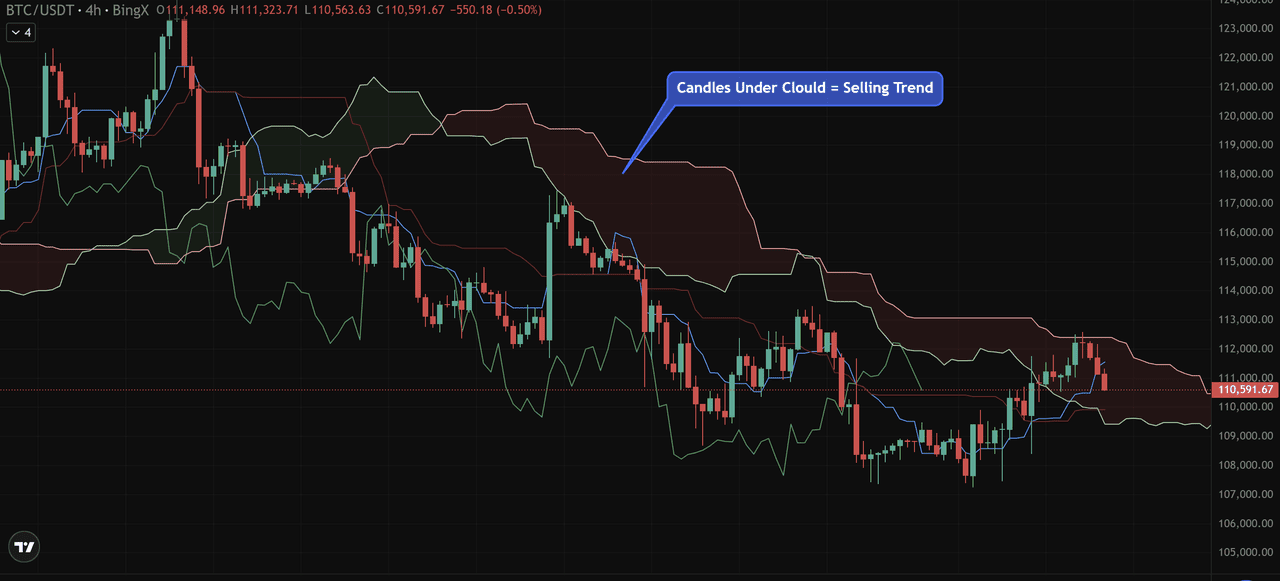
The simplest interpretation comes from price relative to the cloud. If price action stays above the cloud, the trend is bullish. If it moves below the cloud, sentiment turns bearish. When price trades within the cloud, it signals indecision or consolidation, a phase many traders consider a “no-trade zone.”
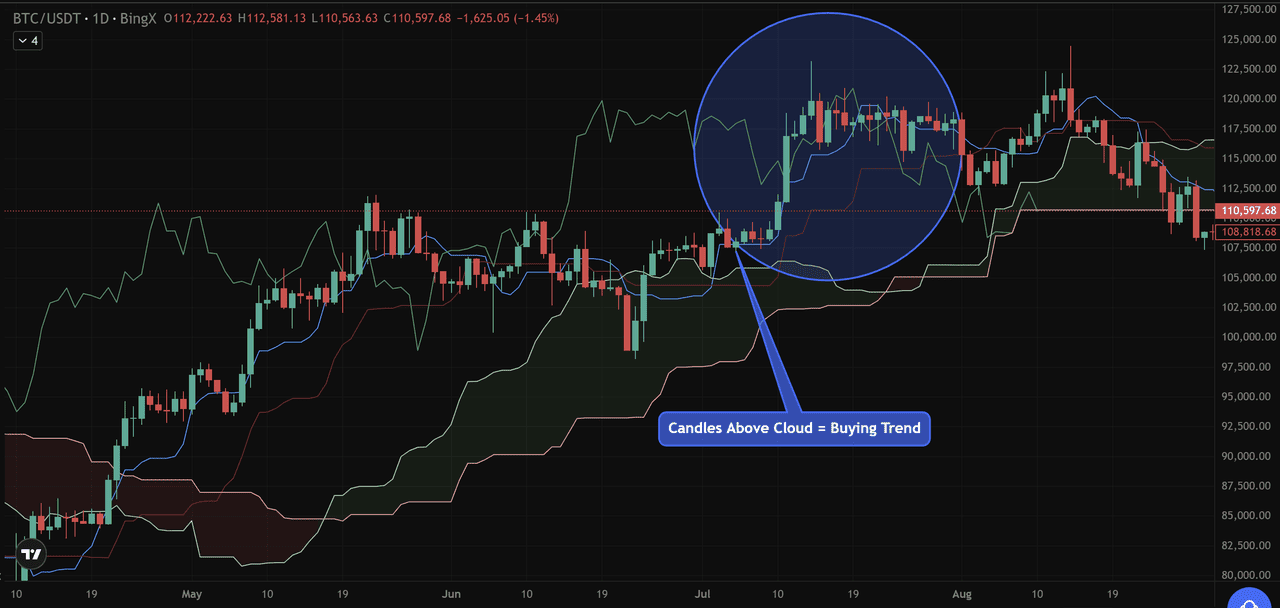
Source: BTC/USDT Trading Chart on BingX
Notice how Bitcoin trades above the cloud during its rally toward $120,000. This confirms a bullish trend.
In contrast, earlier price action below the cloud reflected bearish pressure. When BTC moved inside the cloud, it entered consolidation, a no-trade zone prone to whipsaws.
Source: BTC/USDT Trading Chart on BingX
2. Cloud Thickness & Angle
The thickness of the Kumo highlights how strong projected support or resistance may be. A thick cloud suggests stronger barriers to price movement, while a thin cloud often leaves room for breakouts. The angle of the cloud matters too, an upward slope confirms bullish momentum, whereas a downward slope signals weakening conditions.
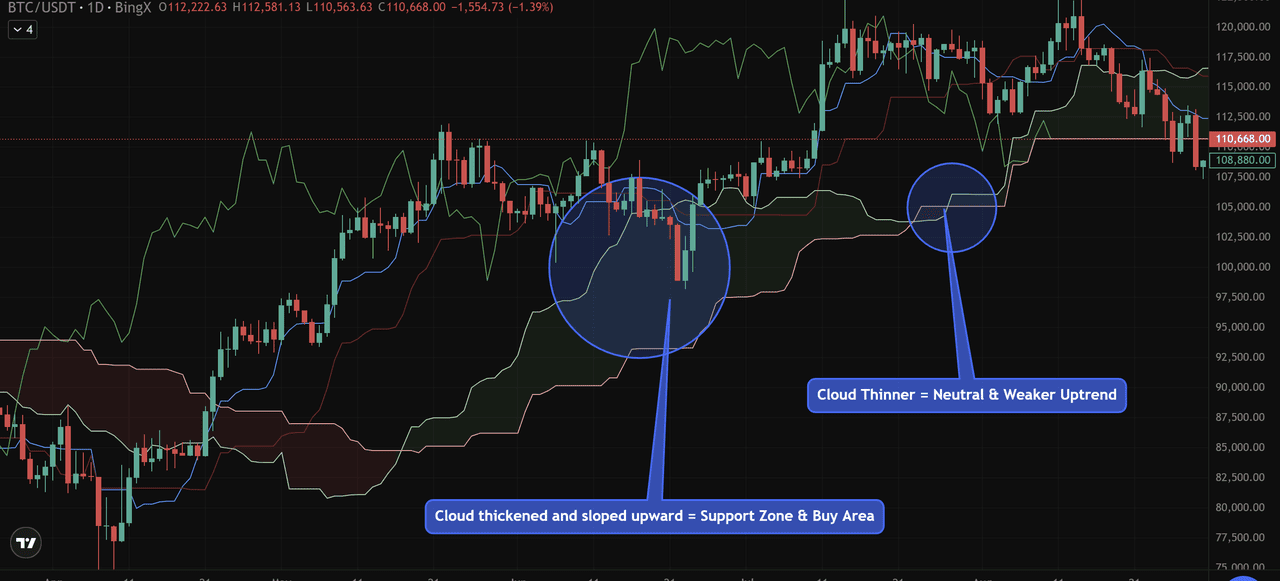
Source: BTC/USDT Trading Chart on BingX
Around $96,000–$100,000, the cloud thickened and sloped upward. This suggested strong projected support. Later, a thinner, flatter section near $104,000 hinted at weaker barriers, leaving room for price to break out.
3. Chikou Span Confirmation
The lagging span provides added clarity. When the Chikou Span lies above current price levels, it confirms bullish sentiment; if it falls below, bearish momentum dominates.
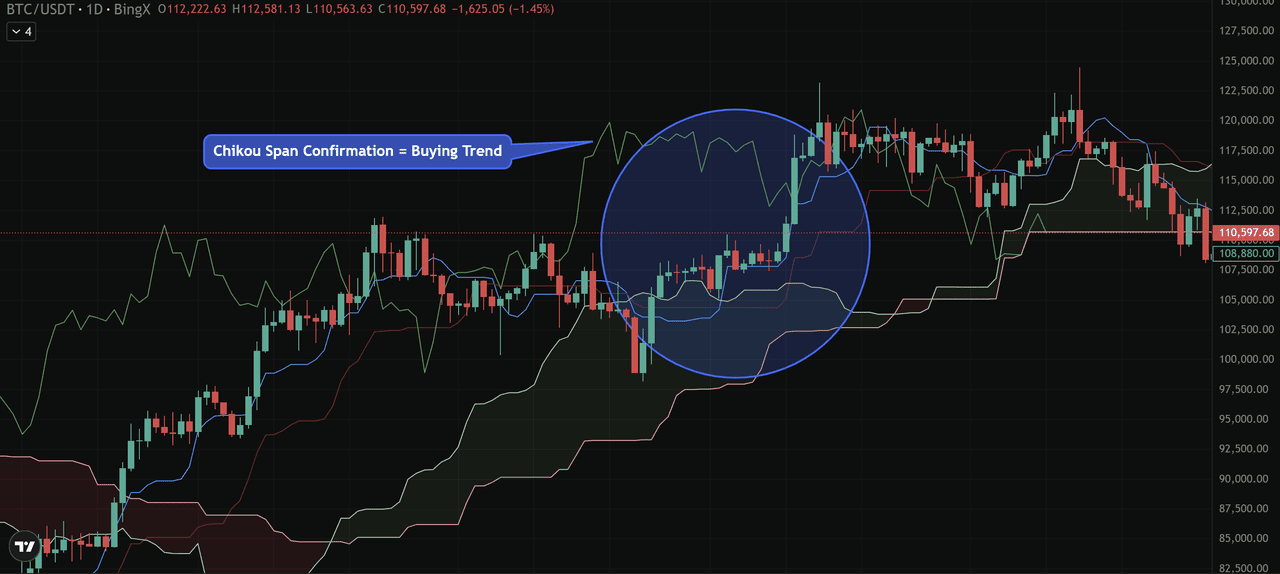
Source: BTC/USDT Trading Chart on BingX
The Chikou Span (green line) consistently stayed above the price candles during BTC’s breakout phase, reinforcing bullish conviction. When it dipped below price during corrections, momentum weakened.
4. Avoid Trading Inside the Cloud
Crypto traders often avoid initiating new positions while price is inside the cloud. This zone reflects uncertainty and can trigger false signals, making breakouts on either side more reliable than trades within.
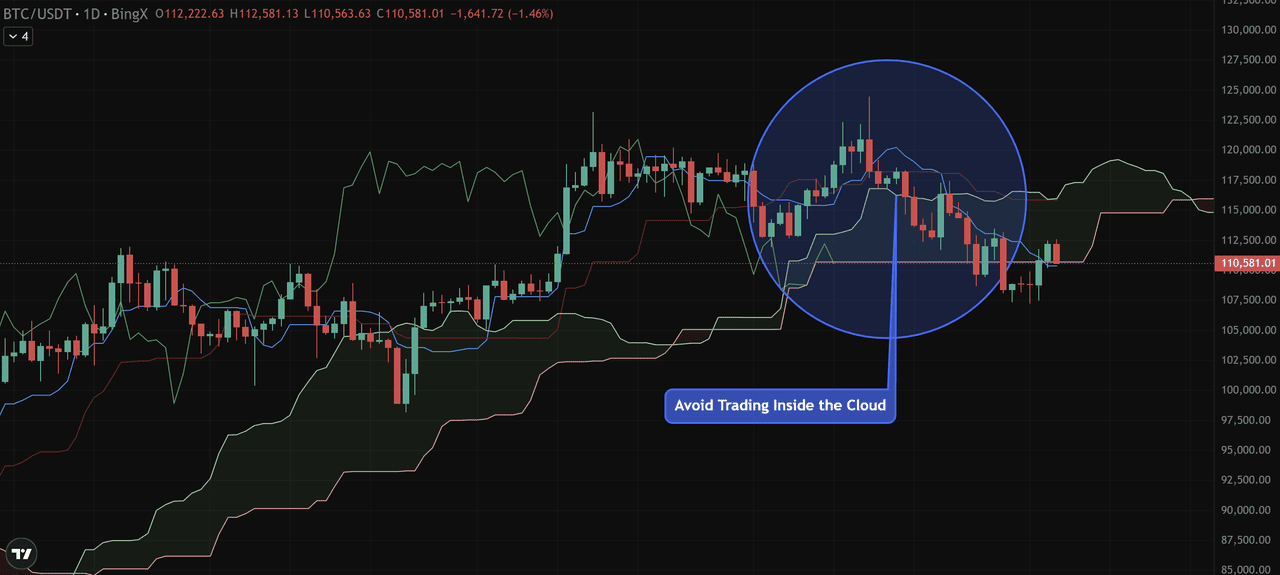
Source: BTC/USDT Trading Chart on BingX
The BTC/USDT chart highlights this principle clearly. During August, Bitcoin’s price moved inside the Kumo, creating a period of choppy action (circled in blue). Many traders avoid entering positions here, since the cloud represents uncertainty. Waiting for a decisive breakout above or below the Kumo provides stronger, more reliable trade signals.
Key Trading Strategies for Crypto Using Ichimoku Cloud
The Ichimoku Cloud can be applied on any timeframe, from 1-minute charts to weekly views. However, signals tend to be most reliable on the 4-hour and daily charts, while shorter intervals often produce false or whipsaw moves. With that in mind, here are the main strategies traders use:
a. Kumo (Cloud) Breakout
The Kumo breakout is one of the most powerful applications of the Ichimoku Cloud. It focuses on whether price decisively moves above or below the cloud.
• A bullish breakout occurs when price closes above the cloud, signaling that buyers are in control.
• A bearish breakout occurs when price closes below the cloud, suggesting that sellers dominate.
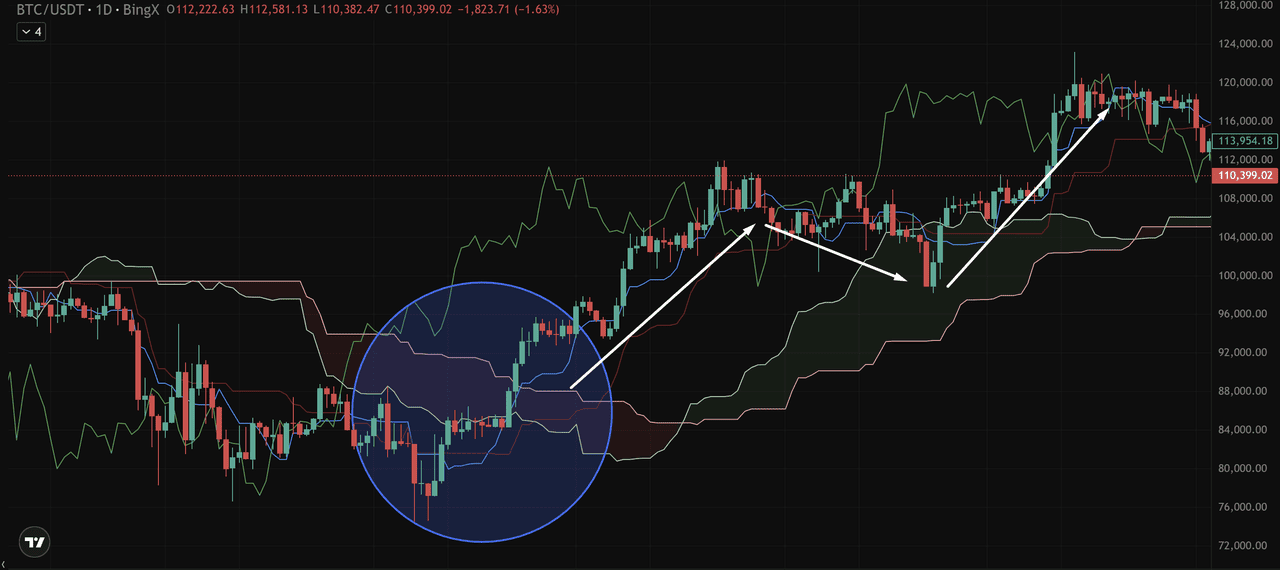
Source: BTC/USDT Trading Chart on BingX
On the BTC/USDT chart, Bitcoin was trading below the red cloud around the $80,000–$85,000 range, reflecting bearish momentum. The key signal came when BTC broke above the cloud near $95,000–$100,000, supported by rising Tenkan-sen and Kijun-sen lines. This bullish breakout triggered a strong rally that carried BTC to highs above $120,000.
Notice that the cloud was relatively thick during this breakout. A thicker cloud generally represents stronger resistance. When Bitcoin managed to push through it, the breakout carried more weight and attracted momentum buyers, accelerating the move.
For crypto traders, the takeaway is clear: a cloud breakout often marks the beginning of a significant trend. To manage risk, stop-losses are usually placed just inside or below the cloud, ensuring protection if the breakout turns out to be false.
b. Tenkan-Kijun Crossovers (with Filters)
The crossover between the Tenkan-sen (Conversion Line, blue) and the Kijun-sen (Base Line, red) is one of the most watched Ichimoku signals. While crossovers happen often, applying filters helps traders focus only on the strongest opportunities.
• With the Chikou Span filter
A bullish setup occurs when the Tenkan-sen crosses above the Kijun-sen while the Chikou Span (lagging line) is above price action. This alignment confirms that momentum and trend are both positive. A bearish setup is the reverse: Tenkan crosses below Kijun while the Chikou Span sits under the price. In crypto markets, this filter helps eliminate signals that occur in sideways chop, where crossovers happen frequently without follow-through.
Source: BTC/USDT Trading Chart on BingX
In the BTC/USDT chart, a bullish crossover appeared when the blue Tenkan-sen crossed above the red Kijun-sen around the $90,000–$92,000 area.
At the same time, the green Chikou Span (Lagging Span) was positioned above historical price action, confirming that momentum aligned with the trend. This combination validated a clean long entry, which was followed by Bitcoin’s rally toward $105,000.
• With the Cloud filter
Another way to filter signals is by checking the breakout location relative to the cloud. A sell signal gains more weight when the Tenkan-sen (blue) crosses below the Kijun-sen (red) while price is already trading under the Kumo cloud. This alignment confirms that short-term momentum is weakening against the broader trend.
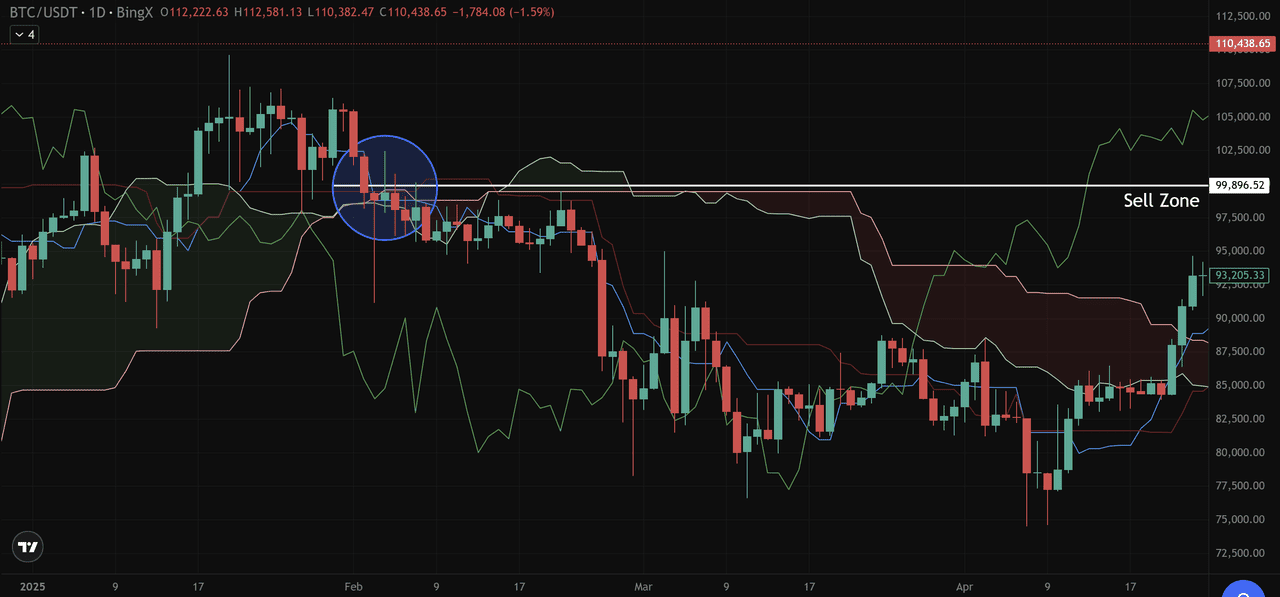
In the BTC/USDT chart, this setup unfolded in early February:
• The blue Tenkan-sen crossed below the red Kijun-sen around the $99,500–$100,000 zone (circled in blue).
• At the same time, price was slipping under the shaded Kumo, reinforcing bearish conviction.
• Traders who entered short positions around the $99,896 resistance area could have captured the subsequent drop toward $85,000–$87,000, a move of over 12%.
Source: BTC/USDT Trading Chart on BingX
By aligning the crossover with the cloud position, traders filtered out weaker signals that may have occurred during sideways action. The result was a higher-probability short setup consistent with the dominant downtrend.
c. Kumo Twists
A Kumo twist happens when Senkou Span A (leading green line) crosses Senkou Span B (leading red line), causing the cloud to flip color. This shift often signals a potential trend change ahead, though traders usually wait for price confirmation.
Source: BTC/USDT Trading Chart on BingX
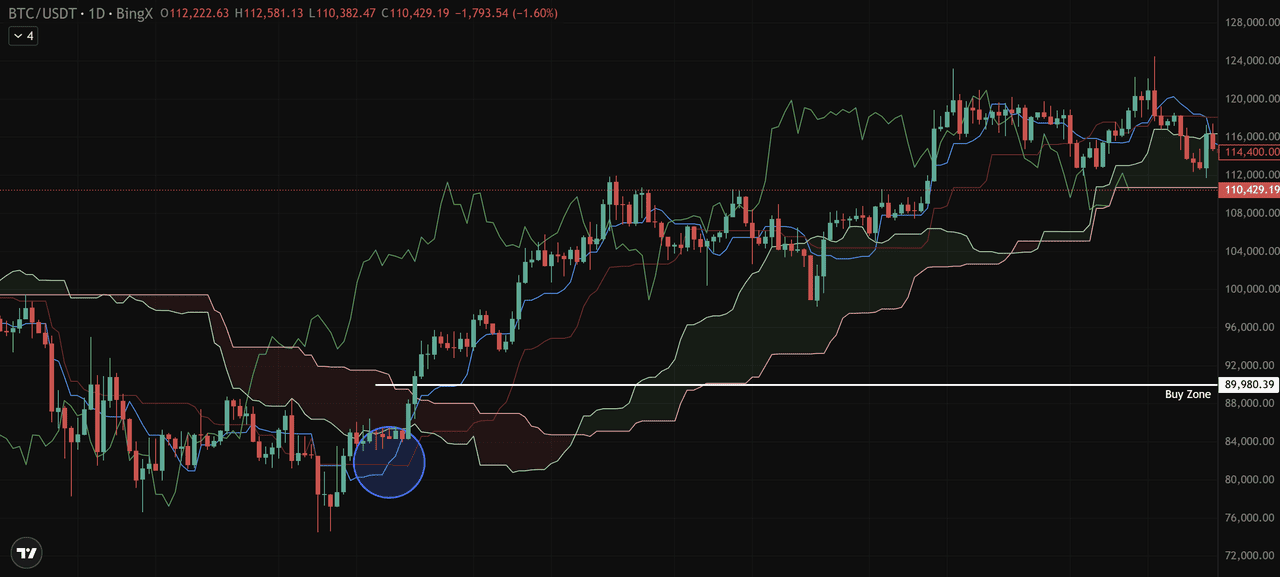
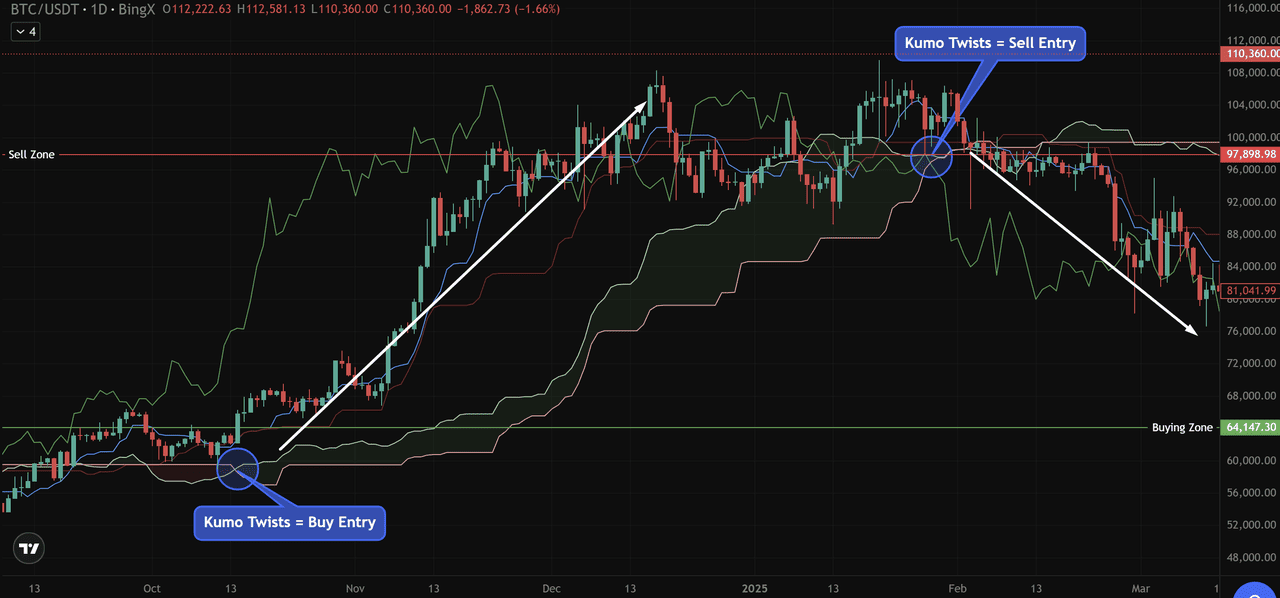
On the BTC/USDT chart:
• Bullish Kumo Twist (Buy Entry): This bullish twist projected a tend reversal ahead, and the buying opportunity was reinforced by the broader buying zone marked between $60,000 and $64,000. From there, Bitcoin launched into a powerful rally toward $110,000, confirming the bullish signal.
• Bearish Kumo Twist (Sell Entry): In early February, Span A dropped below Span B near the $99,800–$100,000 sell zone, flipping the cloud red. This bearish twist coincided with weakening momentum, and Bitcoin later corrected down to the $81,000 range, aligning with the projected downside bias.
These examples show how Kumo twists, combined with predefined buy/sell zones, can help traders identify turning points in crypto markets. Still, twists are best used with confirmation from price action and other Ichimoku components, as cloud flips in ranging periods can sometimes produce false signals.
d. Combining Ichimoku Cloud with RSI or Other Indicators
While the Ichimoku Cloud is powerful on its own, many traders combine it with momentum indicators like the Relative Strength Index (RSI) for extra confirmation. RSI helps confirm whether momentum supports a cloud breakout or crossover signal, and it also identifies potential exit points
Source: BTC/USDT Trading Chart on BingX
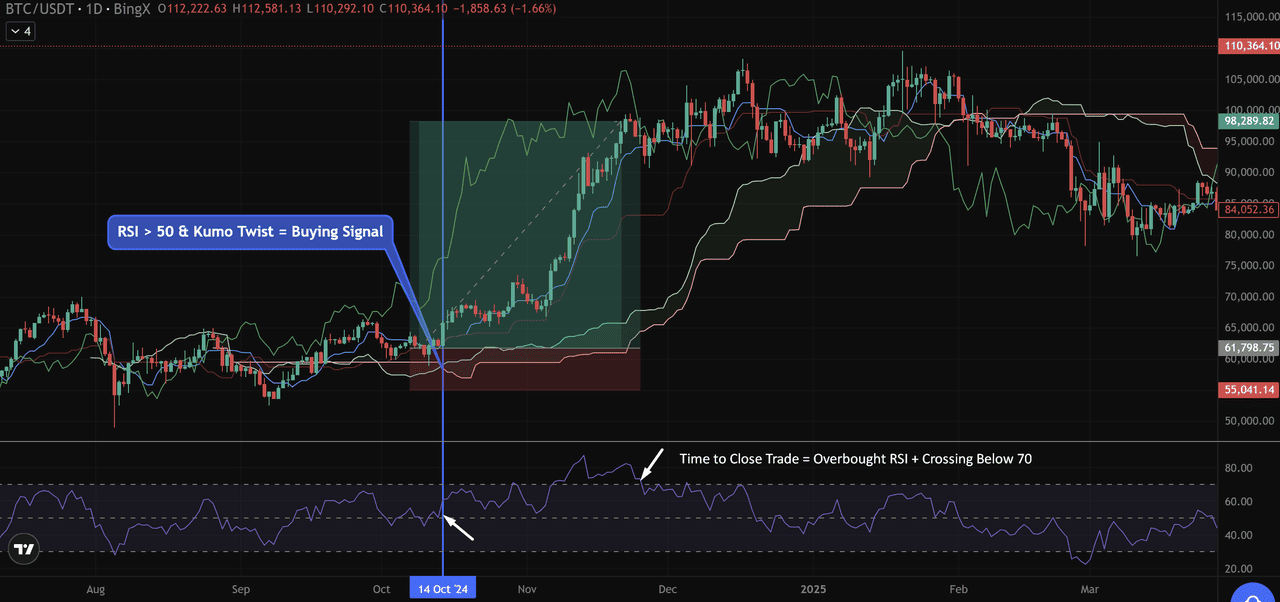
In the BTC/USDT chart, a bullish Kumo twist in mid-October aligned with the RSI breaking above 50, giving a strong buy signal. Bitcoin then rallied from around $60,000 to $98,000. Later, when RSI entered the overbought zone (above 70) and crossed back down, it signaled that momentum was fading, a timely exit cue to lock in profits.
Pros, Limitations & Best Practices for Using Ichimoku Cloud
Like any trading tool, the Ichimoku Cloud has its strengths and weaknesses. Understanding both sides helps traders apply it more effectively in crypto markets.
Pros
• All-in-one view: The Ichimoku Cloud combines trend, momentum, and support/resistance levels into a single chart, reducing the need for multiple indicators.
• Forward-looking projection: The Kumo projects support and resistance ahead of current price action, offering traders valuable foresight in volatile crypto markets.
• Clear trend bias: Price above the cloud signals bullish conditions, below indicates bearishness, helping traders stay aligned with the dominant move.
Cons
• Steep learning curve: The system can appear complex and cluttered, especially for beginners.
• Default settings not always ideal: Parameters like 9-26-52 were built for traditional markets and may not fit crypto’s 24/7 volatility.
• Less reliable intraday: Ichimoku works best on higher timeframes (4-hour or daily), while shorter charts often produce false or whipsaw signals.
Best Practice: Crypto traders should adjust settings for their timeframe, avoid signals inside the cloud, and use RSI or volume for confirmation.
Conclusion
The Ichimoku Cloud stands out as one of the few indicators that delivers a holistic, forward-looking view of the crypto market. By combining trend direction, momentum, and projected support and resistance, it gives traders a structured way to navigate the volatility of assets like Bitcoin, Ethereum and altcoins.
That said, the Cloud is most effective when traders practice and back-test its signals across different crypto pairs and timeframes. This helps build familiarity with how breakouts, twists, and crossovers play out in real market conditions.
Finally, Ichimoku signals should never be used in isolation. Pairing them with sound risk management, through disciplined position sizing, stop-loss placement, and confirmation tools like RSI or volume, ensures setups are approached with both confidence and caution. For traders who take the time to master it, the Ichimoku Cloud can become a valuable ally in navigating crypto’s fast-changing trends.
Related Articles
4. Simple Moving Average(SMA) vs Exponential Moving Average(EMA) in Crypto Trading: Differences to Know
FAQs on Ichimoku Cloud in Crypto
1. Can the Ichimoku Cloud be used on any timeframe?
Yes. The Ichimoku Cloud can be applied on any chart, from 1-minute to weekly. However, signals are more reliable on the 4-hour and daily timeframes. Shorter charts often produce noise and false signals.
2. What are the default Ichimoku settings, and should I change them for crypto?
The default settings are 9-26-52, originally designed for Japanese stock markets. Many crypto traders adjust to 10-30-60 or 20-60-120 to better reflect 24/7 trading conditions.
3. How do I know if a signal is strong?
The strongest signals occur when multiple Ichimoku elements align, for example, a bullish crossover above the cloud with the Chikou Span above price. Confirmation with RSI or volume further reduces risk.
4. Is Ichimoku Cloud good for beginners in crypto trading?
Yes, but it has a learning curve. Beginners should start with basic readings, like whether price is above or below the cloud—before adding advanced strategies like twists or filtered crossovers.
5. Does Ichimoku work better on Bitcoin than altcoins?
It works on both, but signals tend to be cleaner on high-liquidity pairs like BTC/USDT and ETH/USDT. Lower-volume altcoins can produce more false or unreliable signals.
6. Can Ichimoku be used for short-term trading?
Yes, scalpers and day traders use it on 5-minute or 15-minute charts, but risk of false signals is higher. Always pair short-term signals with a higher timeframe trend check.
