
In crypto trading, understanding when a trend might be gaining strength, or running out of steam, is essential. Two commonly watched signals that attempt to capture these shifts are the Golden Cross and the Death Cross. At their core, both are simple moving average (MA) crossovers.
• A Golden Cross forms when a short-term moving average, like the 50-day, rises above a long-term one, such as the 200-day. This often signals the beginning of a stronger upward trend.
• On the flip side, a Death Cross occurs when the short-term average falls below the long-term one, pointing to possible downside momentum.
In crypto markets, where trends shift fast, Golden and Death Crosses help traders assess sentiment, trend strength, and timing. This article explains how golden cross and death cross signals work, when they matter, how they fit into broader strategies, and what risks to consider. Whether you’re new to charts or refining your edge, these patterns offer useful insight into market direction.
What Is a Golden Cross in Crypto Trading?
A Golden Cross takes shape when a short-term moving average, most commonly the 50-day, crosses above a long-term average, such as the 200-day. This crossover marks a potential shift from a weakening or consolidating market to one with growing bullish momentum.
Crypto traders use the Golden Cross as a trend-following signal, often seeing it as the early stages of a broader uptrend. While the crossover itself is straightforward, it’s rarely used in isolation. Traders typically look for added confirmation from tools like the Relative Strength Index (RSI) or Moving Average Convergence Divergence (MACD) to validate the strength behind the move.
Example: BTC/USDT Golden Cross on 4-Hour Chart
The chart below shows a Golden Cross on BingX, where Bitcoin’s 50-period moving average (red) crosses above the 200-period moving average (blue). This marked the beginning of a notable price rally.
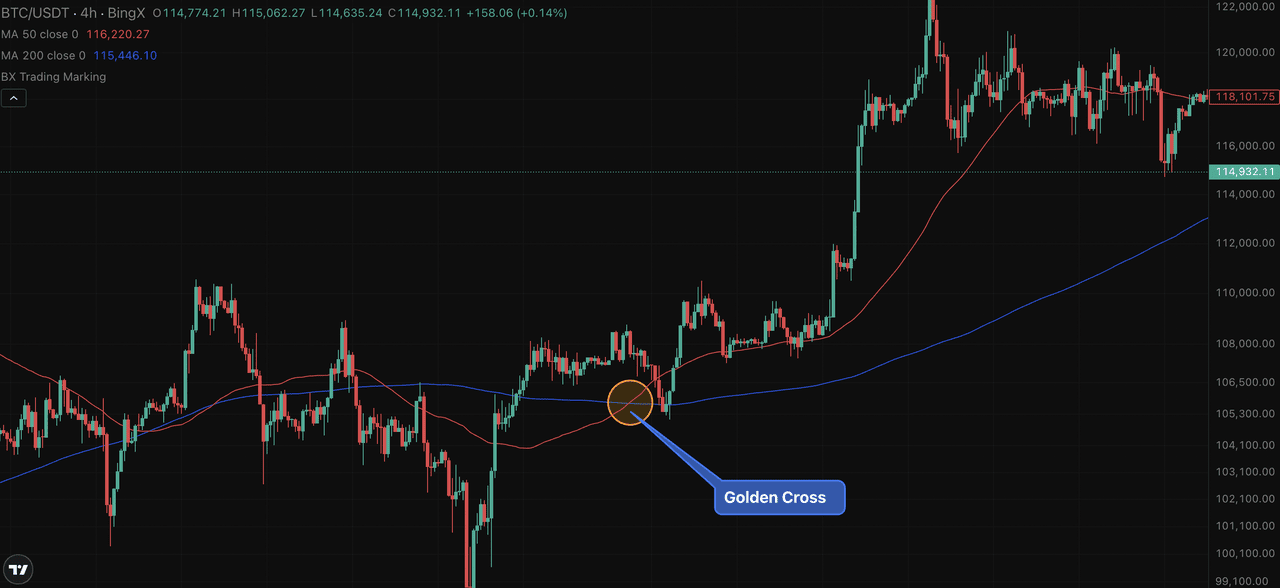
Source: BTC/USDT Trading Chart on BingX
Though often associated with bullish reversals, Golden Crosses don’t guarantee sustained gains. Market context, trading volume, and recent price action should be factored in before making decisions.
When confirmed by other indicators and healthy volume, this setup can offer a high-conviction entry for swing traders or trend followers aiming to catch the early stages of a broader move.
What Is a Death Cross in the Crypto Market?
A Death Cross appears when a short-term moving average, commonly the 50-day, crosses below a longer-term average such as the 200-day. This crossover suggests declining momentum and may warn of an extended downtrend, especially when supported by weakening price action.
Crypto traders often interpret this as a signal to reduce long exposure or prepare for bearish setups. While it’s a lagging indicator, it tends to align with broader market shifts, particularly in trending environments.
Example: BTC/USDT Death Cross on 1-Hour Chart
Below is a real-time example from BingX. The 50-period moving average (red) crossed below the 200-period moving average (blue), confirming a Death Cross before Bitcoin dropped sharply.
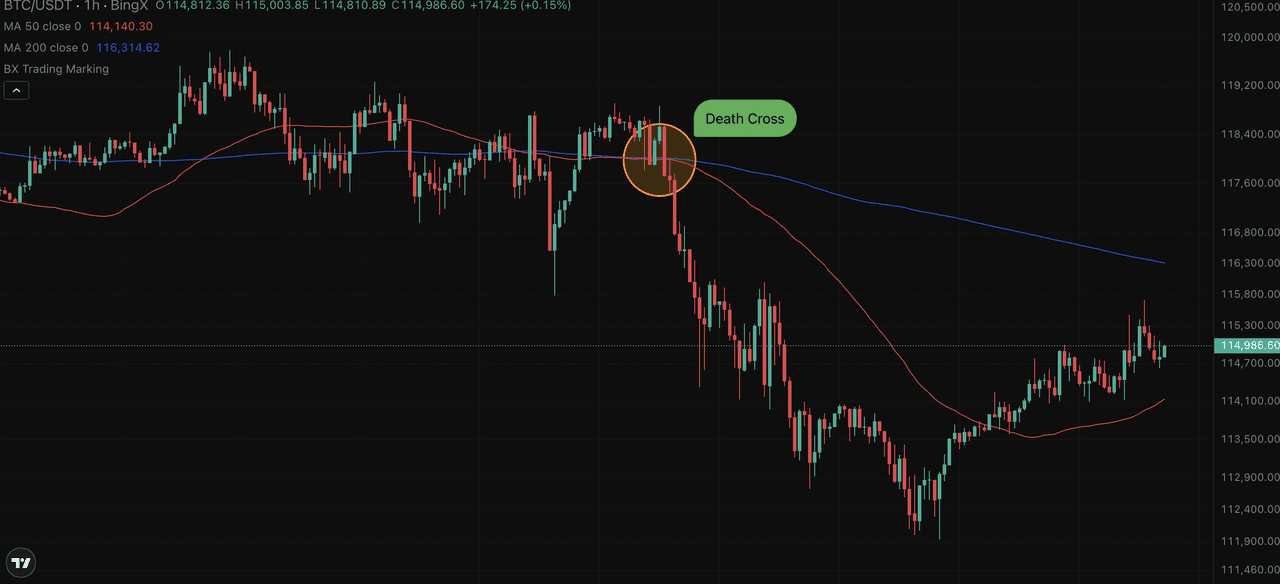
Source: BTC/USDT Trading Chart on BingX
Still, context matters. Death Crosses during sideways or low-volume markets can produce false signals. Combining the crossover with volume spikes, RSI divergence, or MACD confirmation helps reduce the risk of acting too late or on noise.
How Technical Traders Use Golden Cross and Death Cross
Golden and Death Crosses can help traders frame market direction, but acting on them blindly isn’t enough. Instead, experienced traders use these cross signals alongside momentum indicators, price structure, and defined risk-to-reward setups.
How Traders Use the Death Cross
Take this example from the BTC/USDT 1-hour chart. A clear Death Cross forms when the 50-period moving average (red) crosses below the 200-period (blue), signaling bearish momentum. Two candles confirm the breakdown below both averages, and at the same time, the relative strength index (RSI) drops below 50, suggesting a momentum shift. The entry point is triggered at around $117,565, just after the second candle closes below both MAs and the RSI confirms bearish sentiment.
A well-structured trade setup follows:
• Stop-loss is placed above the recent swing high, around $119,243
• Take-profit is targeted near the prior support zone, around $114,873, just before RSI enters oversold
• This creates a reward-to-risk ratio close to 2:1, risking approximately $1,678 to capture a potential gain of $3,372
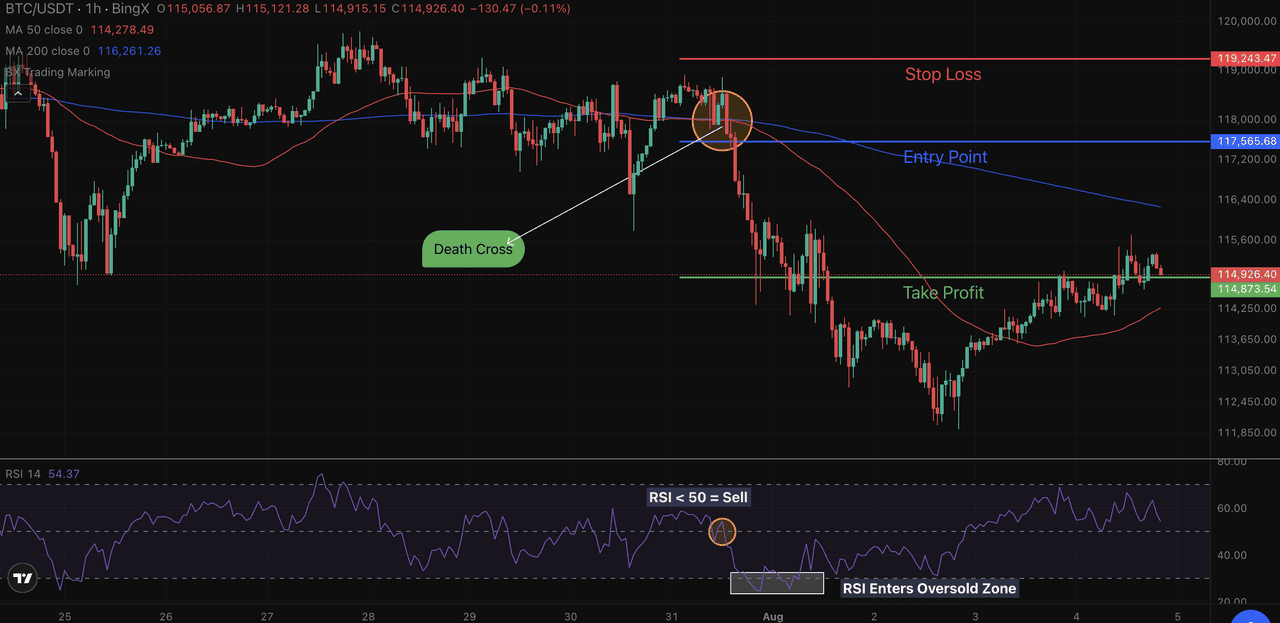
BTC/USDT: Bearish setup after Death Cross with RSI < 50 and clear TP/SL levels
To avoid false signals, especially in sideways or low-volume markets, traders often wait for confluence. A rising RSI during a Golden Cross or a falling moving average convergence divergence (MACD) histogram during a Death Cross can add weight to the trade. Volume spikes during the crossover further strengthen the case.
In summary, traders often:
• Confirm crossovers with RSI < 50 (bearish) or > 50 (bullish)
• Use volume and MACD for added confidence
• Define SL/TP zones based on nearby highs, lows, or key RSI zones
How Traders Use the Golden Cross
The Golden Cross occurs when the 50-period MA crosses above the 200-period MA, often interpreted as a signal of strengthening bullish momentum. In the example below, the crossover forms near $109,115, while the RSI climbs above 50, suggesting that buyers are regaining control.
The entry point is placed shortly after confirmation, targeting upside toward $117,933, which is aligned with a key resistance level and RSI entering the overbought zone. A stop-loss is positioned just below the swing low at $104,127, maintaining a strong reward-to-risk ratio of about 2:1.
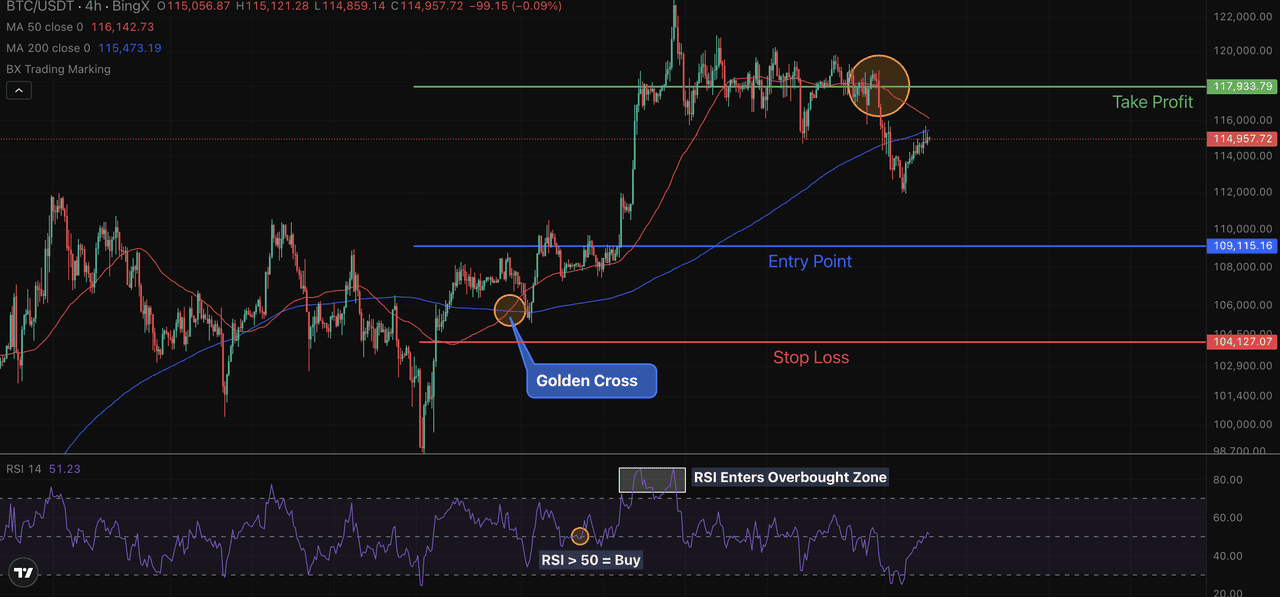
BTC/USDT: Golden Cross trade aligned with RSI > 50 and strong price action breakout
This type of setup appeals to swing traders who favor confirmation and momentum. While the Golden Cross suggests long-term strength, many traders still use:
• RSI > 50 or bullish divergence to support entry
• Breakout volume for added conviction
• Clear invalidation zones (recent lows) for stop placement
Combining the Golden Cross with broader market structure and clear exit planning helps filter out noise and improves decision-making under volatile conditions.
Comparing Golden Cross vs. Death Cross
Golden and Death Crosses are mirror images in structure but opposite in market bias. A Golden Cross signals bullish momentum as the 50 MA crosses above the 200 MA. A Death Cross signals bearish momentum when the 50 MA crosses below the 200 MA.
In trending markets, these signals can help confirm direction. But in sideways or noisy conditions, they often produce false signals, especially when price chops around the moving averages.
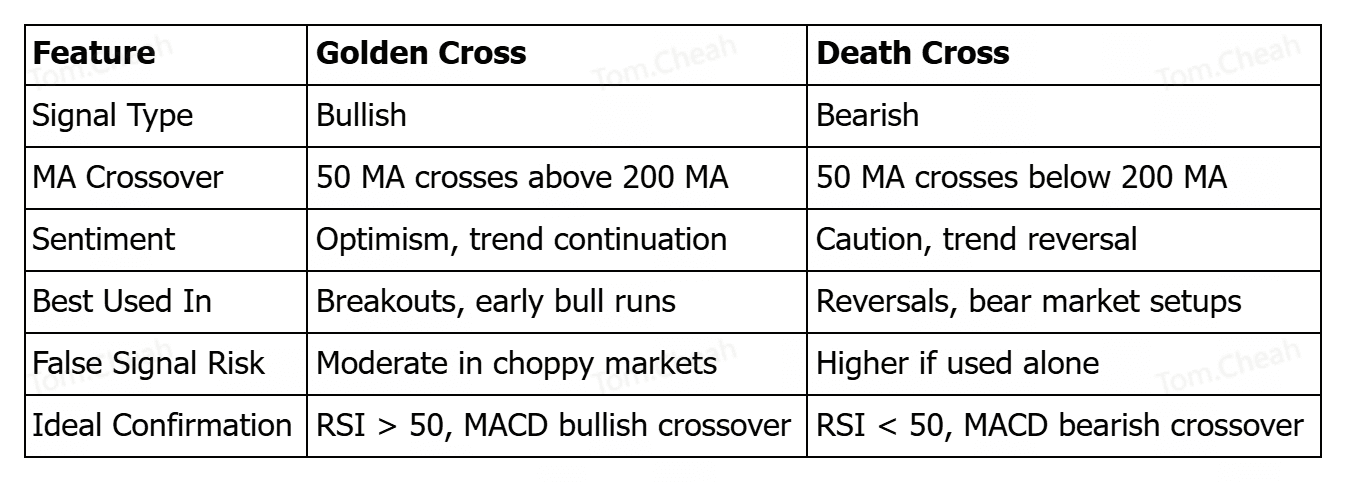
Used wisely, with supporting indicators, these patterns can help traders align with momentum while managing risk in both bull and bear phases.
Limitations and False Signals with Golden Cross and Death Cross Indicators
Golden and Death Crosses may look clean on a chart, but they have inherent limitations, especially when used alone. First, they are lagging indicators. Since they rely on historical moving average data, the signal often appears after a trend has already begun. This means traders who act solely on the crossover may enter too late, just as the market starts to reverse.
For example, during a Bitcoin rally in a sideways market, the 50 MA may briefly cross above the 200 MA, forming a Golden Cross. However, if this occurs without strong volume or RSI confirmation, it may be a false signal. Price can quickly drop back below both moving averages, trapping late buyers and triggering losses.
These patterns are also vulnerable in choppy, low-volume markets, where frequent crossovers occur with no real trend. This leads to whipsaw trades, back and forth moves that erode capital.
To reduce the impact of false signals:
• Always wait for confirmation, such as two candles closing above or below the crossover
• Use volume, RSI, or MACD to confirm momentum
• Align signals with higher timeframe trends (e.g., 4H crossover within a daily uptrend)
In short, Golden and Death Crosses are helpful, but only when combined with market context, proper confirmation, and risk control.
Conclusion: Using Crosses in Real Trading Conditions
Golden and Death Crosses can offer valuable insight into trend direction, but they should never be used in isolation. In real trading conditions, where markets can shift rapidly, these crossovers work best as part of a broader strategy that includes momentum indicators, volume analysis, and proper trade management.
Traders should also adapt their approach to current market conditions. In a strong bull market, a Golden Cross may offer a high-probability continuation setup. In contrast, during choppy or sideways markets, both Golden and Death Crosses are more prone to failure or delay.
To get the most from these signals:
• Combine them with tools like RSI, MACD, or support/resistance
• Wait for price confirmation and monitor trading volume
• Use consistent risk management to protect against false moves
For crypto traders, cross signals can act as a trend filter or entry trigger, but only when confirmed by context and supported by disciplined execution. The goal isn’t to chase every crossover, but to interpret them as part of a structured decision-making process.
Related Reading
FAQs on Golden Cross and Death Cross Indicators
1. What timeframe is best for spotting a golden cross?
The most commonly used timeframe is the daily chart, especially when using the 50-day and 200-day moving averages. However, swing traders may also apply the concept to 4-hour or 1-hour charts for shorter-term strategies.
2. Does a golden cross guarantee a bull market?
No. A Golden Cross signals improving momentum, but it doesn’t guarantee a sustained rally. Without confirmation from volume, RSI, or broader market structure, it can result in false breakouts, especially in sideways markets.
3. How long does a death cross trend usually last?
There’s no fixed duration. In strong downtrends, a Death Cross can precede a multi-week or multi-month decline. In less decisive markets, it may reverse quickly or be followed by whipsaw price action.
4. Can golden and death cross patterns work on altcoins too?
Yes, Golden and Death Crosses apply to any crypto asset with sufficient trading volume and historical data. However, altcoins are typically more volatile, so it’s even more important to combine these signals with other technical indicators.
5. Should I trade immediately after a crossover?
Not always. It’s better to wait for confirmation, such as two candle closes beyond the crossover, or alignment with momentum indicators like RSI or MACD. Acting too early increases the risk of getting caught in a false signal.
