
Solana is trading near $188, down 7% in the past 24 hours but still 5% higher on the week. With a market cap of $101.6 billion, the token holds the #6 spot and is back in focus as institutions line up behind it.
Institutional interest in Solana is heating up, with major treasury initiatives signaling what some call a “MicroStrategy for SOL.” Pantera Capital is raising $1.25 billion to launch a Solana treasury company aimed at building long-term reserves, while Galaxy Digital, Multicoin Capital, and Jump Crypto, working with Cantor Fitzgerald, are seeking $1 billion for a separate Solana treasury fund that could involve acquiring a publicly listed company. Backed by the Solana Foundation’s endorsement, these moves highlight rising institutional confidence, though analysts note short-term volatility persists. If SOL fails to rebound from the $201 level, any rallies may serve more as exit windows than sustained recoveries.
If completed, the fund would dwarf existing holders such as Upexi (2M SOL worth, $400M) and DeFi Development Corporation ($240M). Even Bit Mining, traditionally focused on Bitcoin, has announced a $200–$300M Solana reserve. A $1 billion pool would double the size of today’s largest treasuries and highlight how quickly institutional demand for Solana is accelerating, a factor that feeds directly into long-term Solana price predictions.
Solana Price Prediction: Daily Chart Signals Ascending Triangle Breakout
On the daily chart, Solana is forming an ascending triangle, a bullish pattern where price repeatedly tests a flat resistance while higher lows climb from below. The ceiling sits at $210, while support has risen from the $125 base through $175 into the current $188 zone.
The 50-day EMA ($178) has acted as a springboard, while the 200-day EMA ($156) anchors the longer-term trend. Momentum indicators remain neutral, with the RSI at 52 and the MACD tightening, conditions that often precede a breakout.
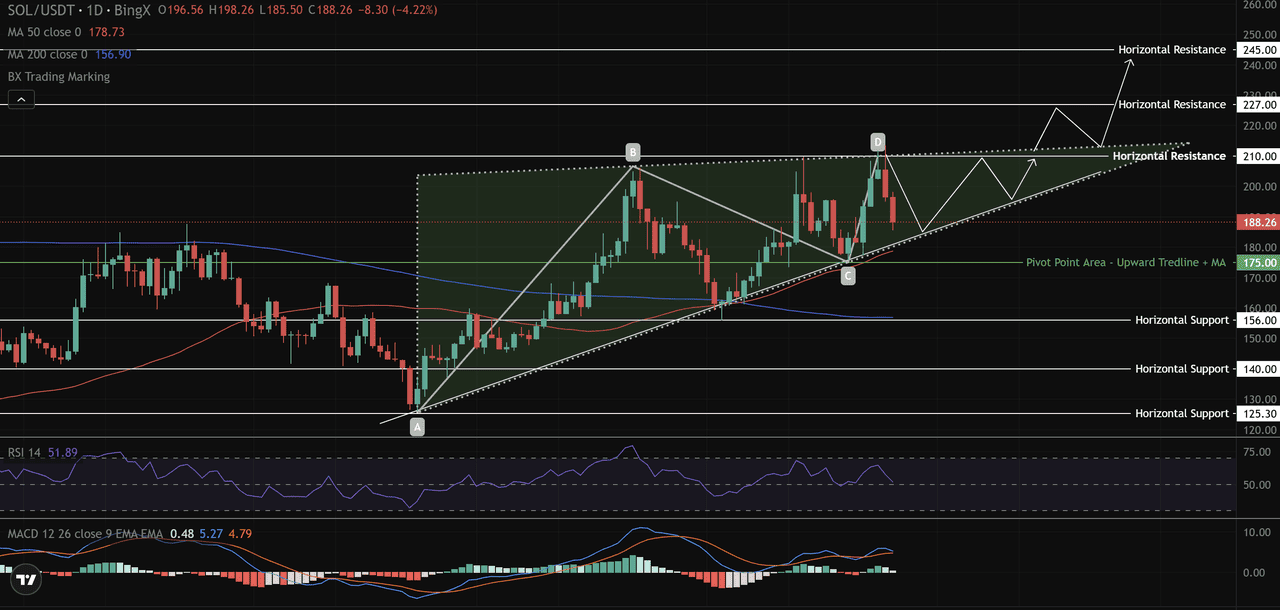
Solana daily chart shows ascending triangle with resistance at $210. Source: BingX
A close above $210 with strong volume would target $227–$245, levels aligned with historical resistance and the triangle’s measured range. Candlestick action supports this, as long-tailed wicks on pullbacks show steady accumulation.
If Solana slips below $175, the market could revisit $156 or $140, but as long as the triangle holds, the outlook remains bullish. In short, SOL is building pressure beneath $210, preparing for a potential breakout.
Solana Price Prediction: Monthly Chart Eyes $300+
The monthly timeframe shows Solana consolidating above the 0.382 Fibonacci retracement at $186 while facing its key challenge at the $250 resistance. This zone has created a triple top pattern, a tough barrier that has already rejected three breakout attempts.
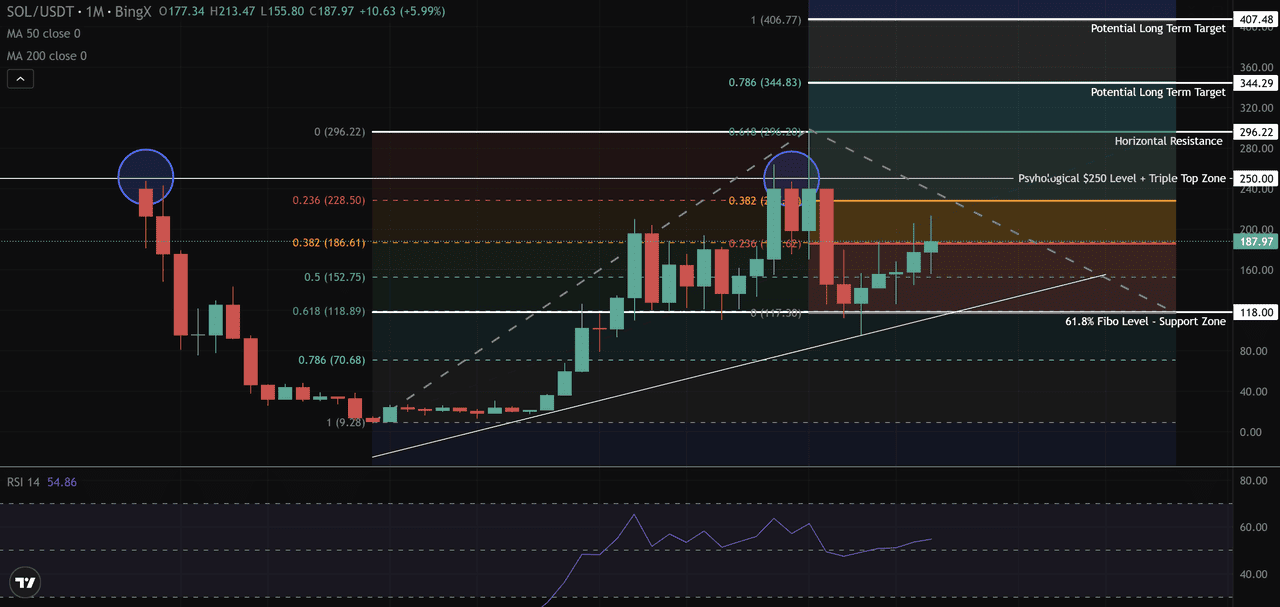
Solana monthly chart faces triple top near $250, with targets at $296–$407. Source: BingX
Repeated testing, however, typically weakens resistance. A clear monthly close above $250 would open the way to $296, the final horizontal barrier before Solana enters new price discovery. Beyond that, Fibonacci extensions project longer-term targets of $344 and $407, which would represent new all-time highs.
On the downside, $152 (Fib 0.5) and $118 (Fib 0.618) remain key supports. A breakdown below $152 would slow momentum, but holding above $186 keeps the bullish structure intact.
Risks to Keep in Mind
While Solana’s outlook appears bullish, investors should be aware of several risks. Short-term volatility remains elevated, with analysts warning that failure to hold the $201–$175 support range could send prices lower toward $156 or even $140. Institutional treasury plans, though promising, are not yet finalized, and delays or smaller-than-expected raises could temper market optimism. On the technical side, network reliability is still a concern, as Solana has experienced outages and congestion in the past, issues that could re-emerge during periods of high usage.
A more pressing risk is the recent revelation that FTX still controls around 8% of Solana’s total supply, worth an estimated $5 billion, held in undisclosed wallets. If these assets are liquidated during bankruptcy proceedings, it could create significant sell pressure and weigh heavily on market sentiment. This uncertainty not only threatens price stability but also highlights ongoing transparency issues stemming from FTX’s collapse. For these reasons, Solana investors should balance optimism with caution; never invest more than you can afford to lose and closely monitor both price levels and institutional developments.
How to Buy SOL on BingX
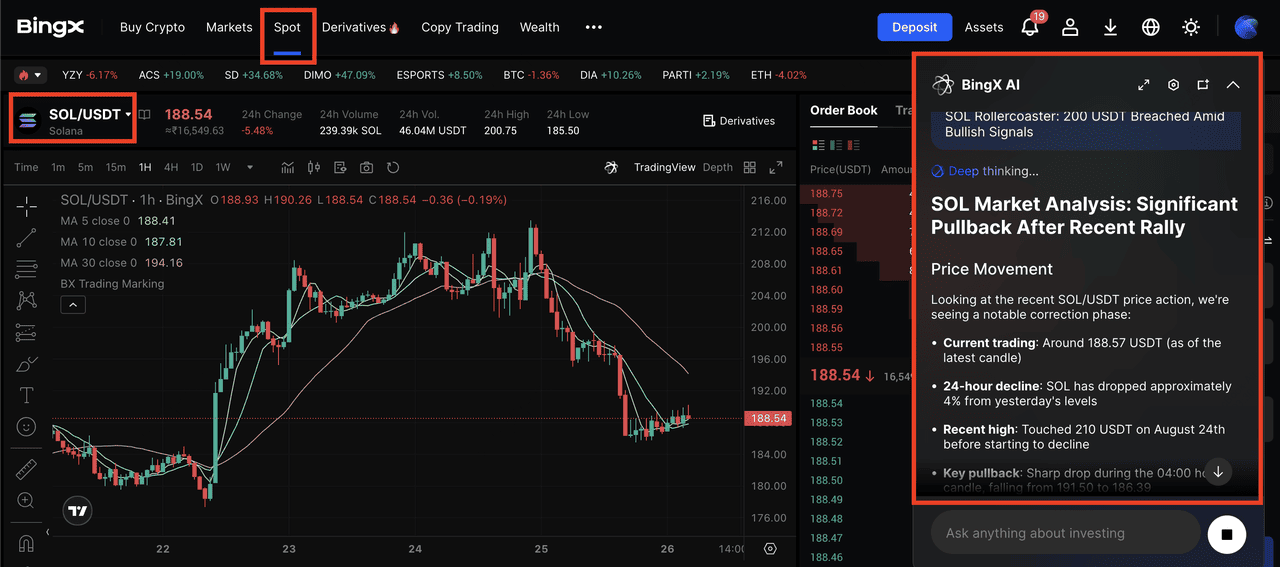
SOL/USDT trading pair on the spot market powered by BingX AI
Buying Solana (SOL) on BingX is simple and beginner-friendly.
1. First, create or log into your BingX account at bingx.com.
2. Next, deposit USDT through a credit card, bank transfer, or the P2P marketplace, which allows you to buy directly from other users.
3. Once your account is funded, go to the Spot trading section, search for the SOL/USDT pair, and place a market or limit order.
4. Your purchased SOL will instantly appear in your BingX wallet, ready for trading.
Tip: If you’re new, BingX also provides real-time price charts, order books, and BingX AI signals to help you make informed trading decisions before buying SOL.
Conclusion
With a potential $1 billion institutional fund in motion and technicals showing compression, Solana appears ready for its next move. The daily ascending triangle points toward $227–$245 if $210 breaks, while the monthly structure suggests a retest of $250 could unlock targets between $300 and $407.
For investors, Solana doesn’t look like a market running out of steam. Instead, the combination of institutional flows and bullish chart setups suggests SOL is preparing for its next major advance toward new highs.
