
Ever notice how Bitcoin tends to reverse around the same “odd” price zones, as if the market is following an unwritten rule? Nature might hold the answer. The Golden Ratio, a mathematical constant of about 1.618, appears in spiral galaxies, sunflower seed patterns, seashells, and Renaissance masterpieces. Surprisingly, it also shows up on crypto price charts when fear and greed battle for control.
In trading, one of its most important applications is the Fibonacci Golden Pocket, the retracement zone between 61.8% and 65%, where pullbacks often pause, reload, or reverse entirely. This zone reflects a natural point of balance between buyers and sellers, making it a key level for traders looking for high-probability entries.
In this guide, you’ll learn what the Golden Ratio is, how it applies to trading through the Golden Pocket, the step-by-step process to plot it on BingX TradingView, and when it can offer the most reliable trade setups.
By the end, you’ll have a clear, repeatable framework to integrate the Golden Ratio into your trading strategy, whether you’re analyzing Bitcoin, Ethereum, or any other liquid crypto asset.
What Is the Golden Ratio?
The Golden Ratio, represented by the Greek letter phi (φ), is a unique number of about 1.618, also called the Divine Proportion for its balance and symmetry. Imagine splitting a line so the whole length divided by the longer part equals the longer part divided by the shorter part; this ratio is always phi. Inverse it, and you get 0.618, a key level in financial markets, especially in Fibonacci-based trading strategies.
Phi is an irrational number, meaning it cannot be expressed as a simple fraction and its decimal expansion never repeats. It appears in natural patterns like seashell spirals, sunflower seeds, and in iconic architecture and art such as the Parthenon and Mona Lisa.
In trading, price moves often expand and contract in proportions close to phi, making the 61.8% retracement level a key focus. This connection between mathematics and market psychology forms the basis of the Fibonacci Golden Pocket.
From Fibonacci to Golden Pocket: How the Pattern Emerges
The Fibonacci sequence is a simple list of numbers where each is the sum of the two before it:
0, 1, 1, 2, 3, 5, 8, 13, 21...
As this sequence grows, the ratio between any number and the one before it gets closer to 1.618, the Golden Ratio. Flip that number, and you get 0.618, one of the most important retracement levels in trading.
When traders apply the Fibonacci retracement tool, they mark the recent swing low and swing high on a chart. The tool then plots key retracement levels: 0.382, 0.5, 0.618, and 0.65. The zone between 61.8% and 65% is called the Golden Pocket.
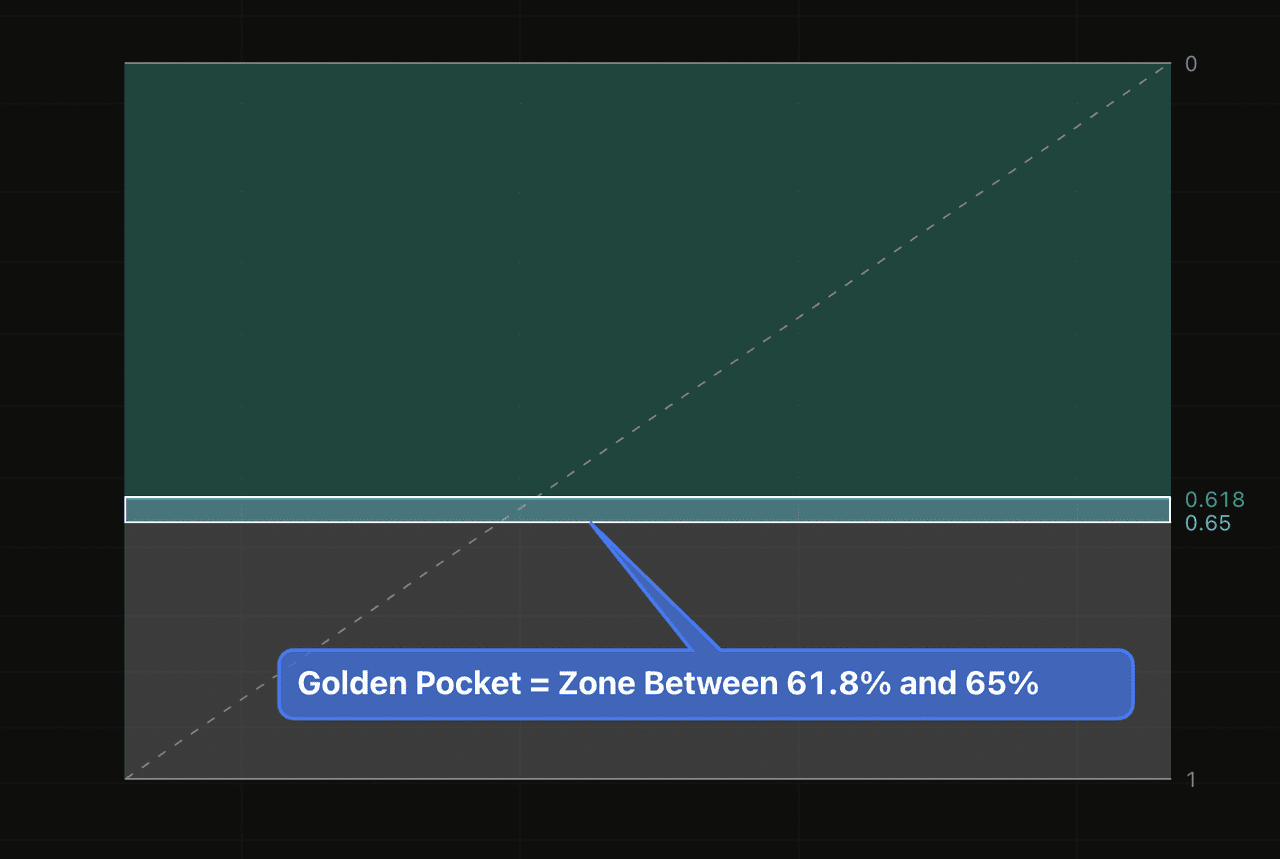
Source: BTC/USDT Trading Chart on BingX
This is where many pullbacks in a strong trend tend to stall and reverse because it often represents a natural equilibrium between buying and selling pressure. In crypto, it’s a sweet spot that reflects the psychology of the market, the point where fear of missing out (FOMO) meets profit-taking, creating ideal conditions for a trend to continue.
For traders, identifying this zone isn’t just about theory; it’s about finding high-probability entry points where risk is controlled and reward potential is strong.
How to Plot the Golden Pocket in BingX TradingView
Knowing the theory is one thing, but being able to mark the Golden Pocket on your chart is what turns it into a real trading tool. On BingX’s integrated TradingView charts, the process is quick, and you can even add the custom 0.65 level for maximum precision.
Follow these simple steps to plot the Golden Pocket:
1. Open your chart on BingX and select the trading pair you want to analyze.
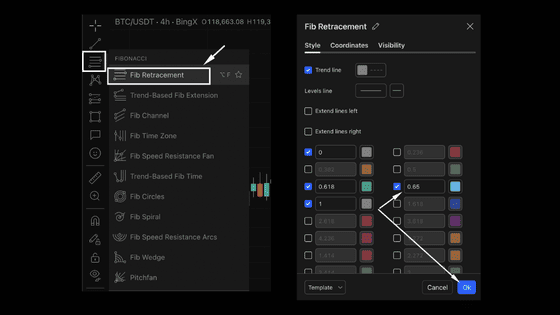
2. From the left-hand toolbar, choose the Fibonacci Retracement tool.
3. Click once at the swing low (start of the move) and then click at the swing high (end of the move) for an uptrend. For a downtrend, reverse the process, click swing high first, then swing low.
4. Your chart will now show the standard Fibonacci retracement levels, including 0.618.
Adding the Custom 0.65 Level
• Right-click on any Fibonacci line and select Settings (or double-click the lines to open the settings menu).
• Go to the Levels tab and click Add.
• In the value box, type 0.65 and choose a color that stands out (many traders use gold or orange for visual clarity).
• Click OK to save your changes.

Source: BTC/USDT Trading Chart on BingX
Now, your Fibonacci retracement tool will show both 0.618 and 0.65, clearly marking the Golden Pocket zone.
How to Use the Golden Pocket Once Plotted
When price retraces into the 0.618–0.65 zone:
• Look for signs of slowing momentum (candlestick reversal patterns, RSI divergence).
• Check if the zone overlaps with previous support/resistance or moving averages for extra confirmation.
• If conditions align, plan your entry, set your stop-loss below the Golden Pocket (or above it in a short trade), and aim for a reward-to-risk ratio that fits your trading plan.
By combining this plotting method with sound risk management, the Golden Pocket can shift from visual curiosity to a repeatable, data-backed trading edge.
How to Use the Golden Pocket in Crypto Trading
On the BTC/USDT daily chart, Bitcoin dropped from around $122,000 to near $112,000, landing inside the Golden Pocket, the 61.8% to 65% Fibonacci zone, before reversing higher.
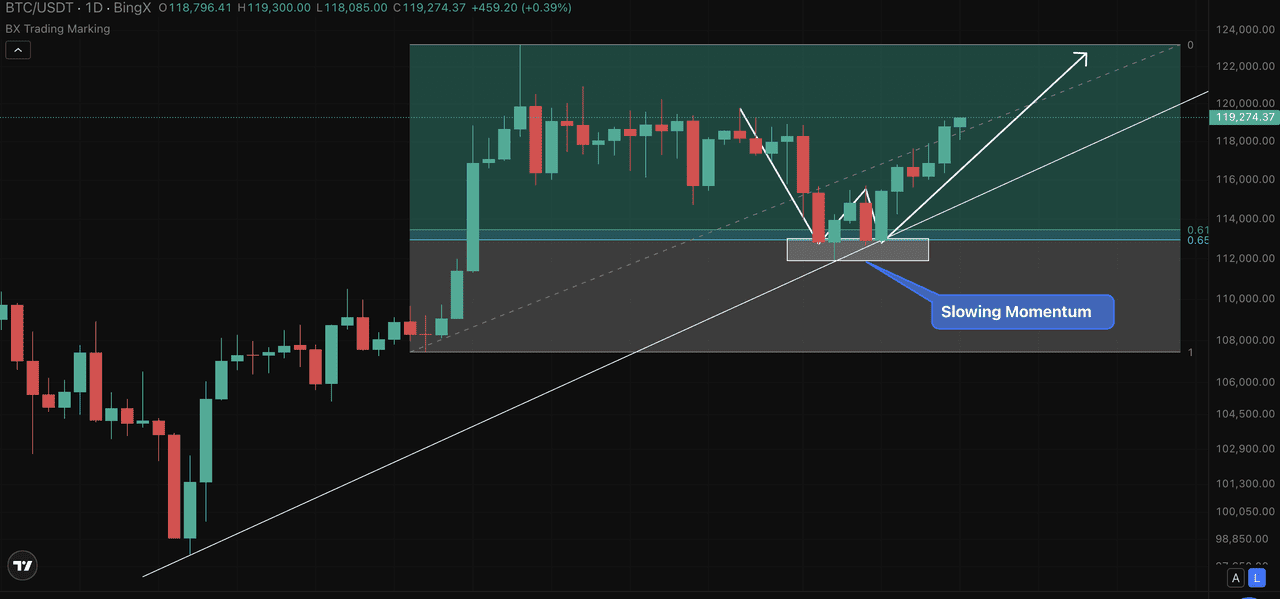
Source: BTC/USDT Trading Chart on BingX
The Fibonacci retracement tool on BingX’s TradingView charts measures the move between a swing high and swing low, plotting percentage retracement levels. The Golden Pocket is the most watched zone, often marking a balance point where sellers take profits and buyers re-enter.
How Crypto Traders Use the Golden Pocket
1. Identify the latest trend move.
2. Apply the Fibonacci tool from swing low to swing high (or vice versa for a downtrend).
3. Focus on the 0.618–0.65 zone.
In this BTC example, the retracement aligned with slowing momentum and bounced sharply. When combined with support/resistance, trendlines, or momentum indicators, it becomes a high-probability entry area with defined risk.
Why the Golden Ratio Works in Financial Markets
The Golden Pocket is not just a technical coincidence. It is rooted in market psychology and order flow dynamics. At the 61.8% to 65% retracement zone, three powerful forces often converge:
1. Profit-taking by early buyers – Traders who entered near the start of the move often lock in gains here, adding short-term selling pressure.
2. Re-entry by trend followers – Swing traders and institutions view the Golden Pocket as a “discount zone” to add to positions in the direction of the main trend.
3. Liquidity clustering – Many pending limit orders accumulate around Fibonacci levels, turning the Golden Pocket into a high-activity price band.
This mix of activity makes the zone a self-fulfilling technical level.
• Sellers expect buyers to step in here, so they close short positions.
• Buyers expect a bounce, so they position aggressively.
Markets of all kinds, including stocks, forex, commodities, and crypto, show the same harmonic retracement behavior. In crypto, where volatility is higher, these levels can produce sharp reactions, especially when they overlap with:
• Previous support or resistance zones
• Major moving averages such as the 50 EMA, 100 EMA, or 200 EMA
• Momentum exhaustion signals on RSI or MACD
In short, the Golden Pocket works because it sits at the intersection of mathematics, psychology, and liquidity. This makes it one of the most reliable reaction zones for traders who combine it with proper confirmation tools.
Fibonacci Golden Pocket Trade Setup Example
The chart below shows a BTC/USDT daily setup using the Golden Pocket as the primary entry signal.
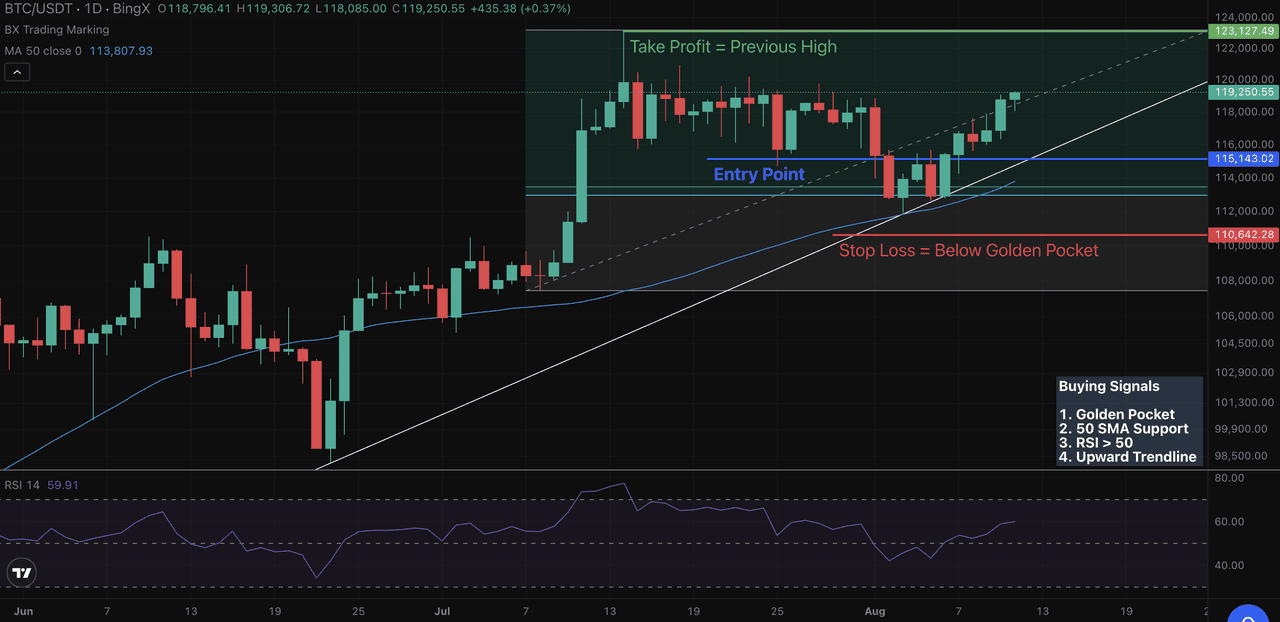
Source: BTC/USDT Trading Chart on BingX
Trade context: Bitcoin rallied to around $123,127 before pulling back toward the $115,143 area, which is inside the 0.618–0.65 Golden Pocket zone. This retracement aligned with multiple bullish confluences:
1. Price touching the 50-day SMA (blue line)
2. RSI holding above 50, suggesting positive momentum
3. Price respecting the upward trendline
Entry: A long entry is placed inside the Golden Pocket zone at approximately $115,143 once price shows signs of stalling or bouncing.
Stop Loss: Below the Golden Pocket and recent swing low, around $110,642, to protect against a deeper sell-off.
Take Profit: Targeting the previous swing high near $123,127, which offers a favorable reward-to-risk ratio.
Combining Goldn Pocket with Other Technical Indicators
This setup combines the Golden Pocket with trend confirmation from multiple indicators. In this example, it is supported by the Simple Moving Average (SMA), Relative Strength Index (RSI), and the upward trendline. However, traders can increase confirmation by adding other tools such as the Moving Average Convergence Divergence (MACD), Parabolic Stop and Reverse (Parabolic SAR), Bollinger Bands (BB), or volume analysis. These additional indicators can help identify whether the retracement is likely to reverse or continue.
Timeframe: The Golden Pocket is also timeframe-agnostic. It can be applied to intraday charts like the 5-minute or 15-minute for scalping, 1-hour or 4-hour for swing trading, or daily and weekly charts for long-term analysis. The concept remains the same: identify the 0.618–0.65 retracement zone, combine it with other confirming indicators, and trade with a clear plan for entries, stops, and targets.
Common Mistakes When Trading the Golden Pocket
Even though the Golden Pocket is one of the most reliable Fibonacci zones, it is not foolproof. New traders often make these mistakes, which can turn a good setup into a losing trade:
1. Trading every 0.618 retracement without context: Not every retracement into the Golden Pocket will reverse. If the broader trend is weak or the market is in consolidation, the zone may fail. Always check for trend direction first.
2. Ignoring confluence: The Golden Pocket works best when supported by other signals such as moving averages, RSI, MACD, or price action patterns. A level without confluence is less reliable.
3. Placing stops too tight: Setting a stop right at 0.618 or 0.65 can lead to getting stopped out by normal volatility. It is safer to place stops slightly beyond the Golden Pocket, often near the 0.786 retracement.
4. Misplotting swing highs and lows: Incorrectly selecting the start and end points for the Fibonacci tool will shift the Golden Pocket zone, making it meaningless. Always use clear swing highs and swing lows from significant moves.
5. Over-leveraging: Even the best setups can fail. Using excessive leverage increases the risk of liquidation if the trade moves against you before reversing.
By avoiding these mistakes and combining the Golden Pocket with strong confirmation tools, traders can significantly improve their win rate and consistency.
Conclusion: Golden Ratio Is More Than Aesthetic, It’s Actionable
The Golden Ratio is not just a concept from art or nature. In trading, it powers the Fibonacci Golden Pocket, a 61.8% to 65% retracement zone where trends often pause or reverse. When combined with confirmation from tools such as the Simple Moving Average (SMA), Relative Strength Index (RSI), Moving Average Convergence Divergence (MACD), Parabolic Stop and Reverse (Parabolic SAR), and Bollinger Bands (BB), it becomes a reliable framework for spotting high-probability setups.
This approach works on any liquid market and across all timeframes. The key is discipline: wait for confluence, manage risk carefully, and let the market come to you. Used correctly, the Golden Pocket can turn a timeless mathematical ratio into a practical trading edge.
Related Reading
3. Simple Moving Average(SMA) vs Exponential Moving Average(EMA) in Crypto Trading: Differences to Know
FAQs on the Fibonacci Golden Pocket
1. What is the Fibonacci Golden Pocket?
The Fibonacci Golden Pocket is the price zone between the 61.8% and 65% retracement levels. It is considered a high-probability area where trends often pause or reverse.
2. Why is 0.618 important in crypto trading?
The 0.618 level comes from the Golden Ratio (phi ≈ 1.618). It appears frequently in nature, art, and financial markets, making it a key level for measuring retracements and identifying potential reversal zones.
3. Is the Golden Ratio Effective?
The Golden Ratio is a mathematical constant found in many natural patterns and man-made designs. In trading, its effectiveness comes from crowd psychology and market behavior repeating at these proportions.
4. How do I draw Fibonacci levels in TradingView?
Select the Fibonacci Retracement tool, click at the swing low and drag to the swing high for an uptrend (reverse for a downtrend). Enable 0.618 and add 0.65 to mark the Golden Pocket.
5. Can Fibonacci be used on lower timeframes?
Yes. Fibonacci retracement works on any timeframe, from 1-minute charts to weekly charts. Shorter timeframes suit scalping and day trading, while higher timeframes work better for swing and position trading.
