In crypto trading, recognizing continuation patterns like bullish and bearish flags, can be the difference between catching a breakout early or missing it altogether. These flag patterns help traders identify when a strong trend is simply pausing before continuing in the same direction.
By learning to read these formations, traders can spot potential entry and exit points, improve timing, and manage risk more effectively.
This guide explains everything you need to know about bullish vs bearish flag patterns in crypto trading, from how they form to how you can use them in your technical analysis to better anticipate future price movements.
What Are Flag Patterns in Crypto Trading?
A flag pattern is a short-term consolidation that appears after a sharp price movement known as the flagpole. It reflects a temporary pause in the market before the trend resumes in the same direction. The pattern resembles a small rectangle or parallelogram, shaped by two parallel trend lines that slope slightly against the prevailing trend.
In technical analysis, flag formations are classified as either bullish or bearish, depending on whether they occur in an uptrend or a downtrend.
Key components of a flag pattern:
• Flagpole: The initial strong price movement.
• Flag: The consolidation phase is bounded by parallel lines.
• Breakout point: Where price exits the flag to resume the main trend.
Unlike reversal patterns, which signal a trend change, continuation patterns like flags indicate the existing trend is likely to continue.
What Is the Bullish Flag Pattern in Crypto Trading?
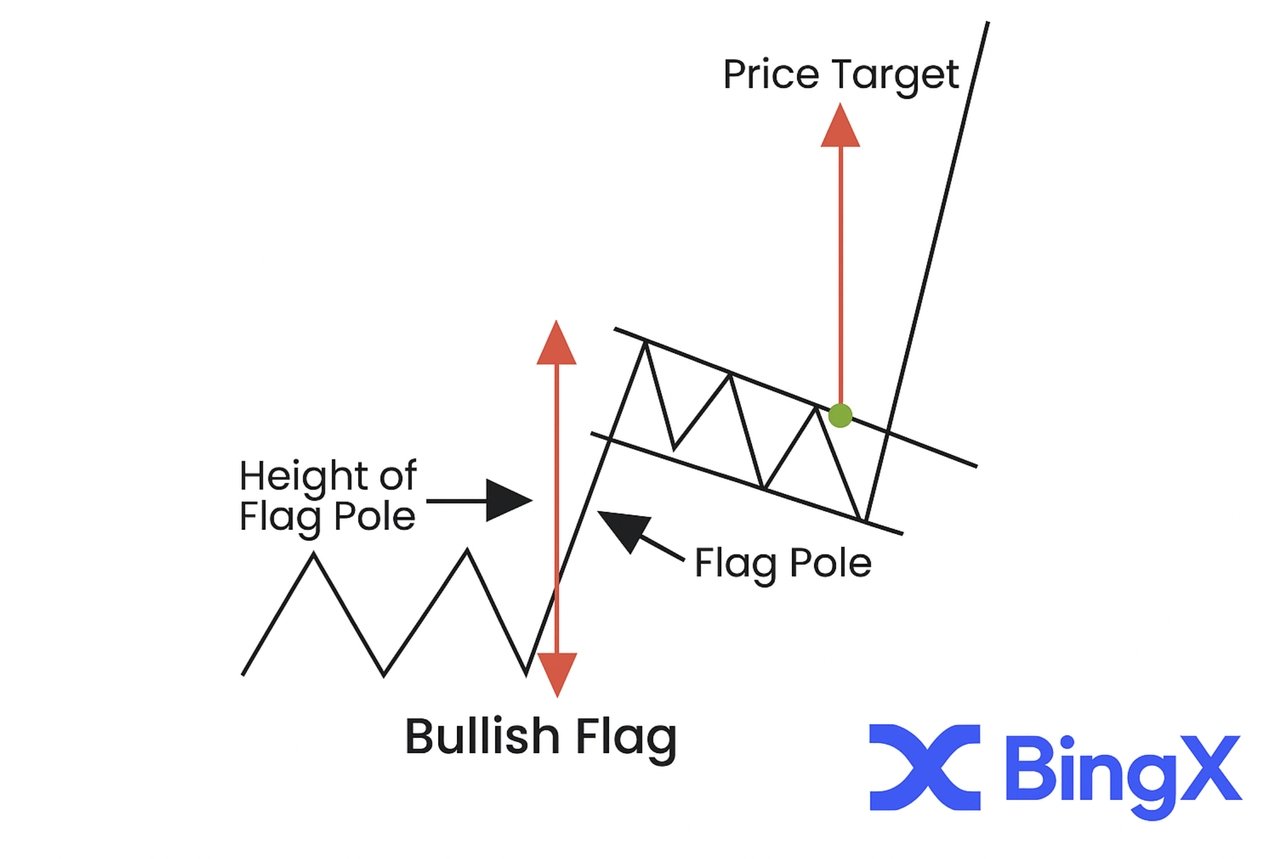
A bullish flag pattern forms during an upward trend when prices surge sharply, pause briefly, and then continue higher. It begins with an impulsive rise called the flagpole, created by strong buying pressure that pushes prices upward in a short time.
Following this move, the market enters a mild consolidation known as the flag, which slopes slightly downward and is confined by two parallel trend lines. This stage represents a period where traders take profits while buyers prepare for the next leg up.
A bull flag breakout occurs when the price moves above the upper trend line, often confirmed by increased trading volume. This signals renewed bullish momentum and continuation of the previous trend.
Example:
• Flagpole: A rapid 15% price surge in Bitcoin.
• Flag: A tight 3–5% downward drift forming a small channel.
• Breakout: Price closes above resistance with volume expansion, confirming a bullish continuation pattern.
The bullish flag pattern helps traders identify strong market momentum and plan entries before the next upward wave.
What Is the Bearish Flag Pattern?
A bearish flag pattern appears during a downward trend and signals the continuation of bearish momentum. It starts with a sharp and nearly vertical price decline, known as the flagpole, which reflects strong selling pressure in the market.
After this steep drop, prices enter a short upward correction, creating the flag portion that slopes slightly upward and is contained by two parallel trend lines. This phase indicates temporary profit-taking or reduced selling intensity before the next move lower.
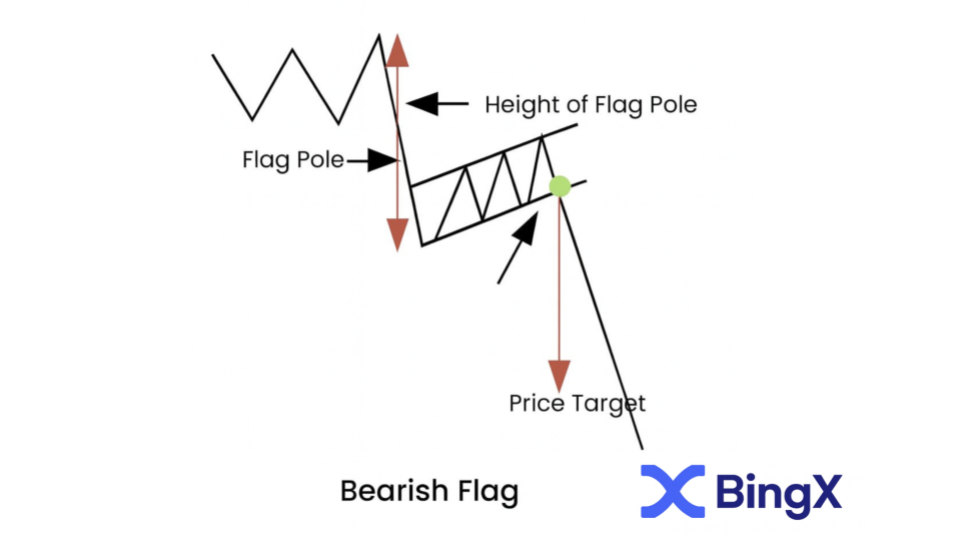
A bear flag breakout occurs when the price falls below the lower trend line with a noticeable increase in trading volume, confirming that sellers have regained control.
Example:
• Flagpole: A sharp 10–20% decline in the asset’s price.
• Flag: A minor rebound forming an upward-sloping channel.
• Breakdown: Price breaks below the lower trend line and starts the next downward leg.
The bearish flag chart pattern helps traders identify when a pullback in a bearish trend is likely to end, offering opportunities to enter short positions and align with the prevailing market direction.
Key Differences Between Bullish and Bearish Flags
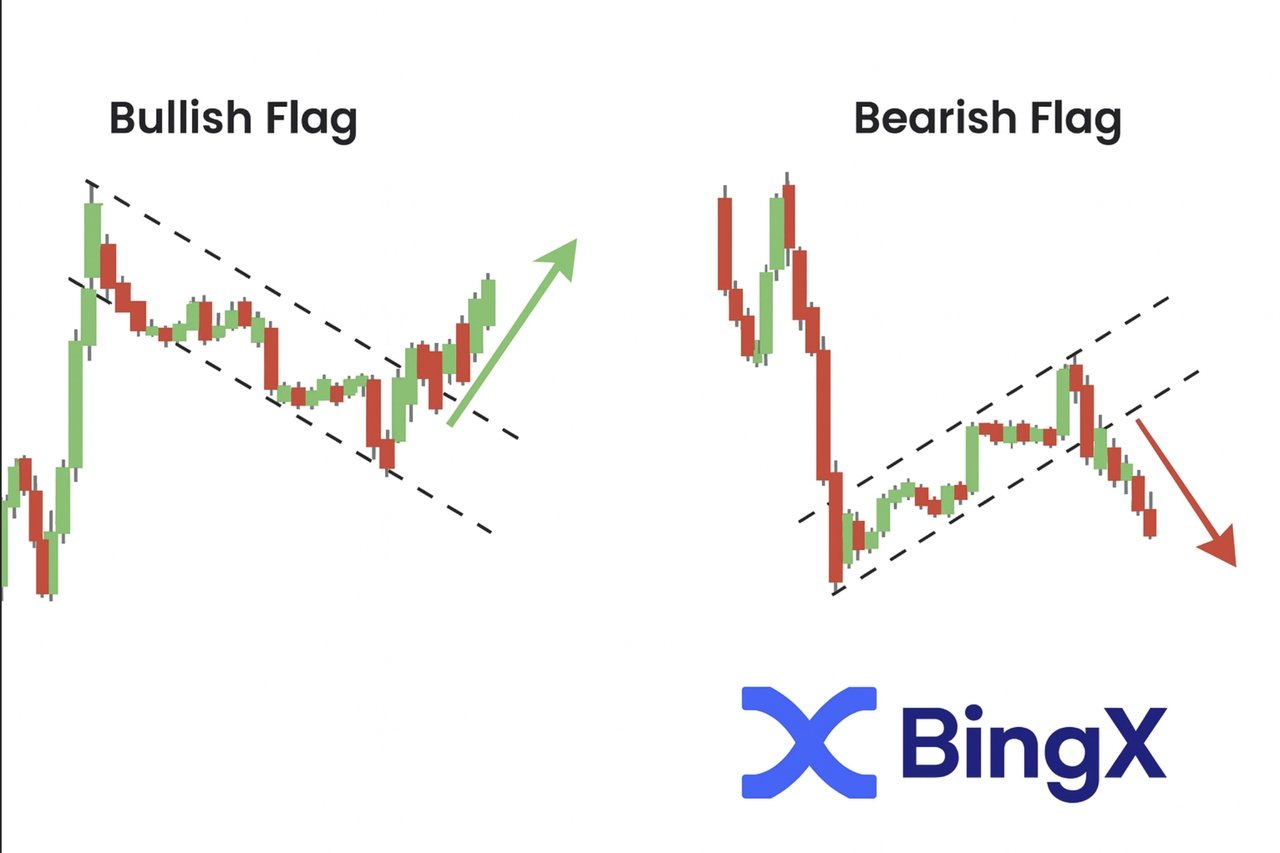
Both bullish and bearish flag patterns share a similar structure but occur in opposite market conditions. The main distinctions lie in the trend direction, flag slope, and breakout behavior.
| Aspect | Bullish Flag | Bearish Flag |
| Trend Direction | Uptrend continuation | Downtrend continuation |
| Flag Slope | Downward | Upward |
| Breakout | Above resistance | Below support |
| Trading Signal | Long entry | Short entry |
| Market Sentiment | Bullish momentum | Bearish pressure |
Comparison:
• Trend Direction: Bullish flags appear in uptrends, while bearish flags form in downtrends.
• Flag Slope: Bullish flags slope slightly downward against the prevailing uptrend. Bearish flags slope upward against the prevailing downtrend.
• Breakout Point: Bullish flags break above resistance, signaling trend continuation. Bearish flags break below support, confirming further downside.
• Market Sentiment: Bullish flags reflect growing optimism and accumulation. Bearish flags indicate persistent selling pressure and pessimism.
• Trading Approach: Traders go long on bullish breakouts and short on bearish breakdowns.
These patterns mirror market psychology, where bullish flags reveal buyers regaining control after a pause, and bearish flags highlight sellers dominating the market. Understanding this contrast between optimism and pessimism helps traders anticipate momentum shifts and make more informed decisions based on market sentiment and flag chart pattern behavior.
How to Trade Flag Patterns in Crypto
Trading flag patterns involves spotting a strong move, identifying the consolidation, and waiting for a breakout confirmation. These setups work because they reveal moments when momentum pauses before resuming in the same direction.
Here’s how to trade them effectively:
1. Identify the Flagpole: Find a sharp, near-vertical move that establishes trend direction.
2. Draw Parallel Lines: Connect the highs and lows to outline the flag’s consolidation channel.
3. Confirm Volume Drop: During this flag phase, trading volume should decrease as price compresses.
4. Spot Breakout Point: Wait for a decisive move above (bullish flag) or below (bearish flag) the flag boundary with higher volume.
5. Set Entry and Exit Points:
• Entry: Near the breakout candle once confirmed.
• Exit: Use the flagpole’s length to project the price target and set a stop-loss beyond the opposite side of the flag.
How to Trade a Bullish Flag Setup
A bearish flag forms when the market is on a rise, pauses for a brief recovery, and then continues higher. In the chart below, Bitcoin formed a clear bullish flag following a strong rally.
The flagpole represented a rapid price surge, followed by a downward consolidation channel.
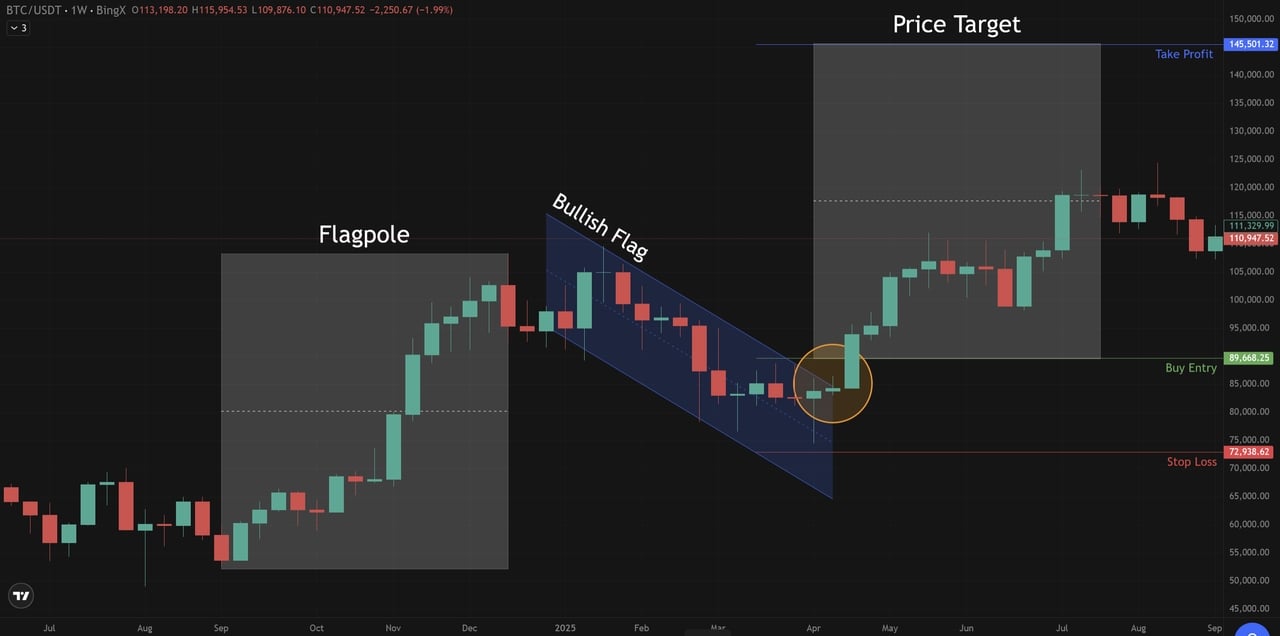
Bitcoin (BTC/USD) Price Chart - Source: BingX
The breakout candle signaled a buy entry near $89,668 with a stop-loss at $72,938 and a projected take-profit around $145,501, aligning with the flagpole’s measured target.
How to Trade a Bearish Flag Setup
A bearish flag forms when the market drops sharply, pauses for a brief recovery, and then continues lower. It’s one of the clearest continuation patterns, but even the best technical setups can fail if fundamentals change suddenly. News like regulatory updates, major exchange issues, or macroeconomic shifts can easily trigger a reversal.
To trade this pattern effectively, always combine technical analysis with fundamental awareness. The goal is to protect your capital, not just chase the full target.
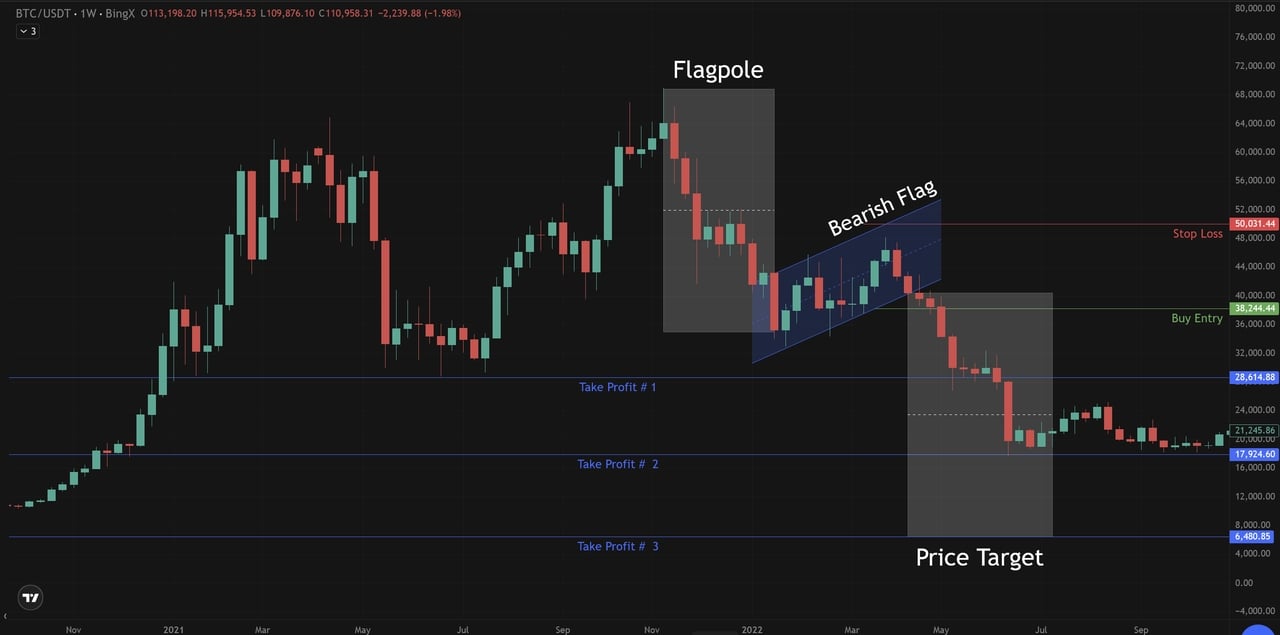
Bitcoin (BTC/USD) Price Chart - Source: BingX
Here’s how to approach it smartly:
• Confirm the setup: Look for a sharp decline (the flagpole) followed by a short upward channel (the flag).
• Wait for the breakdown: A candle closing below the lower trend line confirms bearish momentum.
• Plan your trade:
- Entry: Near the breakout point, around $38,244.
- Stop-loss: Above the upper flag line, around $50,031.
- Take-profit zones: $28,614, $17,924, and $6,480.
• Take profits gradually: Closing portions of the trade at each support level helps secure gains.
Even if the pattern suggests a larger move equal to the flagpole’s size, never rely on it completely. Use price action, volume, and market news to guide your decisions, and stay flexible when conditions change.
How to Combine Flag Patterns with Other Technical Indicators
Trading flag patterns become far more effective when combined with other technical indicators. These tools help confirm breakouts, avoid false signals, and identify when market conditions are shifting.
In the example above, Bitcoin formed a clear bearish flag during its broader downtrend. While the pattern projected a full continuation toward the lower price target zone, traders who used the Relative Strength Index (RSI) and Moving Average Convergence Divergence (MACD) noticed early signs of a potential reversal, helping them lock in profits sooner instead of waiting for deeper targets.
Here’s how to combine them effectively:
1. RSI Confirmation
When the Relative Strength Index (RSI) dropped below 30, Bitcoin entered the oversold zone, as shown on the chart around June 2022. This indicated that selling pressure was stretched and a rebound was likely. Traders who recognized this signal could have taken partial profits at $17,924 instead of holding for the final $6,480 target, which carried higher risk.
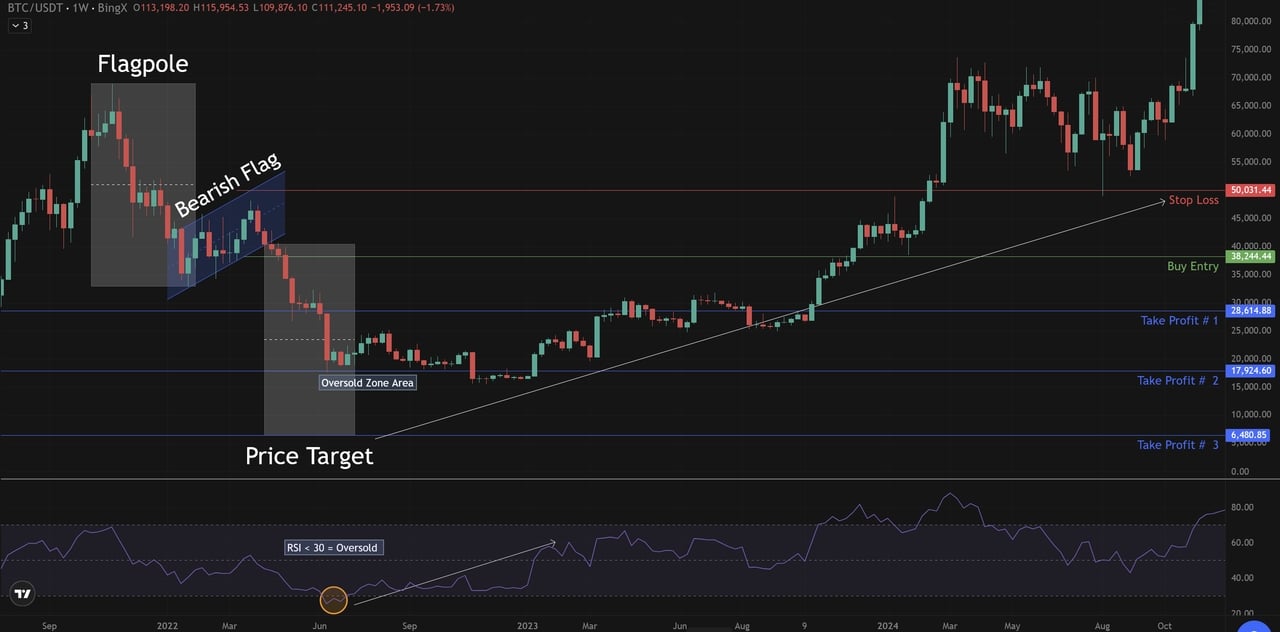
Bitcoin (BTC/USD) Price Chart - Source: BingX
2. MACD Confirmation
Around the same period, the MACD histogram flipped positively, and the MACD line crossed above the signal line, forming a bullish crossover. This was a clear sign that bearish momentum had ended and buying strength was returning.
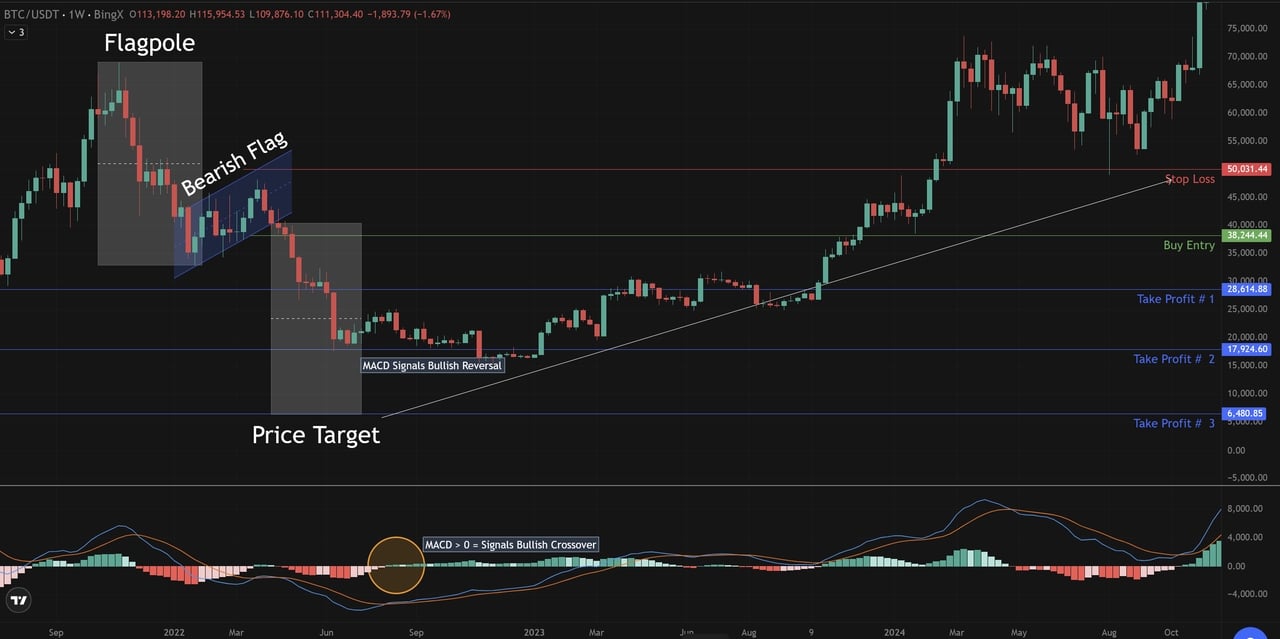
Bitcoin (BTC/USD) Price Chart - Source: BingX
These confirmations are crucial because they show traders that while the bearish flag pattern pointed to a deeper decline, both RSI and MACD were signaling that the market was bottoming out.
This insight helps investors adjust expectations, secure profits earlier, and avoid unnecessary exposure when technical analysis suggests that a trend reversal is underway.
How to Manage Risks and Set Profit Targets When Trading Flag Patterns
Effective risk management is essential when trading flag setups. Always place a stop-loss just beyond the opposite side of the flag to protect against unexpected reversals. The flagpole’s length can be used to estimate the profit target, projecting the potential move after the breakout.
Aim for a risk-to-reward ratio of at least 1:2, meaning every dollar risked should aim for two in return. Keep your position size consistent with your account balance and avoid overexposure.
Combining technical and fundamental analysis helps identify when to stay in or exit trades, ensuring decisions remain balanced across different financial markets.
How to Avoid Common Mistakes in Bull and Bear Flag Patterns
Many traders lose momentum due to avoidable errors when interpreting chart patterns. The most common include:
• Entering before the breakout is confirmed.
• Ignoring volume reduction during the flag phase.
• Confusing reversal patterns, such as the head and shoulders, with continuation flags.
• Over-leveraging or skipping stop-loss protection.
To avoid these pitfalls, focus on confirmation, volume analysis, and disciplined execution. Successful traders rely on price action and patience rather than impulsive entries. Waiting for clean setups often leads to higher accuracy and more consistent results over time.
By learning from these common errors and combining both technical and fundamental signals, traders can steadily build confidence and precision in flag pattern setups.
Conclusion
Both bullish and bearish flag patterns give traders a clear way to spot continuous trends and plan trades with confidence. By understanding flag formation and using proper confirmation tools like RSI, MACD, and volume analysis, traders can filter false signals and improve timing.
However, success depends on discipline and risk control; always manage position size, set stop-loss levels, and take partial profits when momentum weakens. To master these techniques, explore crypto chart patterns on BingX, where you can practice spotting bullish and bearish flag setups in real-time market conditions.
Related Reading
7. Simple Moving Average(SMA) vs Exponential Moving Average(EMA) in Crypto Trading: Differences to Know
FAQs on Bull and Bear Flag Chart Patterns
1. What is a flag pattern in crypto trading?
A flag pattern is a short-term consolidation that occurs after a sharp price move, forming a small rectangular channel. It signals a pause before the trend continues in the same direction.
2. How can I tell if a flag is bullish or bearish?
A bullish flag forms after an uptrend and slopes slightly downward, while a bearish flag forms after a downtrend and slopes slightly upward. The direction of the breakout confirms the pattern type.
3. How do I confirm a flag breakout?
A breakout is confirmed when the price closes outside the flag boundary with higher trading volume. Additional confirmation can come from indicators like RSI or MACD showing momentum alignment.
4. Which technical indicators work best with flag patterns?
Indicators such as the Relative Strength Index (RSI), MACD, and moving averages help validate breakout strength and detect early reversals, reducing the risk of false signals.
5. What’s the best strategy to trade flag patterns safely?
Wait for a confirmed breakout, set a stop-loss beyond the opposite flag boundary, and use partial profit targets at support or resistance levels to manage risk and secure gains.
