The Bitcoin Rainbow Chart is a widely followed tool for visualizing Bitcoin’s long-term price trends and market cycles. As of July 2025, Bitcoin is trading in the "HODL!" (yellow) band after breaking past $118,000, signaling fair valuation. Notably, analysts at Coin World recently reported that the chart predicts a potential 120% gain to $200,000 by late 2025, with the peak possibly arriving in Q4. This forecast, based on previous cycles, has sparked both excitement and debate, as some traders question the model’s ability to account for new market forces like Bitcoin ETFs and institutional inflows. While promising, the Rainbow Chart is not foolproof and should be used with caution alongside other indicators.
By learning how to read the Bitcoin Rainbow Chart, you can identify historical price patterns, assess market sentiment, and refine your trading strategies. Is Bitcoin entering a new bull cycle? Or is it nearing overheated territory? Understanding the Rainbow Chart equips you with insights that go beyond simple price charts, making it a useful companion for crypto trading.
Ready to add this colorful tool to your trading arsenal? Let’s dive into how the Bitcoin Rainbow Chart works and how you can use it for smarter crypto trading decisions.
What Is the Bitcoin Rainbow Chart?
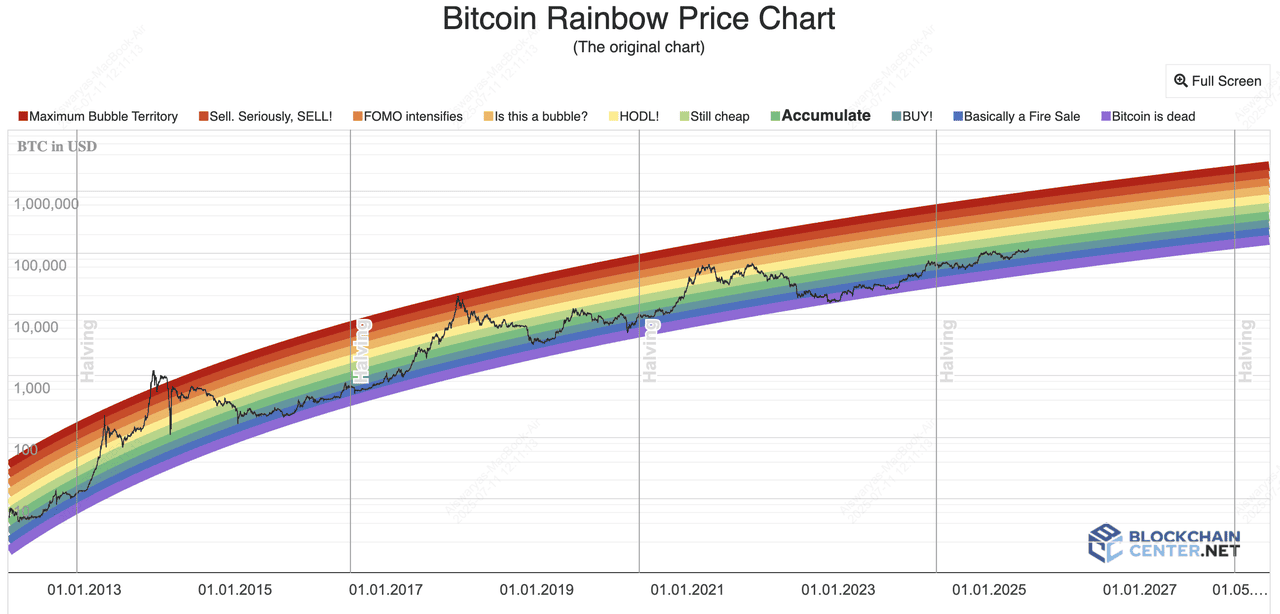
The original Bitcoin price rainbow chart | Source: BlockchainCenter
The Bitcoin Rainbow Chart is a visual tool that helps traders and investors analyze Bitcoin’s price history and market sentiment across different phases of its lifecycle. Built on a logarithmic regression model, the chart smooths out Bitcoin’s extreme volatility over time and overlays it with a series of color bands. Each band represents a distinct sentiment zone, ranging from “undervalued” to “overvalued,”based on historical price behavior.
Here’s what each band means:
• Dark Blue (“Fire Sale”): Historically, Bitcoin trading in this zone has often marked cycle bottoms. For example, in March 2020’s COVID crash, BTC briefly dipped into this band around $5,000, preceding a massive rally.
• Cyan (“BUY!”): A strong accumulation phase where prices have been highly undervalued.
• Green (“Accumulate”): Signals a favorable zone for long-term investors to build positions.
• Light Green (“Still Cheap”): Suggests Bitcoin is still priced reasonably but starting to heat up.
• Yellow (“HODL!”): Indicates fair valuation. Traders often hold rather than make big moves.
• Orange (“Is This a Bubble?”): Caution zone where Bitcoin could be entering speculative territory.
• Red (“FOMO Intensifies”): Suggests overvaluation and growing fear of missing out among investors.
• Dark Red (“Maximum Bubble Territory”): Historically seen at cycle peaks, like BTC’s $64,000 top in April 2021.
The current Bitcoin Rainbow Chart (V2) is available on BlockchainCenter and TradingView, and it’s widely used by traders to understand whether Bitcoin’s price aligns with historical trends or is deviating into extreme zones.
This tool is particularly helpful for long-term investors seeking to avoid emotional decisions and focus on where Bitcoin sits in its broader market cycle.
When Was the Bitcoin Rainbow Chart Created?
The original chart was introduced in 2014 by Reddit user “azop” as a fun visualization of Bitcoin’s price history on a logarithmic scale. It lacked the curved "rainbow bow" shape and instead featured straight color bands.
In 2019, a BitcoinTalk user nicknamed "Trolololo" inspired a new version with a refined logarithmic regression formula. Later, BlockchainCenter’s Rohmeo released Bitcoin Rainbow Chart V2, which uses improved data modeling to track Bitcoin’s performance more accurately.
While initially created as a meme, the chart has become a popular reference for traders and investors looking for a high-level view of market trends.
How Does Bitcoin Rainbow Chart V2 Differ from the Original?

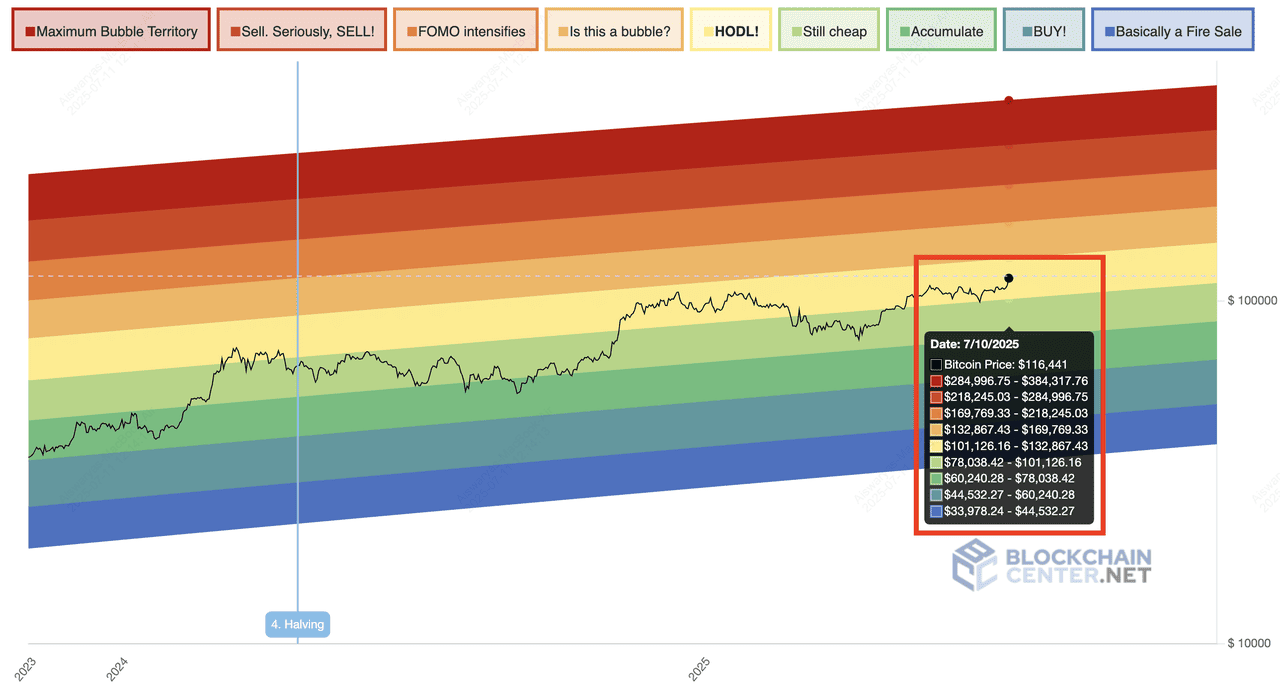
Bitcoin rainbow chart v2 | Source: BlockchainCenter
The original Bitcoin Rainbow Chart, created in 2014 by Reddit user “azop,” used straight color bands applied to Bitcoin’s log scale price history. It was more of a fun visualization than a technical tool. In 2019, BlockchainCenter’s Rohmeo refined the concept and introduced Bitcoin Rainbow Chart V2. This update made significant improvements to its design and methodology.
Key differences between the original BTC rainbow chart and V2 include:
| Feature | Bitcoin Rainbow Chart V1 | Bitcoin Rainbow Chart V2 |
| Shape | Straight color bands | Bow-shaped, curved bands |
| Formula | Simple historical extrapolation | Logarithmic regression with refinements |
| Predictive Reliability | Lower, less robust during price extremes | Improved fit for price extremes |
| Purpose | Meme-like visualization | More technical, serious tool |
| Availability | Limited sites | Hosted on BlockchainCenter, TradingView |
The bow shape of V2 adapts better to Bitcoin’s volatility over time. It also adjusts for periods when prices fell below V1’s lowest band, preventing the chart from “breaking” during bear markets.
How to Use the Bitcoin Rainbow Chart
You can access the live Bitcoin Rainbow Chart at BlockchainCenter. Here’s how to interpret and use it effectively:
1. Identify Bitcoin's Current Price Band
Locate Bitcoin’s current price within the colored bands. As of July 2025, BTC sits in the yellow "HODL!" zone, suggesting a fairly valued market.
2. Interpret Crypto Market Sentiment
Each color band reflects investor sentiment:
• Cooler colors (blue/green): Historically correlated with undervaluation and accumulation phases.
• Warmer colors (orange/red): Associated with market exuberance and potential overvaluation.
3. Combine With Other Indicators
ile the Rainbow Chart gives a clear long-term view, it works best when paired with other tools for a more complete trading strategy. Here’s how you can complement it:
• Technical Indicators: Add Relative Strength Index (RSI) to spot overbought or oversold conditions, Moving Average Convergence Divergence (MACD) for trend shifts, and moving averages (like 50-day or 200-day MA) for support and resistance levels.
• Volume Analysis: Rising volumes during price moves often confirm strong market momentum. For example, if Bitcoin enters the “FOMO Intensifies” band with unusually high trading volume, it may indicate a strong rally but also heightened risk.
• Macro Factors: Keep an eye on economic trends such as interest rates, inflation, and global liquidity. In 2024, for instance, Bitcoin’s surge past $100,000 coincided with declining U.S. interest rates and increased institutional inflows, factors that aren’t reflected in the Rainbow Chart alone.
By combining these elements, you can make more informed decisions and reduce the risk of relying on a single indicator.
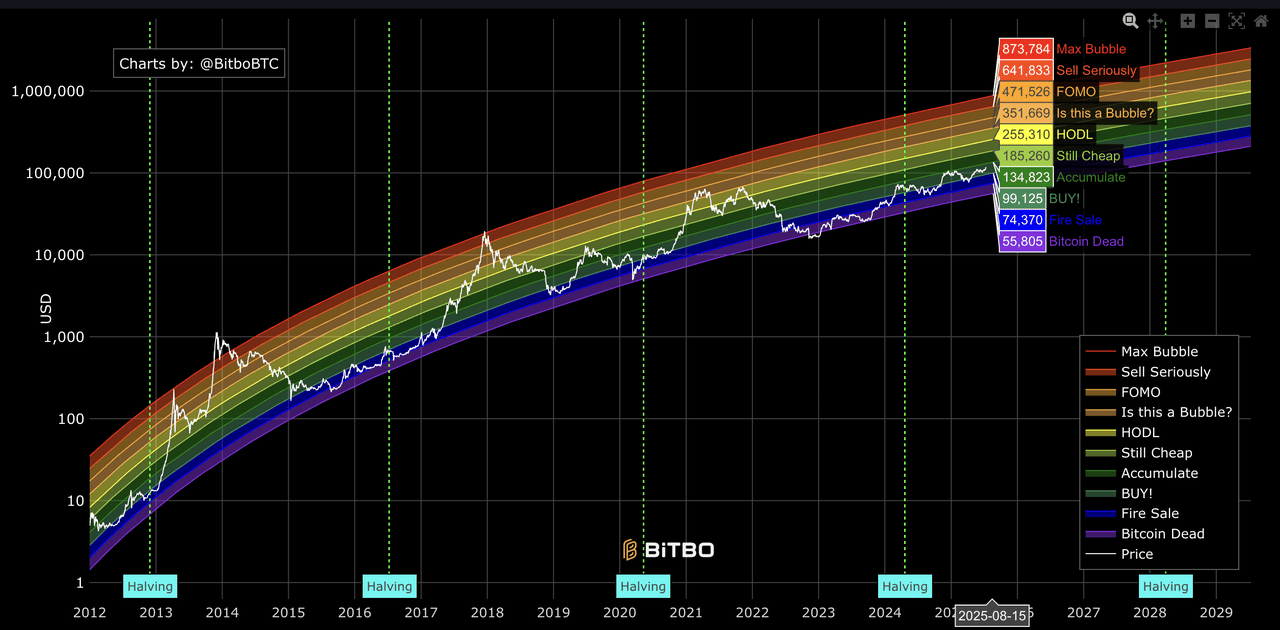
Predicting Bitcoin price in the near-term with rainbow chart | Source: BitBo
4. Plan Entries and Exits
Historically, Bitcoin purchases in the blue or green bands yielded strong long-term returns, while sales in red bands helped lock in profits before corrections.
Is the Bitcoin Rainbow Chart Reliable?
The Bitcoin Rainbow Chart is a popular reference for understanding Bitcoin’s historical price action, but its accuracy as a predictive tool remains debated. Unlike real-time technical indicators, it’s based entirely on historical data and assumes Bitcoin will continue following long-term logarithmic growth trends. This makes it better suited for big-picture insights rather than short-term trading.
Here’s why:
• Logarithmic Regression: The Rainbow Chart uses a log regression curve to smooth Bitcoin’s volatile price movements over time. This helps illustrate long-term trends but can overlook sudden market shifts caused by events like regulatory crackdowns or ETF approvals.
• Subjective Banding: The color bands are not derived from fundamental metrics; they are fitted to historical price patterns. For example, during the 2021 bull run, Bitcoin briefly exceeded the “Maximum Bubble Territory” band, highlighting how extreme rallies can outpace the model.
• Historical Context: The chart reflects past market cycles but does not guarantee future results. New variables, like institutional adoption, Layer 2 innovations, or macroeconomic shocks, can change Bitcoin’s trajectory.
How Does the BTC Rainbow Chart Compare with Other Popular Trading Indicators?
The Rainbow Chart differs from other tools commonly used in crypto trading:
| Indicator | Focus | Strengths | Limitations |
| Bitcoin Rainbow Chart | Long-term price phases | Visual, beginner-friendly, cycle awareness | Not ideal for short-term trades |
| Stock-to-Flow (S2F) | Scarcity-based price modeling | Highlights Bitcoin’s halving cycles | Accuracy questioned post-2021 |
| Bitcoin Dominance (BTC.D) | Market share of Bitcoin | Shows BTC vs. altcoin capital flow | Doesn’t signal exact entry/exit points |
| Pi Cycle Top Indicator | Predicting market tops | Historically accurate in flagging tops | Less useful for bottom signals |
| Fear & Greed Index | Sentiment gauge | Quick snapshot of market emotions | Can swing rapidly with news cycles |
By comparing these tools, traders can see that the Rainbow Chart is best for long-term valuation perspectives, while indicators like Bitcoin Stock-to-Flow (S2F) model and Bitcoin dominance (BTC.D) offer additional layers of insight. Beginners should view the Rainbow Chart as one piece of a broader strategy, using it to contextualize Bitcoin’s current price within multi-year cycles rather than as a sole decision-making tool.
How to Combine Bitcoin Rainbow Chart with Other Trading Tools
The Rainbow Chart is a powerful long-term trend tool, but it shines when used alongside other indicators and sentiment metrics. Here’s how you can combine it for a more practical trading approach:
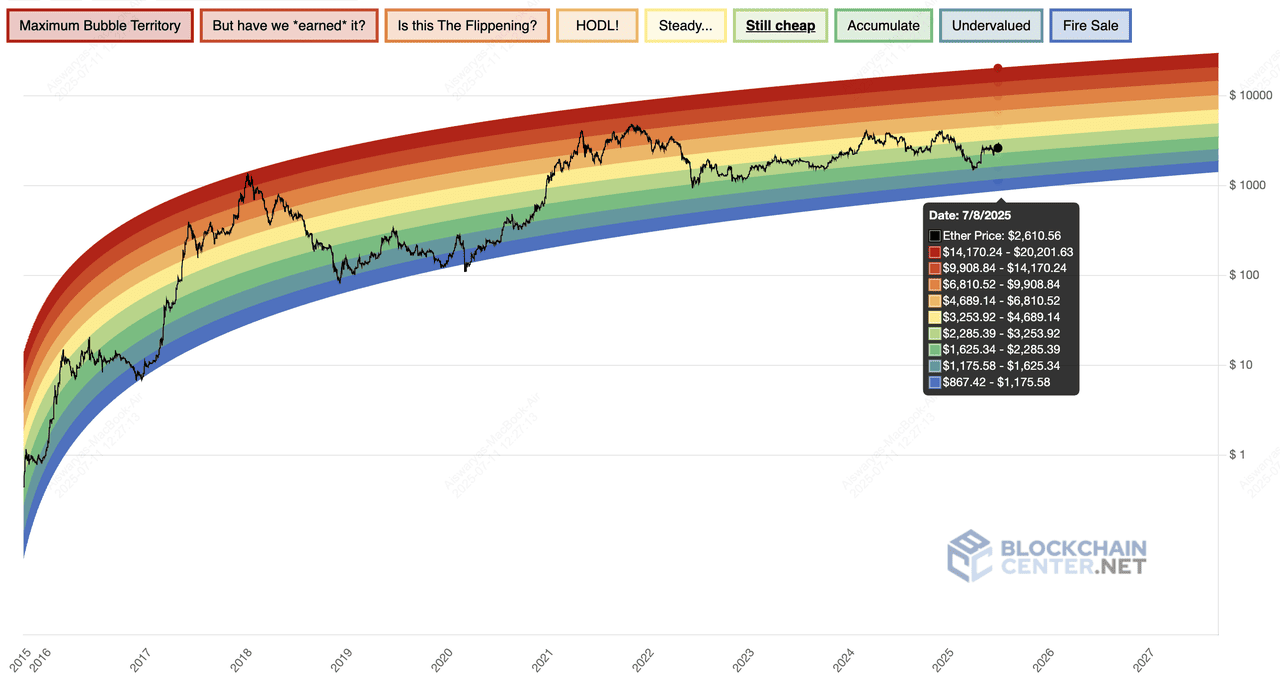
Ethereum rainbow chart | Source: BlockchainCenter
1. Ethereum Rainbow Chart: Apply the same concept to Ethereum’s price history. For example, if both BTC and ETH sit in their “Still Cheap” bands, it may suggest a broader market accumulation phase.
2. Pi Cycle Top Indicator: Use this to confirm potential market tops. If Bitcoin enters the “Maximum Bubble Territory” on the Rainbow Chart while the Pi Cycle Top Indicator flashes a sell signal, it strengthens the case for caution.
3. Crypto Fear & Greed Index: Check overall market sentiment. A high Fear & Greed score combined with BTC in the “FOMO Intensifies” band can warn of overextended conditions.

Crypto Fear and Greed Index | Source: Alternative.me
4. Volume Profiles and On-Chain Data: Monitor trading volumes and whale activity. For instance, if Bitcoin enters the “BUY!” band but on-chain data shows large holders accumulating, it could confirm a strong buy zone.
By layering these tools, beginners can get a clearer picture of price trends, market emotions, and potential reversal points. Instead of relying solely on color bands, this multi-tool approach helps you spot false signals and time your entries and exits with greater confidence.
Should You Use the Bitcoin Rainbow Chart for Crypto Trading?
The Bitcoin Rainbow Chart is a visually engaging tool for understanding Bitcoin’s historical price trends and market cycles. While it offers a helpful big-picture view, it has limitations. It does not account for new market dynamics such as ETFs, institutional adoption, or regulatory shifts, and it lacks short-term signals for active traders. Beginners may also misinterpret the color bands as exact price predictions rather than sentiment zones.
To use it effectively, combine it with other indicators like RSI, MACD, volume analysis, and macroeconomic data for a well-rounded trading strategy. Remember, no single chart can predict the future. Always approach the Rainbow Chart as part of a broader risk-managed plan, and stay updated on market developments to make informed decisions.
Related Reading
FAQs on Bitcoin Rainbow Chart
1. What is the Bitcoin Rainbow Chart used for?
To visualize Bitcoin’s historical price movements and identify undervaluation or overvaluation zones.
2. Who created the Bitcoin Rainbow Chart?
Originally created by Reddit user “azop” in 2014; refined into V2 by BlockchainCenter’s Rohmeo.
3. Is the Rainbow Chart reliable for trading?
It’s a long-term trend visualization tool, not a precise trading signal. Combine it with other indicators for better results.
4. What are the limitations of using the Bitcoin Rainbow Chart?
It relies on historical data and may not reflect new market dynamics or short-term trends. The color bands are subjective and should not be seen as precise price predictions.
5. Can the Rainbow Chart predict Bitcoin’s future price?
No, it reflects historical data trends and market sentiment, not future prices.
