
In early July 2026, real estate technology platform Opendoor Technologies Inc. (NASDAQ: OPEN) stands at a defining operational and existential crossroads. Long valued as a high-flying growth disrupter in the instant buying (iBuying) space, the global firm is aggressively executing an AI-driven pivot to transition from speculative home-flipping into a lean, capital-efficient digital transaction layer.
Following a choppy mid-summer close, Opendoor’s shares are currently trading at $4.90, navigating intense market consolidation as investors rotate out of speculative micro-caps into profitable mega-caps. While OPEN has staged a remarkable recovery from its all-time lows, it remains highly volatile, navigating a wide 52-week structural trading range between a historic floor of $0.51 and a peak of $10.87.
Investors are actively balancing accelerating unit economics against massive structural bottom-line losses. While the company posted a massive operational acceleration in acquisition volumes during its recent disclosures, macro housing signals have raised high-stakes debates between growth-oriented Wall Street analysts and risk-averse quantitative models.
This comprehensive guide dissects the OPEN stock forecast and price prediction for the remainder of 2026, combining proprietary AI marketplace initiatives with fresh consensus metrics from JPMorgan, Alliance Global Partners, Zacks Investment Research, and Simply Wall St.
You can trade OPEN stock perpetual futures on BingX TradFi using flexible USDT collateral.
Top 5 Things for Opendoor Traders to Know in 2026
As Opendoor scales its ecosystem under the operational guidance of CEO Kasra Nejatian and CFO Christy Schwartz, market participants must closely track these core structural drivers:
- The Opendoor 2.0 AI Shift: The company is engineering a profound structural overhaul. By migrating legacy pricing algorithms to a highly automated AI engine, Opendoor is shifting its focus away from predicting macro home price direction to accelerating velocity, prioritizing transaction volume over wide spreads.
- The Strategic India Exit: In June 2026, Opendoor completed a major corporate restructuring, shuttering its operational hubs in Hyderabad and Bengaluru and laying off all 250 Indian employees. Automated AI workflows have replaced fragmented legacy systems, allowing operations to be centralized under lean, customer-facing teams in the U.S.
- Aggressive Acquisition Rebound: Demonstrating renewed market traction, home purchases surged 45% sequentially in Q1 2026 to 2,474 homes. Furthermore, the company signed over 5,000 acquisition contracts, marking its strongest quarterly transaction volume since 2022.
- Inventory De-risking Milestone: Opendoor successfully mitigated its single largest historic headwind: stale inventory. The proportion of homes sitting on the market for over 120 days collapsed from a dangerous 51% down to just 10%, minimizing the risk of forced clearance discounts heading into seasonal H2 softness.
- The Russell 3000 Index Inclusion: In late May 2026, Opendoor was added to the Russell 3000 Index. This milestone significantly boosted institutional visibility and catalyzed a massive surge in liquidity, pushing daily trading volumes to 89.5 million shares, 112% above the historical average.
What Is Opendoor Technologies (OPEN)?
Founded in 2014, Opendoor Technologies pioneered the iBuying sector, creating an automated digital platform that allows consumers to buy and sell residential real estate online. The company provides homeowners with instant, competitive cash offers, allowing them to bypass traditional pain points like open houses, costly repairs, and prolonged closing uncertainties.
Today, Opendoor is moving past an era of heavy balance-sheet inventory to operate an automated real estate layer. Its ecosystem leverages artificial intelligence to streamline pricing structures, title insurance, and escrow services. By integrating these ancillary services, Opendoor aims to modernize the massive U.S. residential housing market, offering institutional liquidity to individual retail home sellers.
OPEN Stock Performance in 2026: Financial Health vs. Capital Constraints
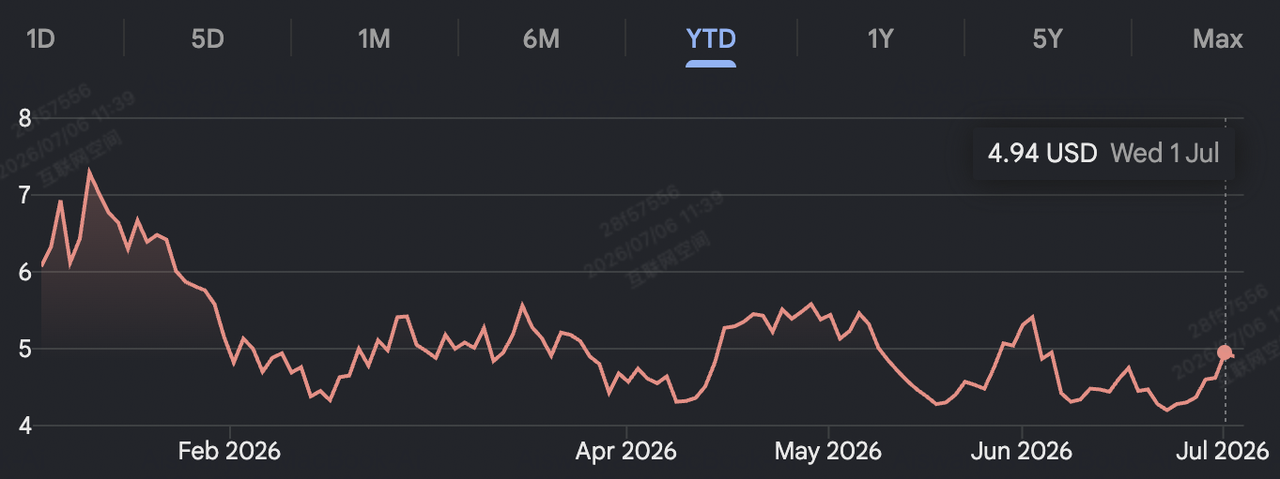
Opendoor stock performance YTD as of July 2026 | Source: Google Finance
Opendoor’s fiscal 2026 financial metrics highlight the complex task of scaling a capital-intensive iBuying network in a high interest rate landscape. During its Q1 2026 disclosure, the company demonstrated exceptional unit-level progress, beating consensus EPS expectations at -$0.05, even as its broader accounting metrics remained structurally constrained.
|
Financial Metric / Segment |
Q1 2025 Reported Data |
Q1 2026 Reported Value |
2026 Full-Year Target |
|
Total Revenue |
$1.153 Billion |
$720.00 Million |
25% Sequential Q2 Guide |
|
Gross Margin |
8.60% |
10.00% |
Underwriting Optimization |
|
Contribution Margin |
4.70% |
4.40% |
5.0% – 7.0% Q2 Forecast |
|
GAAP Net Loss |
($85.00 Million) |
($173.00 Million) |
Adjusted Net Income Breakeven |
|
Adjusted EBITDA |
($30.00 Million) |
($31.00 Million) |
12-Month Forward Breakeven |
|
Balance Sheet Debt |
$2.53 Billion |
$1.34 Billion |
Capital Structure De-leveraging |
The core driver behind Opendoor's structural turnaround is the optimization of its per-home transaction economics. Resale contribution margins have expanded systematically every month since September 2025, driven by tighter pricing execution. This unit efficiency is supported by an active insider buy from CEO Kasra Nejatian, who purchased 100,000 shares on the open market at $4.88, demonstrating strong alignment with shareholders.
However, quantitative balance sheet models reveal a stark margin paradox. While Opendoor trades at a highly discounted forward Price-to-Sales (P/S) multiple of 0.75x relative to the real estate services industry average of 3.55x, its debt posture remains severe. The company's $1.34 billion in total debt exceeds its $999 million cash reserves, leading to a net debt posture of $339 million. With a trailing twelve-month operating income of -$383 million, quantitative models warn that unless unit gains rapidly scale into structural accounting profits, the stock remains vulnerable to a sharp re-rating toward its asset liquidation floor.
Opendoor 2026 Trading Strategy: Managing Trend Lines and Technical Corridors
Successfully trading OPEN for the remainder of 2026 requires market participants to look past operational narratives and focus on clear horizontal and quantitative technical indicators:
The $4.80 Moving Average Pivot
Technical analysts are closely tracking the $4.80 50-day Daily Moving Average (DMA) support corridor, which converges with recent insider accumulation clusters. As long as OPEN maintains weekly closes above this $4.50 to $4.80 support zone, its intermediate recovery structure remains intact. A clean downside breach of this area would invalidate the short-term turnaround setup and expose the stock to its structural macro support near $3.50.
Navigating Overhead 200-Day Resistance
On any volume-supported momentum shifts, OPEN faces an aggressive technical sell-zone overhead. The price is currently fighting minor down-trends below its 200-day DMA of $5.99. A decisive daily breakout above the $6.00 psychological resistance, accompanied by a rising On-Balance Volume (OBV) indicator and an expansion in acquisitions, is required to trigger a short squeeze and shift the long-term trend back to structural momentum buyers.
Opendoor 2026 Stock Forecast: $8 Peak Target vs. $1 Bearish Floor

Opendoor stock price predictions for 2026 by Wall Street analysts
Wall Street firms and quantitative research groups are split on Opendoor's near-term valuation framework, dividing the 2026 forecast into three separate operational paths:
The Bull Case for OPEN Stock: $5.50 – $8.00 Peak on Volume Scaling
Led by aggressive Overweight targets from JPMorgan and Alliance Global Partners, the bullish thesis assumes that Opendoor successfully capitalizes on its AI-driven efficiency gains. In this scenario, the company hits its target of becoming adjusted EBITDA profitable on a 12-month forward basis starting in Q2, while scaling revenue by 25% sequentially. As mortgage rates stabilize in the low-6% range and active inventory grows, institutional buying volume accelerates, pushing the stock past its recent moving averages toward the peak price targets of $5.50 to $8.00.
Opendoor's Base Case: $4.33 – $5.00 Consensus Plateau
Supported by the broader Wall Street consensus, the base case projects a range-bound, modern consolidation channel. Under this model, Opendoor navigates H2 seasonal softness smoothly, protected by its low 10% aged inventory buffer. While structural fixed overhead costs and revenue contraction keep GAAP net profits negative, progress toward adjusted net income breakeven holds the stock stable within a realistic consensus target band of $4.33 to $5.00, aligning tightly with its current fair value estimation.
The Bear Case for OPEN Stock: $1.00 – $3.50 Structural Margin Compression
The highly bearish thesis, sustained by active Sell ratings and quantitative cash flow constraints, focuses on structural insolvency risks. If stabilizing mortgage rates fail to spur consumer buying activity, home turnaround velocity could stall out in late 2026. Under this framework, if prolonged holding costs compress transaction margins back to negative territory, credit agencies could downgrade Opendoor's debt. This capital restriction could prompt a rapid market exit, triggering a sharp correction toward the historical model-derived intrinsic value floor of $1.00 to $3.50.
Opendoor Technologies (OPEN) Price Predictions for 2026 by Wall Street Analysts
|
Covering Institution |
2026 Target (Avg/Peak) |
Core Analytical Outlook & Stance |
|
JPMorgan (Dae K Lee) |
$8.00 |
Bullish: Maintained Overweight; projects major structural transformation driven by an AI volume pivot and long-term $8B revenue capacity. |
|
Alliance Global Partners |
$5.50 |
Optimistic: Maintained Buy; highlights strong operational turnaround, improved unit margins, and healthy inventory turns. |
|
Wall Street Consensus Mean |
$4.58 |
Neutral / Hold: Formulated across active covering analysts; reflects a cautious "wait-and-see" stance balanced against macro risks. |
|
Citigroup Research |
$4.00 |
Cautious: Maintained Neutral/Sell; flags near-term top-line revenue contractions and enduring GAAP net losses. |
|
Wall Street Low Target |
$1.00 |
Bearish: Algorithmic down-rate projection; highlights extreme sensitivity to housing downturns and structural debt exposure. |
How to Trade Opendoor Technologies (OPEN) Stock Futures on BingX TradFi
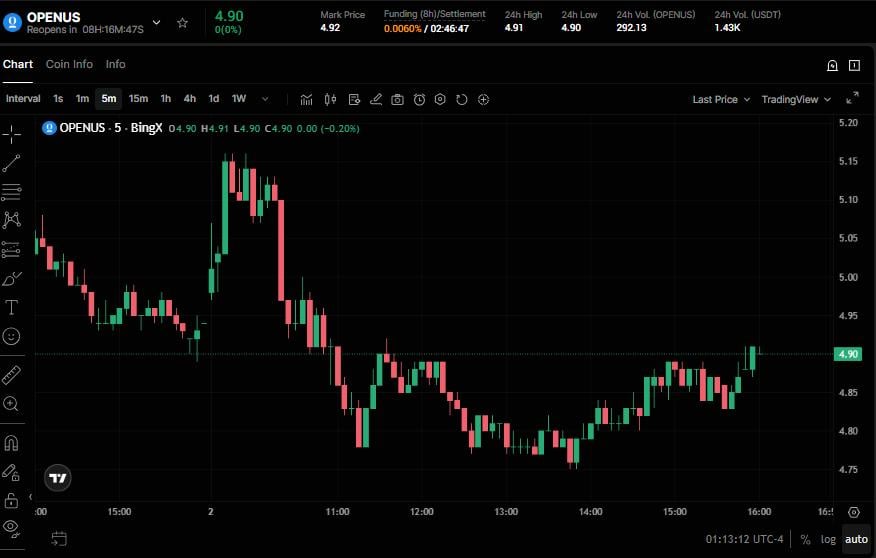
OPENUS/USDT perpetual contract on BingX TradFi market
Using the advanced, secure BingX TradFi system architecture, market participants can seamlessly capitalize on Opendoor's high volatility and technical trend lines:
- Access the BingX TradFi Portal: Log into your verified BingX account and navigate directly to the TradFi section on the primary exchange terminal.
- Locate the Asset: Type OPEN into the asset search bar to locate the OPENUS-USDT perpetual contract interface.
- Configure Leverage and Margin Protocols: Select your preferred account risk management settings: Isolated Margin to strictly confine risk parameters to an individual trade, or Cross-Margin to utilize your broader collateral pool. Set a disciplined leverage multiplier matched for high-beta mid-cap equities.
- Establish Position Direction: Select Open Long if you expect the combination of the AI reset, structural India cost cuts, and accelerating home purchases to drive the equity toward Wall Street's $8.00 bullish price targets; select Open Short if you expect widening net losses and high net debt exposure to break the asset down toward its $3.50 or lower bearish floor.
- Deploy Advanced Risk Parameters: Input your precise entry target, allocate your desired position sizing, and immediately execute mandatory Take-Profit / Stop-Loss (TP/SL) orders to insulate your trading portfolio from unexpected macro market adjustments.
Top 5 Risks to Consider Before Trading Opendoor Stock
Before committing active trading capital to Opendoor positions, market participants must carefully evaluate these fundamental risk factors:
- Enduring GAAP Net Losses: Despite achieving an optimized 10% gross margin on individual transactions, the firm's total quarterly loss widened to $173 million, demonstrating high fixed structural overhead.
- Severe Net Debt Leverage: Operating with $1.34 billion in debt against a negative EBITDA profile creates extreme sensitivity to credit re-ratings, which could increase incremental borrowing costs.
- H2 Real Estate Seasonality: Historically, real estate transaction velocity tapers significantly in the fall and winter months, typically threatening holding times and compressing margins in the fourth quarter.
- Intense Industrial Competition: Digital real estate peers like Zillow Group (ZG) and Compass (COMP) operate capital-light models with lower direct balance sheet inventory exposure, frequently drawing institutional capital away from asset-heavy models.
- Macro Housing Impasse: Even if mortgage rates sit near 6.3%, structural affordability pressures could limit the aggregate number of home buyers, capping Opendoor's growth potential.
Final Thoughts: Is Opendoor (OPEN) Stock a Buy in 2026?
Opendoor Technologies represents one of the most polarizing, high-beta turnaround plays operating within the global PropTech landscape. By successfully optimizing its unit economics through an AI-native shift, purging aged inventory, and aggressively cutting offshore costs, the company has proven that its underlying transactional engine can become highly efficient.
However, trading an unprofitable mid-cap equity that operates with a levered balance sheet demands a systematic approach. For active derivatives traders, Opendoor’s massive liquidity, heavy short interest (16.0%), and clear sensitivity to macro interest rate cuts create an excellent environment for high-velocity technical volatility capture and momentum trading. Conversely, spot market investors must approach entries defensively, ensuring that the company successfully translates its unit-level margin gains into positive adjusted net income before over-leveraging long-term capital.
Risk Reminder: Mid-cap technology equities undergoing structural operational turnarounds carry elevated execution risks. Always implement strict position sizing, utilize automated stop-loss protocols, and perform independent due diligence.
Related Reading
- Walmart Forecast 2026: $155 Bullish E-Commerce Acceleration or $81 Bearish Valuation Reality Check?
- Nike (NKE) Price Prediction 2026: $55.00 Turnaround Comeback or $39.00 Value Trap?
- Apple (AAPL) Stock Outlook for 2026: MacBook Neo Growth or AI Valuation Trap?
- Amazon (AMZN) Stock Price Prediction 2026: Can AWS AI Re-acceleration Offset a $200B CapEx Gamble?
- AMC Stock Price Prediction 2026: Fundamental Turnaround or Massive Dilution Trap?
