

In 2025, silver delivered one of the most explosive rallies in modern commodity history, surging more than 140% and decisively breaking above multi-decade resistance. By early 2026, silver had entered triple-digit territory, triggering a global debate: is silver just getting started, or nearing a cyclical peak?
Silver enters 2026 in a fundamentally different position than at any point over the past decade. Structural supply deficits, accelerating industrial demand from solar, EVs, and AI infrastructure, and a shifting macro regime have transformed silver from a lagging precious metal into one of the most volatile and asymmetric assets in global markets.
This guide breaks down silver’s 2026 price prediction using data from major banks, technical market structure, physical supply dynamics, and macro scenarios. You’ll also learn how to gain exposure to silver on BingX, both through tokenized spot silver and crypto-settled silver futures, without relying on traditional commodity brokers.
Key Highlights
• Silver surged over 140% in 2025, vastly outperforming gold and most global commodities
• Major banks see $56–65/oz averages in 2026, while bullish scenarios extend to $135–309/oz
• Structural supply deficits are expected for a sixth consecutive year, with mine supply lagging demand
• Silver remains highly volatile, and 30–50% corrections are historically common even in strong bull markets
• Investors can trade silver on BingX via tokenized spot silver or crypto-settled silver futures, with flexible risk management tools powered by BingX AI
What Is Silver (XAG)?
Silver is a hybrid asset that sits at the intersection of monetary hedging and industrial production, making it structurally more volatile, and potentially more asymmetric, than gold. Unlike gold, where over 85–90% of annual demand comes from investment, jewellery, and central-bank holdings, silver demand is split more evenly between industrial use at 55–60% and investment, jewellery, and silverware at 40–45%, according to data from the Silver Institute.
On the industrial side, silver is a non-substitutable input in several fast-growing sectors. Solar photovoltaics alone now consume 200+ million ounces per year, roughly one-fifth of global mine supply, while demand from EVs, power grids, semiconductors, and AI data centers continues to rise. Crucially, silver supply has failed to keep pace: the market is entering its sixth consecutive year of structural deficit, with annual shortfalls estimated between 100–120 million ounces.
This dual role explains silver’s distinctive price behavior. In early risk-off phases, silver often underperforms gold because its industrial exposure weighs on sentiment. But once monetary easing, investor inflows, and physical tightness become visible, silver historically outperforms gold on a percentage basis, especially in the late stages of precious-metal bull markets. In 2025, for example, gold gained about 64%, while silver surged more than 140%, one of the largest relative gaps on record.
Silver’s importance in 2026 is amplified by three forces converging simultaneously:
• Monetary easing and declining real yields: Lower rates reduce the opportunity cost of holding non-yielding assets, historically a strong tailwind for silver during late-cycle easing phases.
• Structural industrial demand growth: Electrification, renewable energy, and AI infrastructure are driving multi-year demand growth that is largely insensitive to short-term price swings.
• Inelastic supply constraints: Roughly 75% of silver production is mined as a by-product of copper, lead, and zinc, meaning higher silver prices do not quickly translate into higher output.
Together, these factors suggest silver is no longer trading solely as a cyclical industrial metal or a secondary precious metal. Instead, it has entered a new valuation regime, where macro policy, physical scarcity, and industrial necessity interact to create higher volatility, but also potentially higher long-term price floors, heading into 2026.
Silver’s Historical Performance Across Market Cycles: From $2 to $112+
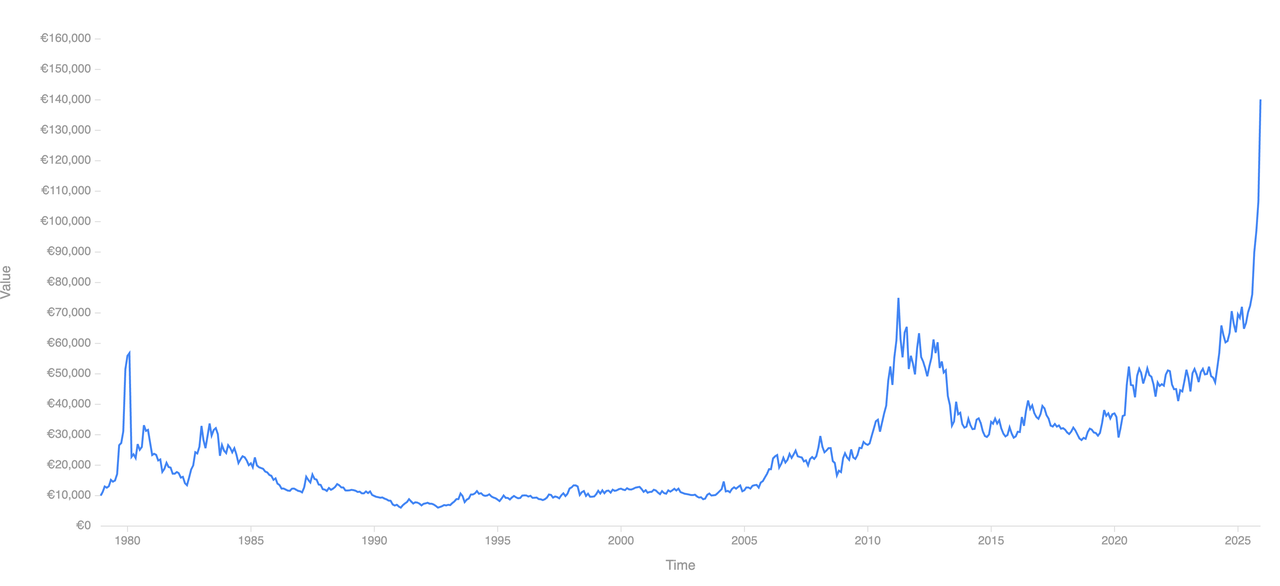
Silver historical performance | Source: Curvo
Silver’s price history is defined by high-amplitude boom-bust cycles, with moves that are typically larger and faster than gold’s due to silver’s smaller market size, dual industrial-monetary role, and supply inelasticity. Since the breakdown of the Bretton Woods system, silver has delivered some of the most extreme percentage swings among major commodities.
1. 1970s Inflation Cycle: After the U.S. abandoned the gold standard in 1971, silver traded below $2/oz. As inflation surged into double digits, real yields turned deeply negative, and confidence in fiat currencies eroded, silver prices exploded, rising to nearly $50/oz by January 1980, a gain of over 2,300% in less than a decade. This rally culminated during the peak of monetary instability and speculative demand, before collapsing as policy tightened.
2. 1980–2000 Disinflation Era: The Volcker-led tightening cycle reversed silver’s fortunes. Real interest rates moved sharply higher, the U.S. dollar strengthened, and inflation expectations collapsed. Silver fell more than 80% from its 1980 peak and spent nearly two decades range-bound, largely trading between $3 and $6/oz, reflecting a prolonged period of monetary stability and weak investment demand.
3. 2008–2011 Crisis Rally: Silver reasserted its leverage to monetary stress during the 2008 financial crisis. Prices rebounded from around $9/oz in late 2008 to an intraday high near $49/oz in April 2011, a gain of roughly 440%. This move was driven by zero interest rates, quantitative easing, and a surge in retail investment demand. However, once policy normalized and ETF inflows reversed, silver corrected more than 60%, highlighting its sensitivity to shifts in liquidity and sentiment.
4. 2020 Pandemic Shock: During the COVID-19 shock, silver rallied from the $12–$15/oz range to above $29/oz as central banks unleashed unprecedented stimulus. Unlike gold, which made sustained new highs, silver spent the following years consolidating below its 2011 peak, constrained by uneven industrial recovery and fluctuating investor demand.
5. 2024–2025 Structural Breakout: The 2024–2025 period marked a decisive regime shift. Silver broke above the $50–$55/oz resistance zone that had capped prices for more than 13 years, triggering a rapid acceleration into price-discovery territory. In 2025 alone, silver surged over 140%, significantly outperforming gold’s 64% gain, as structural supply deficits, record ETF inflows, and accelerating industrial demand converged for the first time in decades.
Key takeaway: Silver rarely trends smoothly. Historically, it lags gold in the early phase of macro stress, but once monetary easing, investment flows, and physical tightness align, silver tends to outperform gold violently on a percentage basis, often late in the precious-metal cycle. This pattern helps explain both silver’s explosive upside potential, and its equally sharp drawdowns, heading into 2026.
Why Silver Exploded Over 140% in 2025: Four Structural Drivers
Silver’s 140%+ surge in 2025 was not the result of a single speculative catalyst. It reflected a rare alignment of physical, monetary, and positioning forces, many of which had been building for years but only converged decisively last year.
1. Industrial Demand Shock as Solar Industry Drives 20-25% Silver Demand
Silver’s industrial demand reached record levels in 2025, driven primarily by electrification and data-intensive technologies.
• Solar photovoltaics now consume over 200 million ounces per year, accounting for roughly 20–25% of global annual silver supply, according to industry estimates.
• Electric vehicles, power grid upgrades, semiconductors, and high-efficiency electronics added another 150–200 million ounces of structurally rising demand.
• AI data centers significantly increased silver usage in high-conductivity connectors, power distribution systems, and cooling infrastructure, applications where silver has no economically viable substitute.
Crucially, this demand is non-cyclical. Unlike jewelry, it is tied to long-term capital expenditure and policy-driven energy transitions, making it less sensitive to short-term price fluctuations.
2. Persistent Supply Deficits for Sixth Straight Year and Inelastic Mine Output
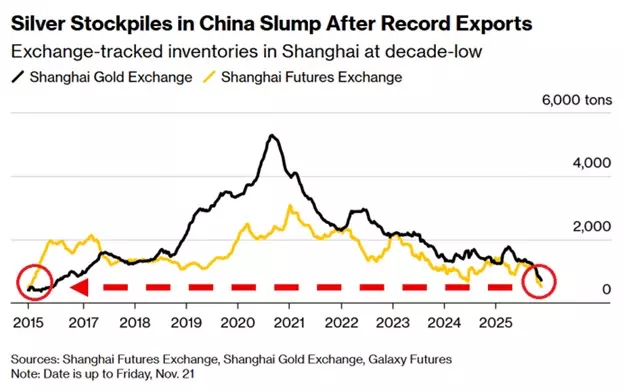
Silver stockpiles in China | Source: IG.com
The silver market entered its sixth consecutive year of structural deficit in 2025, with demand consistently exceeding mine supply and recycling.
• Annual supply deficits are estimated near 100–120 million ounces, drawing down above-ground inventories.
• Approximately 75% of silver is produced as a by-product of copper, lead, and zinc mining, meaning output decisions are driven by base-metal economics rather than silver prices.
• New primary silver projects typically require 5–7 years to reach production, limiting near-term supply response even at higher prices.
This supply inelasticity means that price becomes the only balancing mechanism when demand accelerates, amplifying upside moves during tight market conditions.
3. Monetary Tailwinds and Falling Opportunity Cost
Monetary conditions turned decisively supportive in 2025.
• US real yields declined meaningfully in the second half of the year as inflation cooled faster than nominal rates.
• Markets priced in multiple rate cuts across the US and major developed economies, reducing the opportunity cost of holding non-yielding assets like silver.
• Historically, silver has delivered its strongest relative performance late in easing cycles, once liquidity improves and investors move further out the risk curve.
This environment boosted both investment demand and speculative positioning, particularly through ETFs and futures, reinforcing the rally.
4. Gold-Silver Ratio Compression to 60:1 Triggered Catch-Up Flows
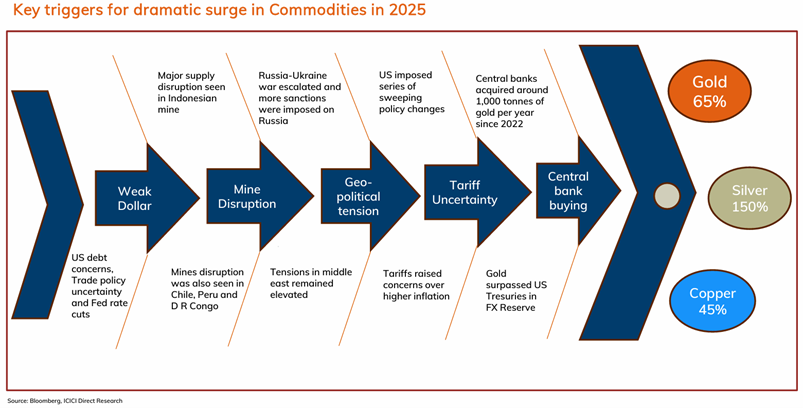
Key drivers behind the surge in commodities in 2025 | Source: ICICI Direct
One of the most powerful accelerants in 2025 was the rapid compression of the gold-silver ratio.
• The ratio collapsed from above 100:1 early in the cycle to near 60:1 by late 2025.
• Historically, silver tends to outperform aggressively once the ratio breaks below long-term resistance, as relative-value and momentum strategies rotate from gold into silver.
• Previous secular silver bull markets have seen the ratio compress toward 40 or even the low-30s, implying substantial further upside for silver if the trend continues.
For investors, this ratio dynamic mattered because it signaled that silver was no longer lagging gold—but entering its high-beta outperformance phase.
Bottom line: Silver’s 2025 rally was structurally driven. Industrial scarcity, inflexible supply, monetary easing, and relative-value positioning aligned at the same time, creating the conditions for one of the strongest silver advances in modern market history, and setting the stage for elevated volatility heading into 2026.
Silver Price Forecasts for 2026: How High or Low Can XAG Go?
After one of the strongest annual rallies in modern history, silver’s 2026 outlook is best approached through scenario analysis rather than a single headline target. Forecast dispersion is wide because silver sits at the intersection of monetary policy, industrial scarcity, and investor positioning—three variables that can shift quickly.
1. Base Case: Consolidation With Structural Support
Expected range: $56–$75 per ounce
In the base-case scenario, silver spends most of 2026 consolidating its explosive 2025 gains through sharp, two-sided volatility rather than trending decisively higher. Major banks including BMO, TD Securities, and ICICI Direct expect silver to remain range-bound but elevated, as physical fundamentals continue to provide a strong floor. The global silver market is projected to remain in deficit for a sixth consecutive year, with estimated shortfalls of 100–120 million ounces, limiting sustained downside even during pullbacks.
At the same time, investment demand stabilizes rather than accelerates. Global silver ETF holdings flatten but do not unwind aggressively, keeping prices anchored above former resistance near $50. Monetary conditions turn incrementally supportive as rate cuts arrive gradually, containing real yields without triggering a full risk-off cycle. Historically, this pattern, 20–30% corrections, higher lows, and prolonged volatility, is typical after silver enters price-discovery territory, reflecting digestion rather than exhaustion.
2. Bull Case: Late-Cycle Acceleration
Expected range: $100–$135+ per ounce
Tail-risk scenarios: $200–$300+
The bullish scenario assumes silver enters the late-cycle acceleration phase common to precious-metal bull markets, where relative valuation and capital flows dominate fundamentals. Bank of America expects gold to approach $6,000/oz in 2026, and if gold holds near those levels, silver’s upside becomes increasingly driven by gold–silver ratio compression rather than standalone demand. With the ratio currently near 59, a move toward historical bull-market lows around 40, as seen in 2011, mathematically implies silver prices in the $130–$140 range, even without new gold highs.
Renewed ETF inflows and retail participation amplify this move. BofA’s Michael Widmer estimates that relatively modest increases in investment demand, on the order of 10–15%, could have outsized price effects due to silver’s much smaller and less liquid market compared to gold. In extreme tail-risk environments, marked by currency confidence erosion, aggressive monetary easing, or financial instability, silver has historically overshot fundamentals. Under such conditions, $200–$300+ becomes mathematically plausible, though highly volatile and structurally unstable.
3. Bear Case: Mean Reversion Without Structural Breakdown
Expected range: $50–$70 per ounce
The bearish scenario reflects a macro relief trade rather than a breakdown of silver’s long-term thesis. A stronger US dollar, delayed rate cuts, or improving growth expectations push real yields higher, reducing speculative demand and pressuring prices. After gaining more than 140% in 2025, silver undergoes a 30–50% correction, consistent with historical pullbacks seen during prior bull markets, including 2010–2011.
At the same time, elevated prices encourage short-term industrial thrifting, particularly in photovoltaics, electronics, and manufacturing, softening demand at the margin. However, even in this scenario, silver remains structurally supported by persistent supply deficits and limited mine-supply elasticity. Importantly, a correction into the $50–$70 range would still leave silver well above its pre-2024 trading range, preserving the longer-term breakout structure rather than invalidating it.
Is Silver Overbought, or Still Underowned?
Despite triple-digit prices, silver does not appear broadly overowned when measured by portfolio allocation rather than price momentum. Institutional investors still allocate well below 1% of assets to silver, compared with 2–3%+ typically held in gold during late-cycle precious-metal rallies, leaving positioning historically light. While retail participation surged in 2025, flows have been concentrated in futures and short-term ETFs, amplifying volatility without exhausting long-term demand.
At the same time, silver’s total market value remains a small fraction of gold’s, meaning even modest reallocations, such as a 0.2–0.3% shift from institutional portfolios, can move prices disproportionately. This positioning imbalance explains why silver enters 2026 with high volatility but firm structural support: sharp pullbacks are likely, but sustained breakdowns are harder to justify as long as supply deficits persist and monetary conditions remain accommodative.
How to Trade Silver Spot and Futures on BingX
BingX allows traders and investors to access silver through a crypto-native, flexible framework, without traditional commodity accounts. BingX AI provides real-time volatility tracking, trend signals, and risk indicators to help traders navigate silver’s fast-moving market.
1. Buy, Sell, or HODL Tokenized Silver ETF via SLVon on the BingX Spot Market
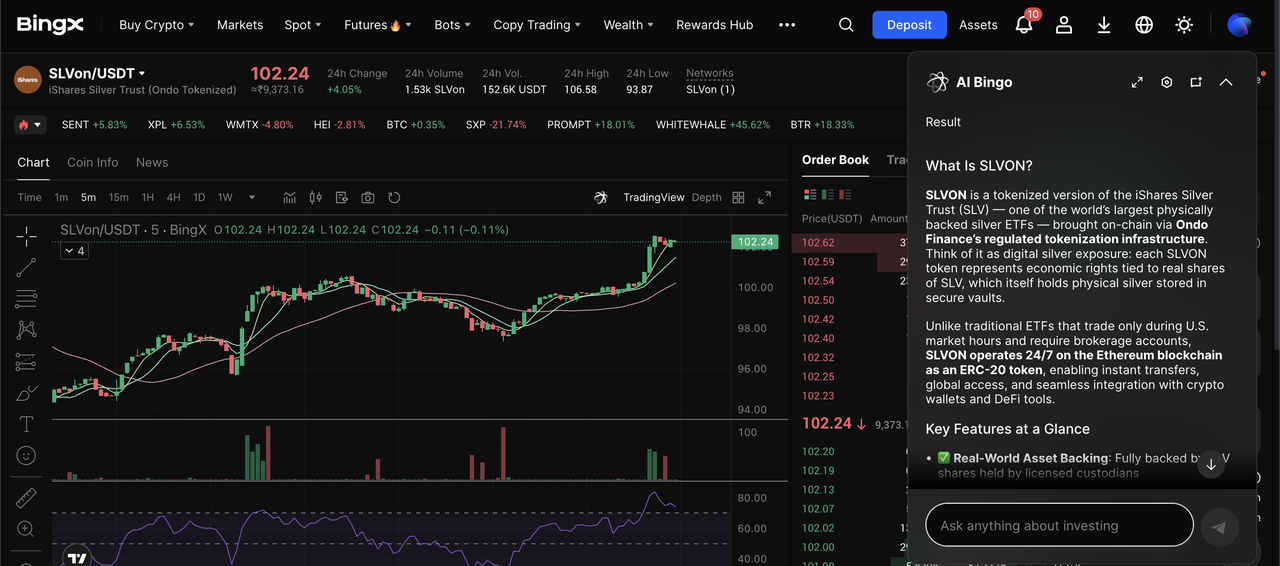
SLVon/USDT trading pair on the spot market powered by BingX AI insights
Trading SLVON, a tokenized silver ETF on BingX, provides a straightforward way to gain direct, unleveraged exposure to silver prices without dealing with physical bullion or traditional commodity brokers. SLVON is Ondo Finance’s on-chain representation of the iShares Silver Trust, designed to track the ETF’s net asset value by providing blockchain-based economic exposure to physical silver held by regulated custodians.
1. Log in to your BingX account and open the Spot trading section.
2. Search for SLVON/ USDT, the tokenized version of the silver ETF.
3. Place a buy order using USDT to track silver price movements on a 1:1 basis.
4. Hold the position as a medium-term allocation or rebalance alongside other crypto assets as market conditions evolve.
2. Trade Leveraged Silver Futures With Crypto on BingX
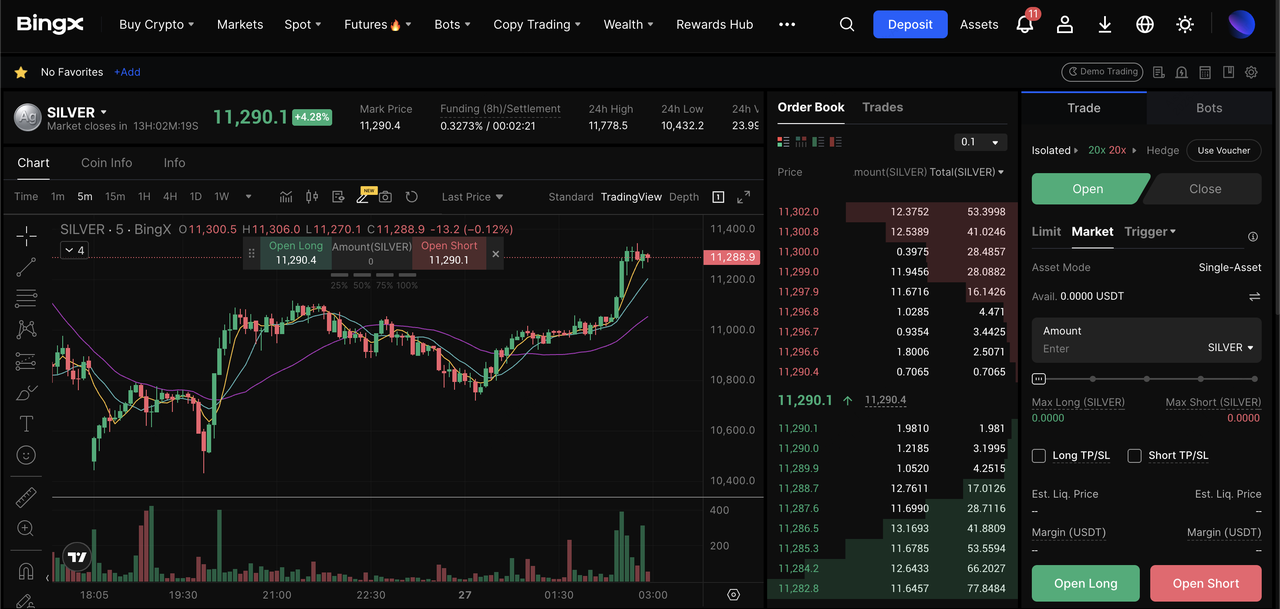
SILVER/USDT perpetual contract on the futures market
Silver futures on BingX TradFi allow active traders to go long or short and trade silver’s volatility using crypto-settled contracts.
1. Go to the Futures trading section on BingX.
2. Select a silver perpetual contract settled in crypto.
3. Choose your direction: go long if you expect prices to rise, or go short if you expect a pullback.
4. Set low leverage of 2x–5x to manage silver’s volatility.
5. Add stop-loss and take-profit orders before confirming the trade to control risk.
4 Key Risks to Watch When Trading Silver 2026
Silver’s upside potential in 2026 comes with unusually high risk, and understanding where drawdowns can originate is essential before sizing any position.
1. Extreme volatility risk: Historically, silver bull markets include frequent 30–50% drawdowns. During the 2011 rally, prices fell more than 60% within two years, and even in strong cycles, 20–30% corrections often occur in weeks rather than months.
2. Monetary policy surprises: Silver is highly sensitive to real yields and the US dollar. A delayed Fed easing cycle, renewed inflation forcing higher rates, or dollar strength could compress prices sharply, even if long-term fundamentals remain intact.
3. Industrial demand elasticity: At prices above $80–$100/oz, manufacturers may accelerate thrifting, substitution, or efficiency gains, particularly in solar and electronics, slowing demand growth at the margin.
4. Speculative positioning risk: A large share of recent silver inflows has come via futures and short-term vehicles, which can reverse quickly. When momentum-driven positioning unwinds, volatility tends to amplify rather than smooth price action.
Should You Invest in Silver in 2026?
Silver in 2026 is unlikely to repeat the straight-line gains of 2025, but its structural bull case remains intact. Persistent supply deficits, rising industrial demand, and late-cycle monetary dynamics support higher long-term prices, even as volatility increases.
For investors, silver works best as a strategic, risk-managed allocation, not a one-way leveraged bet. With BingX offering both tokenized spot exposure and crypto-settled futures, traders can participate in silver’s upside while maintaining flexibility across market scenarios.
As always, position sizing, patience, and disciplined risk management matter more in silver than almost any other major asset.
