


In late 2025 and early 2026, copper, often called "Dr. Copper" for its role as an economic barometer, transitioned from a cyclical industrial metal into a high-volatility strategic asset. By January 6, 2026, copper prices on the London Metal Exchange (LME) reached a historic high of $13,387 per metric tonne, leaving analysts debating whether the rally is in its "late stages" or entering a new structural valuation regime.
Copper enters 2026 facing a massive identity shift. It is no longer just about construction and plumbing; it is the physical backbone of Artificial Intelligence (AI) and the global energy transition. With US trade policy uncertainty and supply deficits looming, 2026 is set to be a year of high-stakes volatility for the red metal.
This guide breaks down the copper price prediction for 2026 using institutional data from Goldman Sachs and J.P. Morgan, technical structures, and supply-demand imbalances. You will also discover how to gain copper exposure on BingX TradFi through crypto-settled futures.
Key Highlights
• Copper hit an all-time high of $13,387/mt in January 2026, gaining over 40% in just 12 months.
• AI is the new driver for copper prices as data center demand is projected to require 475 kmt of copper in 2026, a significant jump from previous years.
• J.P. Morgan forecasts a refined copper supply deficit of 330 kmt for 2026 due to disruptions at the Grasberg mine and aging infrastructure.
• A mid-year US commerce recommendation on refined copper tariffs could act as a catalyst for a price correction toward $11,000/mt.
• Access the copper market via crypto-margined copper perpetual futures on BingX TradFi.
What Is Copper (XCU)?
Copper is a highly conductive, versatile metal essential for power generation, transmission, and electronic devices. In the context of 2026, it is classified as a Critical Mineral by both the US and EU due to its non-substitutable role in national security and green technology.
Unlike gold, which is primarily an investment asset, copper demand is almost entirely industrial. However, the rise of tokenized Real-World Assets (RWAs) has allowed retail traders to treat copper as a financial instrument.
Button Trade Copper Futures https://bingx.com/en/perpetual/Copper-USDT
The "Dr. Copper" Market Cycle: A 175-Year Economic Barometer
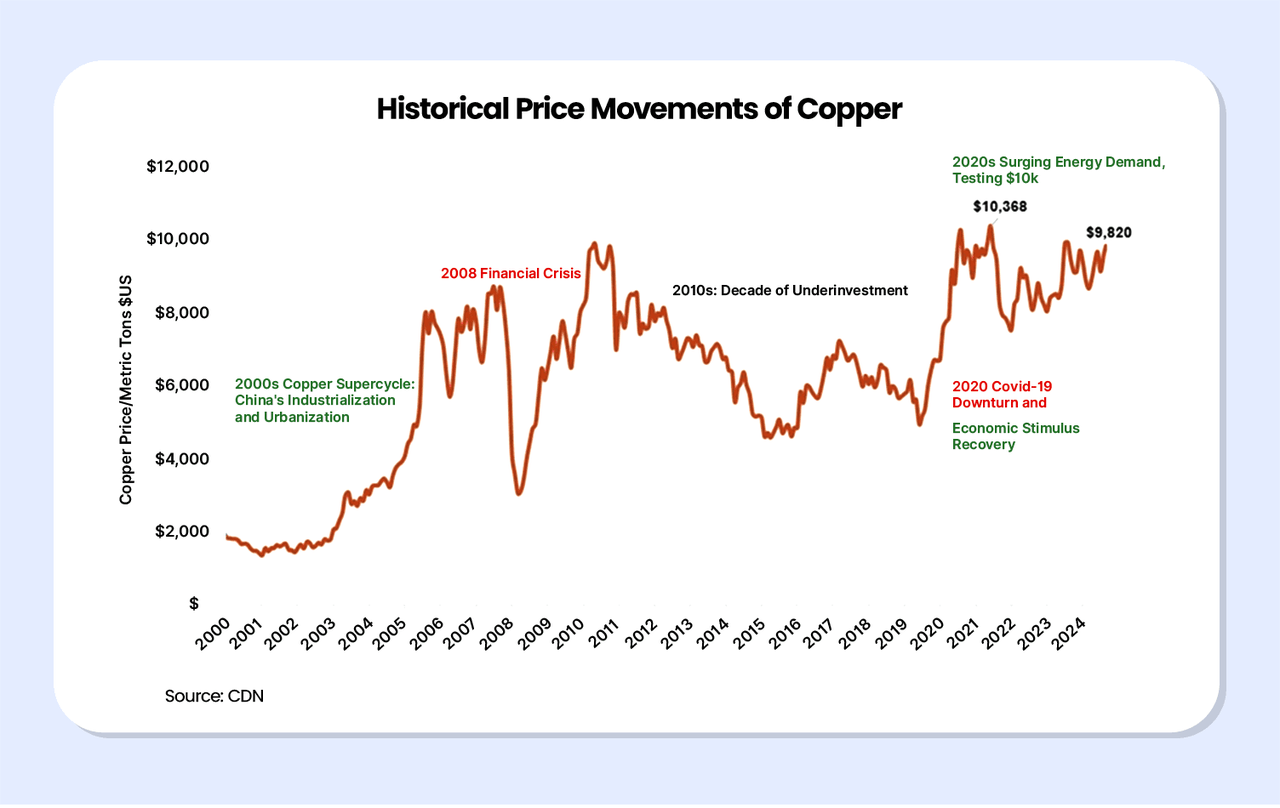
Historical price movements of copper | Source: Grip Invest
Copper is famously nicknamed "Dr. Copper" because it is often said to have a "PhD in Economics." Due to its widespread use across almost every sector, from residential plumbing to high-tech semiconductors, its price movements often predict the health of the global economy 3-6 months in advance.
• The Post-WWII Boom (1945–1970): Copper demand mirrored the global infrastructure rebuilding phase, establishing its role as a "bellwether" for industrial growth.
• The China Supercycle (2003–2011): Driven by China's rapid urbanization, copper prices surged from under $2,000/mt to over $10,000/mt in 2011, as the country’s share of global consumption more than doubled.
• The Modern "Green" Pivot (2020–2026): After a decade of range-bound trading, the pandemic stimulus and the urgent shift toward net-zero emissions triggered a new breakout. In January 2026, prices hit an all-time record of $13,387/mt, signaling that we have moved from a cyclical market to a structural supply-deficit era.
The "Copper Thesis" for 2026: 3 Key Drivers of the Copper Bull Market
The current bull market is unique because it is driven by three non-cyclical pillars:
1. EV Vehicles: The "Green Revolution" is copper-intensive. An average EV contains 80–100 kg of copper, roughly 4x more than a traditional internal combustion engine (ICE) vehicle.
2. AI and Digital Infrastructure: We are witnessing a "second electrification." Data centers, the hearts of the AI boom, require massive copper volumes for high-conductivity wiring and advanced cooling systems. 2026 demand from this sector alone is projected at 475 kmt.
3. Inelastic Supply and "The 20-Year Lag": While demand is exploding, supply is stagnant. It takes 20–30 years to discover, permit, and build a new copper mine. With major disruptions like the Grasberg mine force majeure in late 2025, the market simply cannot produce enough metal to meet current demand.
Copper’s Path to $13,000: Why Copper (XCU) Prices Exploded 40% in 2025
The 40% rally in 2025 was fueled by an unprecedented alignment of supply shocks and "New Economy" demand.
1. The Grasberg Force Majeure and Global Supply Tightness
In late 2025, a fatal mudslide at Indonesia’s Grasberg mine, the world's second-largest copper operation, forced an immediate halt to production. The Grasberg Block Cave, which accounts for roughly 70% of the mine's previously forecasted output, is expected to remain offline until at least Q2 2026. This single event removed approximately 300-400 kmt from the global supply chain, occurring at a time when other major projects, such as Chile’s Quebrada Blanca, were already facing operational downgrades. This acute scarcity left refined copper inventories at "tank-bottom" levels, making the market highly sensitive to price spikes.
2. The AI Infrastructure Surge and the Power Grid Bottleneck
While 2024 was dominated by talk of GPU shortages, 2025 revealed that copper is the physical bottleneck of the Artificial Intelligence revolution. AI-specific data centers require massive amounts of heavy-gauge copper cabling for high-density power distribution and sophisticated liquid-cooling systems. Demand from the compute sector is growing at a CAGR of nearly 10%, with projections suggesting data centers will consume 475 kmt of copper by the end of 2026. Because copper has no viable substitute for high-efficiency electrical conductivity in these settings, tech giants have been forced to compete directly with industrial manufacturers for dwindling supplies.
3. Defensive Front-Loading and the US Tariff Premium
Anticipation of aggressive US trade policy under the Trump administration created a "buy now or pay later" mentality among industrial consumers. With a proposed 15–25% tariff on refined copper imports looming for mid-2026, US traders engaged in massive defensive stockpiling. This "front-loading" of imports caused a historic dislocation between exchanges, driving the CME (Chicago) copper premium to a record $1.30/lb over the LME (London) price. This artificial surge in demand, intended to secure lower-cost inventory before tax hikes, effectively sucked global liquidity into US warehouses, further starving the rest of the world of available metal.
Copper Price Forecasts for 2026: Bull vs. Bear Outlook
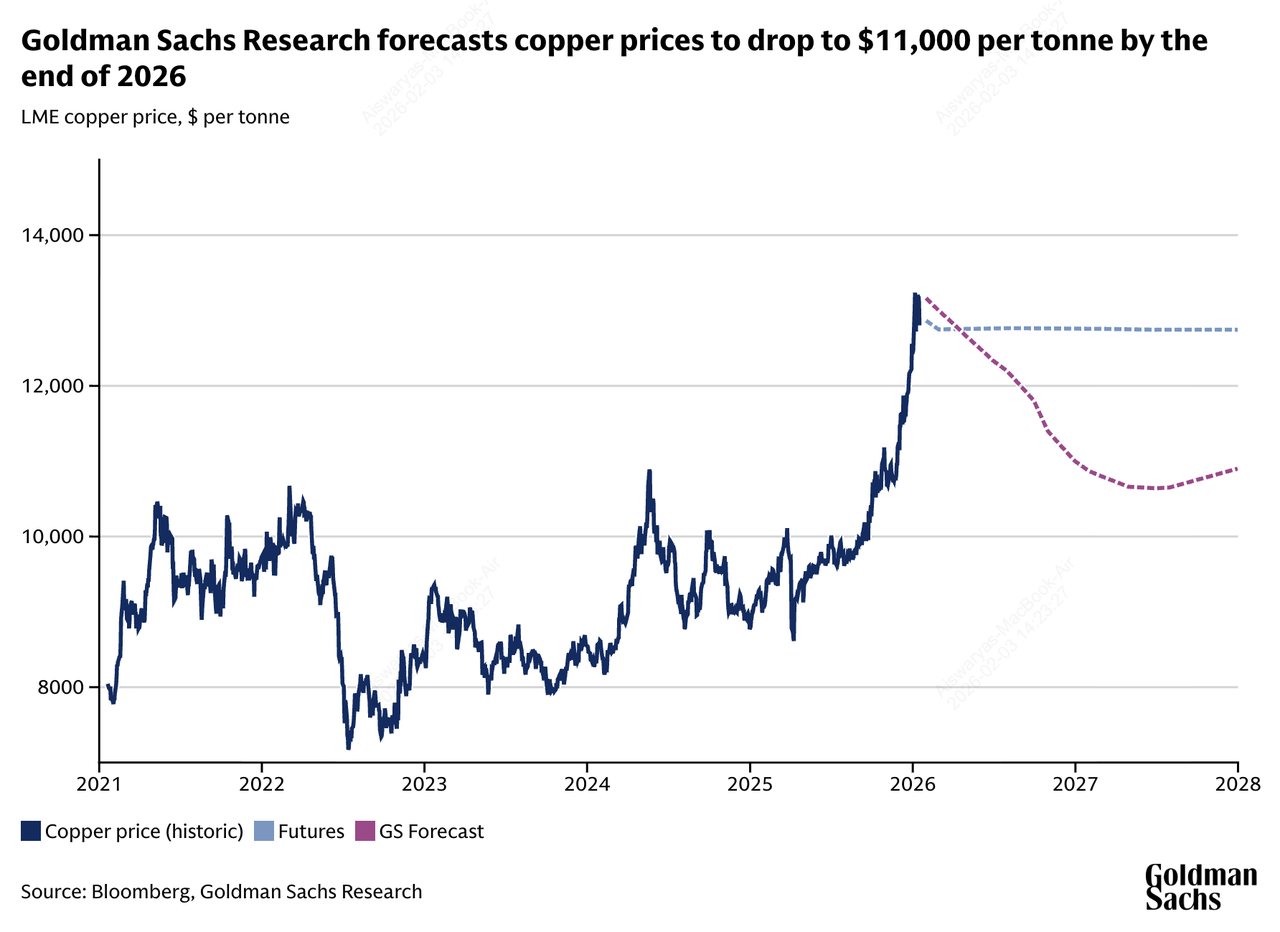
Copper price forecast by Goldman Sachs
Institutional views are sharply divided between a "structural squeeze" and a "policy-driven correction," reflecting high volatility in global manufacturing and energy transition speeds.
| Institution | 2026 Price Target | Market Outlook |
| Citigroup | $15,000/mt | Super-Bullish: Sees absolute scarcity and depleted inventories driving prices. |
| J.P. Morgan | $12,500/mt | Bullish: Expects a 330 kmt deficit to peak in Q2 2026. |
| Goldman Sachs | $11,000/mt | Bearish: Forecasts an 18% decline as tariff uncertainty clears and scrap supply rises. |
| World Bank | $9,800/mt | Conservative: Anticipates a mean-reversion as global growth slows. |
The Bull Case: The "Super-Squeeze" to $15,000
The bull narrative centers on a widening structural deficit that Citigroup and J.P. Morgan expect to reach a critical 330,000 metric tonne (kmt) shortfall by mid-2026. If the Grasberg mine expansion or major Chilean projects face further operational delays beyond Q2, global exchange inventories, which are currently hovering at a precarious 14 days of consumption, could hit "tank bottoms." This lack of physical liquidity would likely force manufacturers into a "panic-buying" cycle, potentially catapulting prices toward the $15,000/mt mark as copper becomes the primary bottleneck for the global AI data center and EV charging infrastructure rollout.
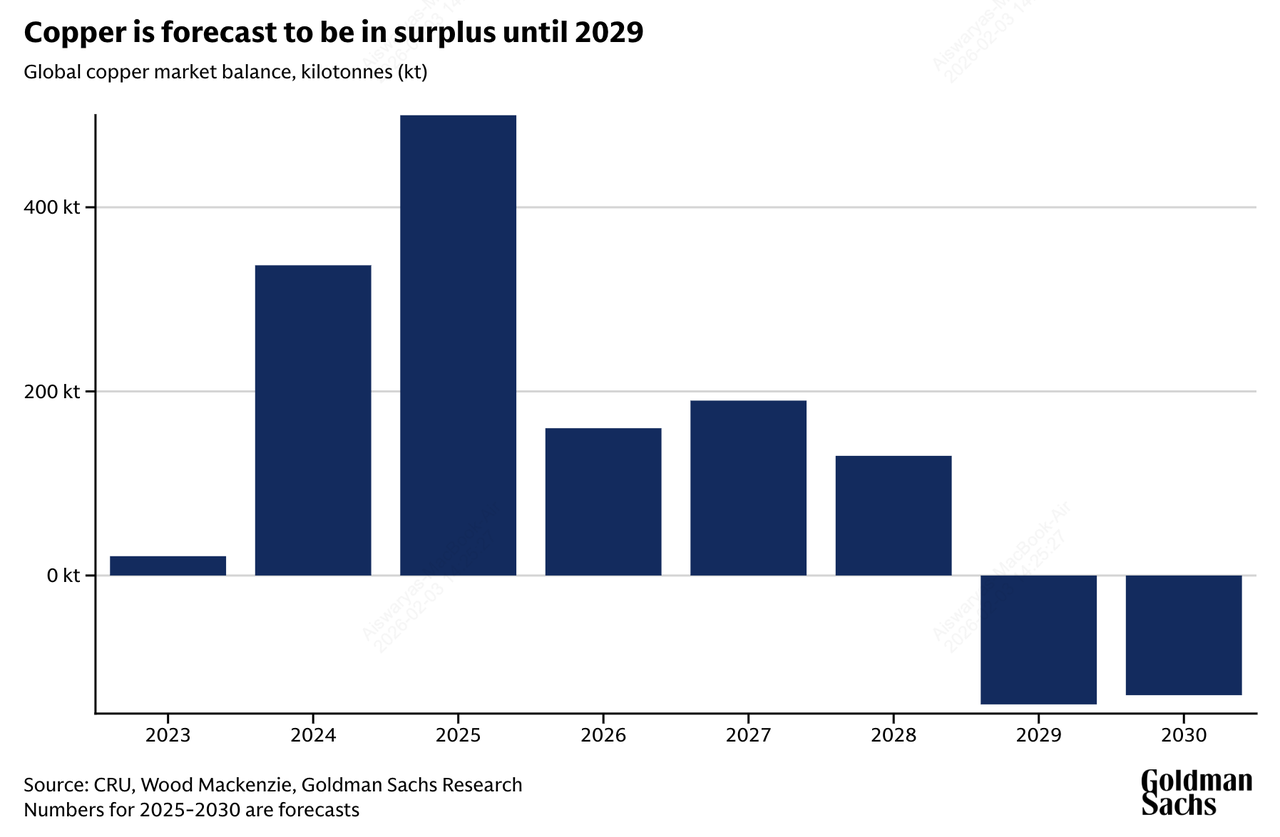
Copper supply surplus forecast by Goldman Sachs
The Bear Case: The "Tariff Correction" to $9,800
Conversely, Goldman Sachs and the World Bank warn of a price "overshoot" driven more by sentiment and defensive stockpiling than actual consumption. Under this scenario, the 18% correction to $11,000/mt is triggered as U.S. and EU tariff clarity emerges, removing the incentive for front-loading shipments. Furthermore, if global GDP growth stalls at the IMF’s projected 2.8%, a surge in high-voltage scrap recovery and a 250 kmt increase in secondary supply could flip the market into a surplus. This would lead to a rapid liquidation of speculative long positions on the LME, dragging prices back toward the long-term $9,800/mt mean-reversion level.
How to Trade Copper Futures with USDT on BingX TradFi
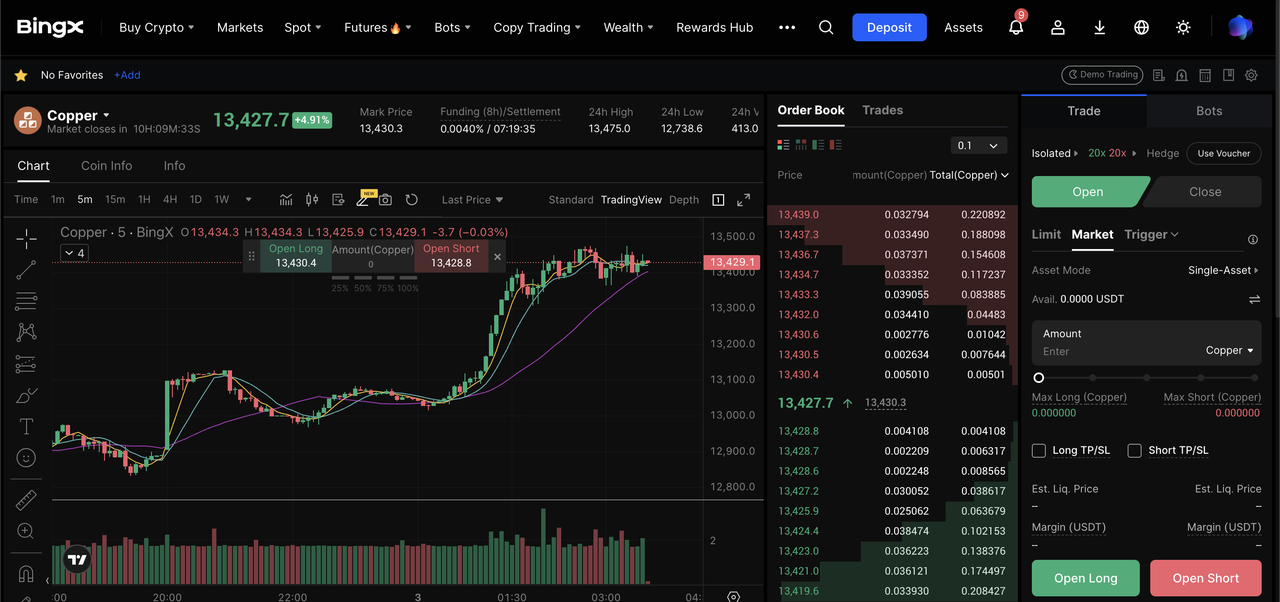
Copper perpetual contract with crypto on BingX futures market
With BingX TradFi reaching over $1 billion in 24-hour trading volume in January 2026, the platform offers deep liquidity and adjustable leverage for commodities. You can bypass bank wires and complex onboarding; simply use your USDT as margin to gain 24/7 price exposure to copper, ensuring your portfolio can pivot instantly between the "Super-Squeeze" and "Tariff Correction" scenarios.
For active traders looking to profit from copper's volatility, BingX TradFi offers perpetual futures.
1. Navigate to Futures Trading.
2. Select COPPER/USDT perpetual contract.
3. Choose your leverage (recommended 2x–5x due to high volatility).
4. Remember to set Stop-Loss and Take-Profit levels based on real-time support/resistance.
4 Key Risks to Watch When Trading Copper in 2026
While the potential for high returns is significant, navigating the 2026 copper market requires a sharp focus on specific macroeconomic and industrial triggers that could disrupt the current price trajectory.
1. Substitution: At $13,000+, manufacturers are aggressively switching to aluminum, which is currently trading at a 4.5:1 ratio to copper.
2. US Policy: A delay in tariff implementation until 2027 would be bearish for prices in the short term.
3. China Growth: As the consumer of 50% of the world's copper, any slowdown in Chinese EV manufacturing would immediately pressure XCU.
4. Scrap Supply: High prices have incentivized a surge in "urban mining" or recycling, which could add up to 100 kmt of unexpected supply.
Conclusion: Is Copper Worth Investing in 2026?
Determining whether copper is a "buy" in 2026 depends largely on an investor's time horizon and tolerance for policy-driven volatility. In the immediate term, the market is characterized by a "tale of two halves": a front-half potentially dominated by physical scarcity and record-breaking highs as the structural deficit peaks, followed by a second-half risk of a macro correction. Long-term participants may find copper a compelling core holding due to the "electrification of everything," but shorter-term traders must remain agile as the market oscillates within the projected $11,000–$13,000 range.
As the year progresses, the transition from speculative fervor to fundamental price discovery will be heavily influenced by shifts in U.S. trade policy and Chinese industrial output. While the move toward renewable energy and AI infrastructure provides a robust demand floor, the emergence of secondary scrap supply and industrial substitution could cap further upside.
Risk Reminder: Trading commodities involves significant risk; the high volatility of copper, combined with the use of leverage in perpetual futures, can lead to substantial capital loss. Investors should never allocate more than they can afford to lose and should employ strict risk-management tools like stop-loss orders.
