In crypto trading, success often depends on timing, knowing exactly when to enter and when to exit a position. That’s where Multiple Time Frame (MTF) Analysis becomes invaluable.
MTF analysis is a method of studying the same crypto asset across several chart intervals, such as the daily, 4-hour, and 15-minute charts, to understand both the bigger trend and short-term price behavior.
Traders use this approach to sharpen decision-making, cut through short-term noise, and identify opportunities that align with the overall market direction. Instead of reacting to every minor price fluctuation, they filter signals, confirm setups, and find high-probability entries supported by the broader trend.
By aligning short-term trades with the long-term market structure, MTF analysis helps improve precision, confidence, and risk management, three core pillars of any successful trading strategy.
What Is Multiple Time Frame (MTF) Analysis in Crypto Trading?
Think of trading like reading a map. If you only look at a small section, you might know where you are but not where you’re headed. Multiple Time Frame (MTF) Analysis works the same way, it lets traders zoom in and out of the market to see both the bigger picture and the finer details.
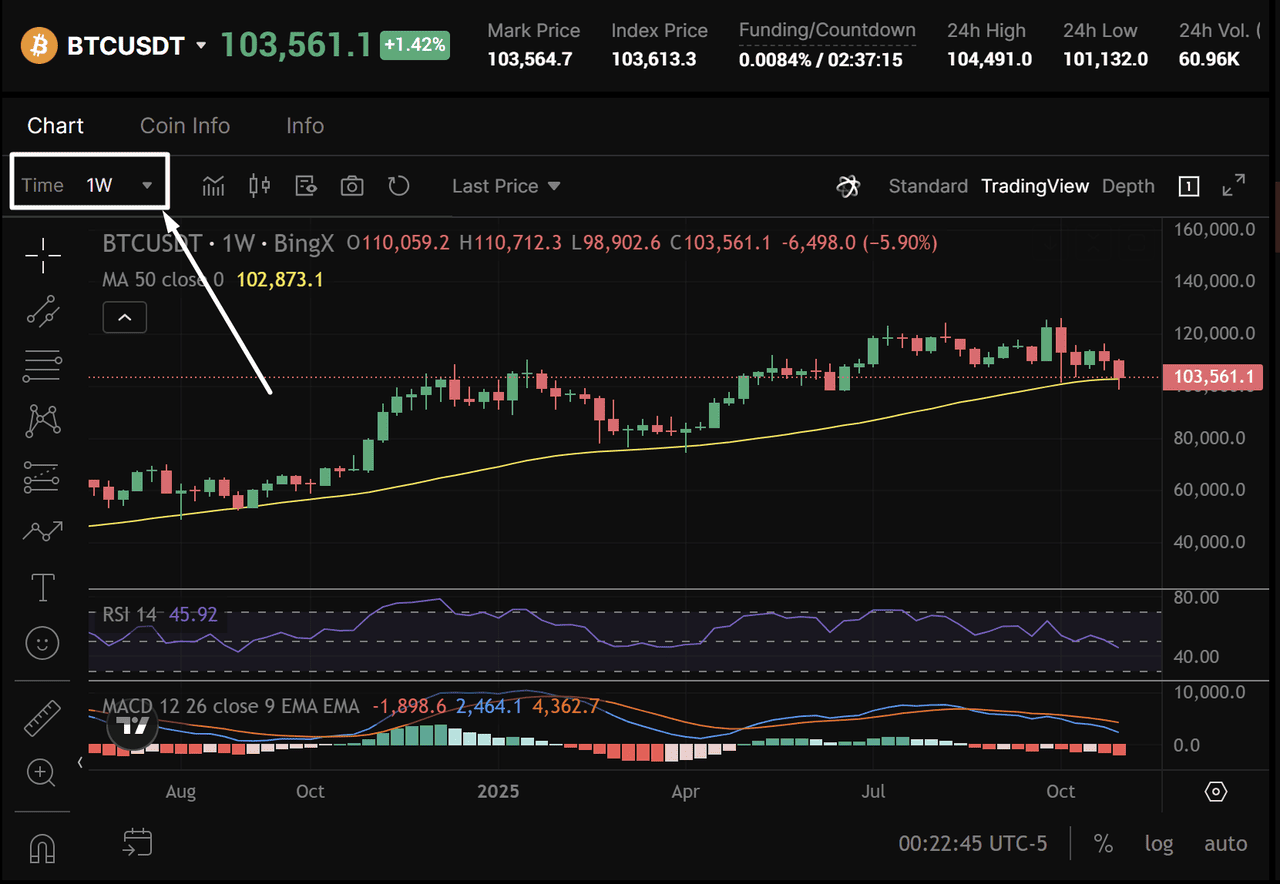
Selecting Timeframe - Source: BingX
In simple terms, MTF analysis means observing the same crypto asset on several chart intervals, for example, the daily, 4-hour, and 15-minute charts.
• The daily chart reveals the overall market trend.
• The 4-hour chart highlights corrections, pullbacks, or consolidation zones.
• The 15-minute chart refines entry and exit timing.
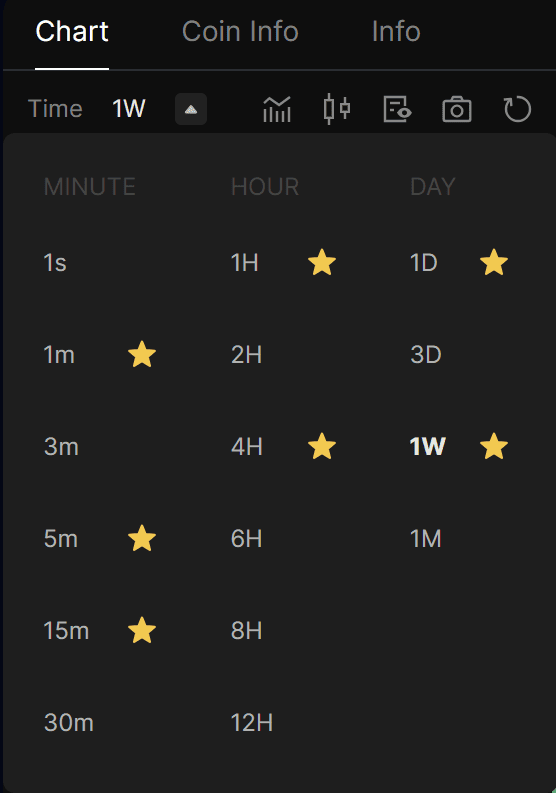
Multiple Timeframes - Source: BingX
Each layer adds a piece of context to the full market story.
For instance, Bitcoin might look ready to break out on a 15-minute chart, tempting a quick buy. But when you switch to the daily view, you might notice price is nearing a major resistance zone. That wider perspective warns the move could be short-lived.
By combining multiple time frames, traders can filter out false signals, recognize key support and resistance levels, and make informed decisions that align with the dominant trend rather than reacting to short-term volatility.
What Is the Role of Different Time Frames?
Each timeframe offers a unique perspective on market behavior. When analyzed together, they reveal the overall trend, highlight short-term corrections, and pinpoint precise entry and exit levels. This layered view allows traders to align their setups with the broader market direction while managing short-term risks more effectively.
a. Higher Time Frames (Daily, Weekly)
Higher time frames define the primary trend of a crypto asset. They help identify major support and resistance zones and reveal where prices have been heading over the long term.
For example, if Bitcoin’s daily chart shows a clear uptrend supported by rising moving averages, traders know the dominant direction favors buying opportunities. These higher frames filter out short-term noise and prevent traders from entering against the main market momentum.
b. Intermediate Time Frames (4-Hour, 1-Hour)
Intermediate charts act as the bridge between higher and lower time frames. They show retracements, pullbacks, and consolidations within the broader trend.
Swing traders often rely on these frames to identify setups such as pullbacks to a moving average, trendline retests, or breakout formations. This helps position trades in strategic areas where risk is limited, and the potential reward is higher.
c. Lower Time Frames (15-Minute, 5-Minute)
Lower time frames are used for precision and execution. They help confirm signals before entering or exiting a trade and refine stop-loss placement for tighter control.
For example, after spotting a bullish trend on the daily chart and a corrective pullback on the 4-hour chart, a bullish breakout candle on the 15-minute chart could serve as an ideal confirmation for entry.
By combining higher, intermediate, and lower time frames, traders can see both the forest and the trees, gaining a complete, structured view of the market from long-term context to short-term opportunity.
How to Combine Multiple Time Frames: Step-by-Step Process
Combining multiple time frames helps traders move from a broad market view to precise trade execution. The process works best when you stay structured: start with the big picture, narrow your focus, and confirm signals across each level before acting.
Step 1: Start with the Macro View: Weekly or Daily Chart
Begin with the higher timeframe, such as the weekly or daily chart, to identify the dominant trend. This sets the foundation for all trading decisions.
In the example below, the BTC/USDT Weekly Chart shows a clear uptrend, with price respecting a rising trendline and staying above the 50-period Moving Average (MA50). This confirms the broader bullish structure and helps traders focus on buy setups rather than countertrend trades.
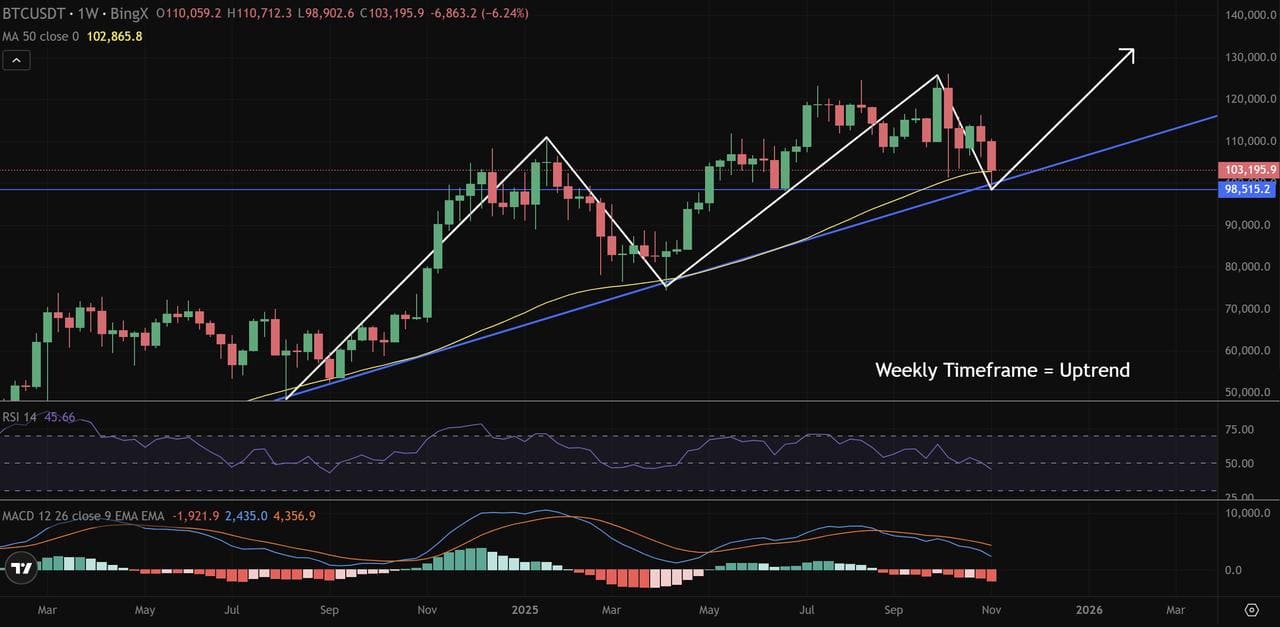
Figure 1: BTC/USDT Weekly Chart – Price remains in a long-term uptrend above MA50 and key support trendline - Source: BingX
At this stage, the goal isn’t to enter a position but to define the market bias — bullish, bearish, or neutral — so you can stay aligned with the overall momentum.
Key Takeaways:
• Dominant trend: Uptrend
• Confirmation tools: Trendline, MA50, MACD, RSI
• Trading bias: Bullish while above $98,500
Step 2: Move to the Intermediate Frame: 4-Hour or 1-Hour Chart
Next, zoom into the 4-hour chart to identify setups that align with your macro bias. This time frame highlights retracements, pullbacks, or short-term consolidations within the larger move.
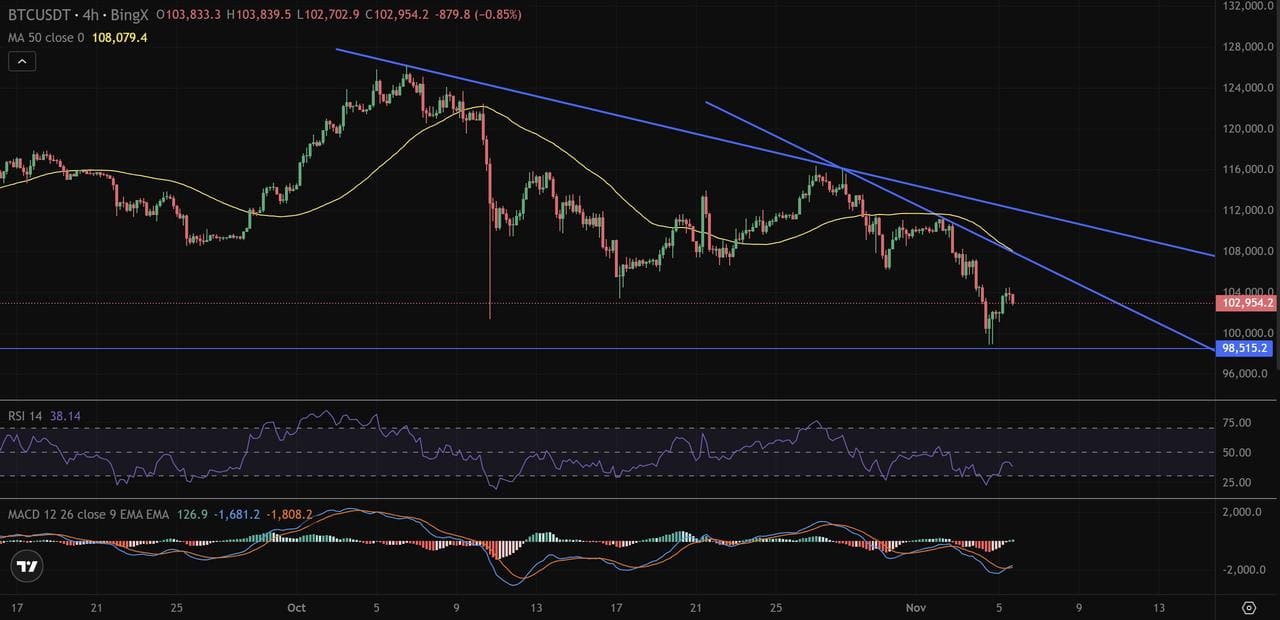
Figure 2: BTC/USDT 4-Hour Chart – Price consolidates within a descending trendline as momentum indicators begin to flatten - Source: BingX
In the example below, the BTC/USDT 4-Hour Chart shows a descending trendline, reflecting a temporary correction within the uptrend. The 50-period Moving Average (MA) acts as dynamic resistance, while the Moving Average Convergence Divergence (MACD) histogram flattens and the Relative Strength Index (RSI) dips near 40, signs of fading bearish momentum.
At this level, traders look for a breakout above resistance or a bounce from support to confirm continuation of the higher-time-frame trend.
Key Takeaways:
• Structure: Pullback within long-term uptrend
• Confirmation tools: Descending trendline, MA50, MACD flattening
• Setup idea: Wait for breakout confirmation
Step 3: Drop to the Micro Frame: 15-Minute or 5-Minute Chart
Finally, refine your entry and exit timing on the lower time frames. These shorter charts provide real-time confirmation for execution and risk management.
In the BTC/USDT 15-Minute Chart, price forms a rising channel but eventually breaks down, confirming a bearish flash. Both RSI and MACD signal weakening momentum, providing a clear short opportunity.
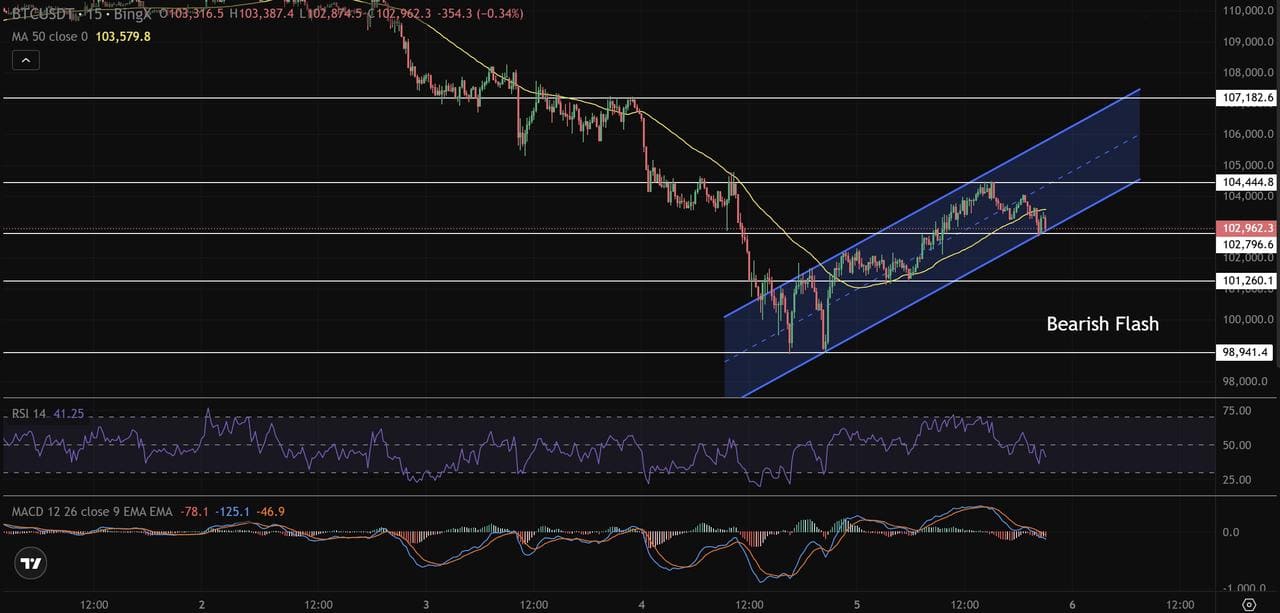
Figure 3: BTC/USDT 15-Minute Chart – Bearish breakout from a rising channel confirmed by RSI and MACD crossover - Source: BingX
Traders can place a stop-loss above the broken channel and aim for targets near the next support zone, aligning entries with the risk profile identified on higher charts.
Key Takeaways:
• Intraday structure: Rising channel breakdown
• Confirmation tools: RSI rejection, MACD crossover, moving average resistance
• Trade setup: Short toward next support with tight stop-loss
Step 4: Use Technical Indicators for Confirmation
Layer your analysis with RSI, MACD, and Moving Averages to confirm trend strength and momentum across all time frames.
When indicators align, for example, RSI recovering from oversold, while MACD crosses upward — it adds conviction and filters out weak or premature setups.
Step 5: Align All Trading Signals
The most reliable trades happen when all charts tell the same story. If the weekly chart shows an uptrend, the 4-hour chart signals a retracement to support, and the 15-minute chart confirms a bullish breakout, that’s complete alignment.
This synchronization filters out noise, improves accuracy, and builds confidence in your trade execution.
Common Mistakes to Avoid When Using Multiple Time Frames
Even experienced traders sometimes misuse multiple time frame analysis by overcomplicating charts or misreading signals. Here are the most common pitfalls, and how to avoid them.
1. Using Too Many Time Frames
It’s tempting to analyze every possible chart interval, but that often leads to conflicting signals and confusion.
Solution: Stick to three time frames that suit your trading style, one for trend direction (e.g., Daily or Weekly), one for setup (4-Hour or 1-Hour), and one for execution (15-Minute or 5-Minute). This keeps analysis simple and consistent.
2. Ignoring the Higher-Time-Frame Trend
Many traders get trapped by short-term reversals that go against the main trend.
Example: A quick 15-minute bounce may look bullish, but if the 4-hour chart shows a clear downtrend, that rally is likely to fail.
Solution: Always start your analysis from the higher time frame to confirm the market’s true direction before entering on smaller charts.
3. Overreacting to Short-Term Noise
Crypto’s 24/7 volatility can make traders act emotionally on small moves.
Solution: Let the higher time frame structure guide your expectations. Only take trades when smaller charts align with your broader plan, not when the market makes random intraday spikes.
4. Relying Solely on Indicators
Indicators like RSI, MACD, and Moving Averages are valuable tools, but they should support your understanding of price action, not replace it.
Solution: Combine indicators with trendlines, channels, and support/resistance levels to confirm the setup visually and contextually.
5. Entering Without a Clear Exit Plan
Focusing only on entries without defining exits leads to inconsistent results.
Solution: Set stop-loss and take-profit levels before entering a trade. For example, place a stop just below the previous swing low and a target near the next resistance zone to keep risk and reward structured.
By avoiding these mistakes, traders can use multiple time frame analysis effectively, filtering out false signals, improving risk control, and staying synchronized with the market’s broader rhythm.
What Are the Benefits of Multi-Time-Frame Trading?
When used correctly, multiple time frame analysis gives crypto traders a sharper, more reliable edge. It combines the clarity of the higher trend with the precision of shorter time frames, leading to better timing, discipline, and consistency.
• Clear Market Context: Understand the overall trend by starting with higher time frames to see whether the market is trending, ranging, or reversing.
• Accurate Entries and Exits: Use smaller charts to refine timing, reduce stop-loss size, and improve risk-to-reward ratios.
• Better Risk Management: Align stop-loss and target levels with higher-time-frame support and resistance zones for structured trade planning.
• Stronger Confirmation: Combine RSI, MACD, and Moving Averages across multiple time frames to validate trade direction and momentum.
• Reduced False Signals: Avoid reacting to short-term volatility by confirming setups within the broader trend.
• Adaptable for All Trading Styles: Works effectively for scalpers, day traders, and swing traders by adjusting time frame combinations.
• Higher Confidence and Consistency: Unified signals across charts improve conviction, helping traders stay disciplined and objective.
Conclusion
Multiple Time Frame (MTF) Analysis brings structure and clarity to crypto trading by showing how short-term price action fits inside the bigger trend. Instead of reacting to every candle, traders can filter out noise, confirm direction, and execute with greater confidence. MTF trading reduces false signals and helps traders stay aligned with the market rather than fighting it.
The key is finding the right balance. You can use enough time frames to confirm the trend, but not so many that analysis becomes confusing. Most traders rely on three charts, one for the overall trend, one for spotting setups, and one for precise entries. Whether you’re a swing trader or day trader, MTF analysis turns observation into precision by keeping every trade in sync with the broader market movement.
Related Reading
FAQs on Using Multiple Time Frames in Crypto Trading
1. What are the best time frame combinations for crypto trading?
The ideal combination depends on your trading style and how long you hold positions:
• Scalpers: 15-minute, 5-minute, and 1-minute charts (for short, high-frequency moves).
• Day traders: 4-hour, 1-hour, and 15-minute charts (for intraday setups).
• Swing traders: Weekly, Daily, and 4-hour charts (for multi-day or multi-week swings).
• Position traders: Monthly, Weekly, and Daily charts (for long-term accumulation or trend following). Each set balances trend awareness, setup clarity, and entry precision for that trading horizon.
2. How many time frames should a crypto trader use?
Stick with three complementary time frames. The higher frame defines the overall trend, the middle frame reveals setup structure, and the lower frame sharpens entry and exit timing. Using more adds noise; using only one limits perspective.
3. Why do different timeframes sometimes conflict in crypto?
Because crypto markets trade 24/7 and react instantly to liquidity shifts or news. A 15-minute pullback can look bearish, while the daily chart still shows a strong uptrend. Recognizing that smaller frames reflect short-term noise while larger frames show the dominant cycle helps avoid emotional trades.
4. How can indicators like RSI or MACD confirm crypto signals across timeframes?
When indicators align across multiple charts, they reinforce the trade idea. For instance, if MACD crosses bullishly on both the 4-hour and 1-hour charts and RSI climbs above 50 on the 15-minute chart, it confirms momentum in favor of the prevailing trend. Consistency across time frames strengthens conviction and reduces false signals.