
The Bitcoin Liquidation Heatmap is often compared to a crypto weather radar, providing unparalleled insights into high-volatility zones within the cryptocurrency market. By identifying key areas of liquidity and potential price reversals, this tool equips traders with the ability to anticipate critical market movements. High-volatility zones revealed by the heatmap often act as magnet zones, pulling Bitcoin’s price toward significant liquidation levels. For traders, both novice and seasoned, understanding the mechanics of this tool is essential for maximizing profitability and minimizing risk.
In this article, we’ll explore the Bitcoin Liquidation Heatmap in depth, unpack its functionality, and outline strategies to integrate its insights into your trading approach. Whether you’re navigating the turbulent waters of day trading or planning long-term investments, mastering this tool can offer a substantial competitive edge in the fast-paced world of Bitcoin trading.
What is Liquidation in Crypto Futures Trading?
Before diving into the heatmap, it’s crucial to grasp the fundamentals of liquidation in crypto trading. Futures trading, a popular product among crypto enthusiasts, enables traders to amplify their position size by borrowing funds. While this method can generate substantial profits, it carries equally significant risks. Should the market move unfavorably against a trader’s position beyond a certain threshold, the trader’s account balance may become insufficient to cover the losses, leading to forced liquidation.
This process safeguards exchanges and ensures broader market stability by preventing unchecked losses from spiraling out of control. For traders looking to go long or short on Bitcoin, BingX’s Futures market offers the flexibility and leverage needed to execute precise trades based on liquidation heatmap signals.
Moreover, liquidation events often mark critical price points that attract significant market activity. Recognizing these levels can provide traders with essential insights into potential price movements and volatility zones. By understanding where these liquidations are likely to occur, traders can anticipate market reactions, better manage risks, and strategically position their trades.
Key Takeaway: Liquidation levels serve as pivotal markers in the trading ecosystem, pinpointing areas where leveraged positions may be forcibly closed due to adverse price movements. These insights are invaluable for predicting market behavior and enhancing trading strategies.
BingX BTC/USDT liquidation heatmap (1 year) | Source: CoinGlass
What Is the Bitcoin Liquidation Heatmap?
The Bitcoin Liquidation Heatmap is a visual tool that maps potential liquidation levels across Bitcoin’s price spectrum. By analyzing data from major exchanges and various leverage ratios, the heatmap predicts zones of high liquidity where significant liquidation events are likely to occur. Platforms like Coinglass aggregate this data and present it using a gradient of colors:
1. Purple to Blue: Low liquidation potential.
2. Blue to Green: Medium liquidation potential.
3. Green to Yellow: High liquidation potential.
The yellow zones are the most critical, often indicating areas of concentrated liquidity and heightened volatility.
How Does the Bitcoin Liquidation Heatmap Work?
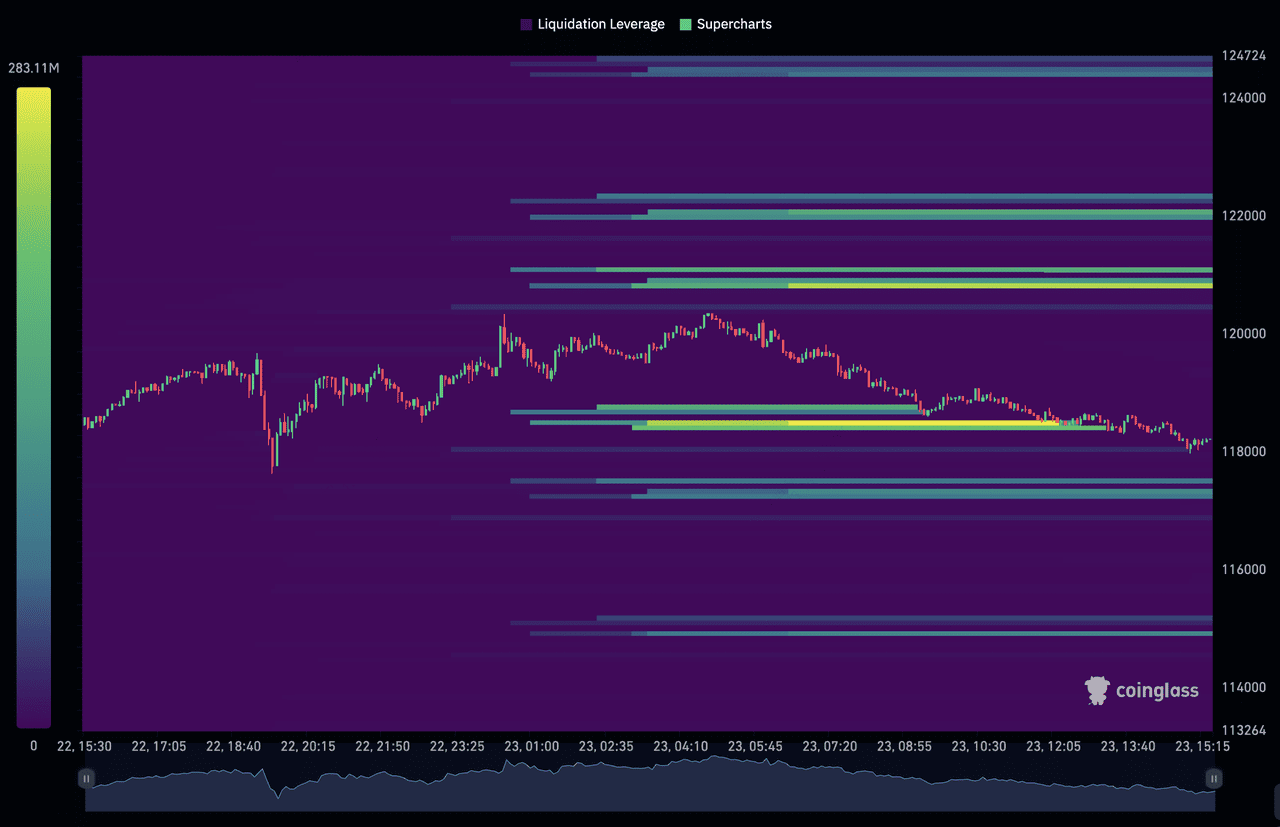
The Bitcoin Liquidation Heatmap works by combining comprehensive data from perpetual swaps, trading pairs, and historical liquidation events to provide traders with a clear picture of potential market stress points. The color gradients on the heatmap represent varying intensities of liquidation potential, with bright yellow zones indicating areas of high liquidation likelihood. These zones often act as magnet zones, pulling Bitcoin’s price toward them due to the clustering of leveraged positions. The heatmap consolidates this data across multiple exchanges and timeframes, offering traders customizable and real-time insights into market sentiment.
For example, imagine Bitcoin’s price is hovering around $120,000, and the heatmap shows a bright yellow zone at $118,000. This indicates a cluster of long liquidation levels. As Bitcoin’s price drops toward $118,000, cascading liquidations might occur, creating intensified downward momentum. Conversely, if a similar yellow zone is observed above the current price, say at $122,000, it could signal significant short liquidation potential, which may accelerate upward price movement.
This powerful tool not only provides traders with visual cues but also equips them to make more informed decisions by anticipating where Bitcoin value might experience heightened volatility or sharp reversals.
Key Concepts in Liquidation Heatmaps
1. Magnet Zones
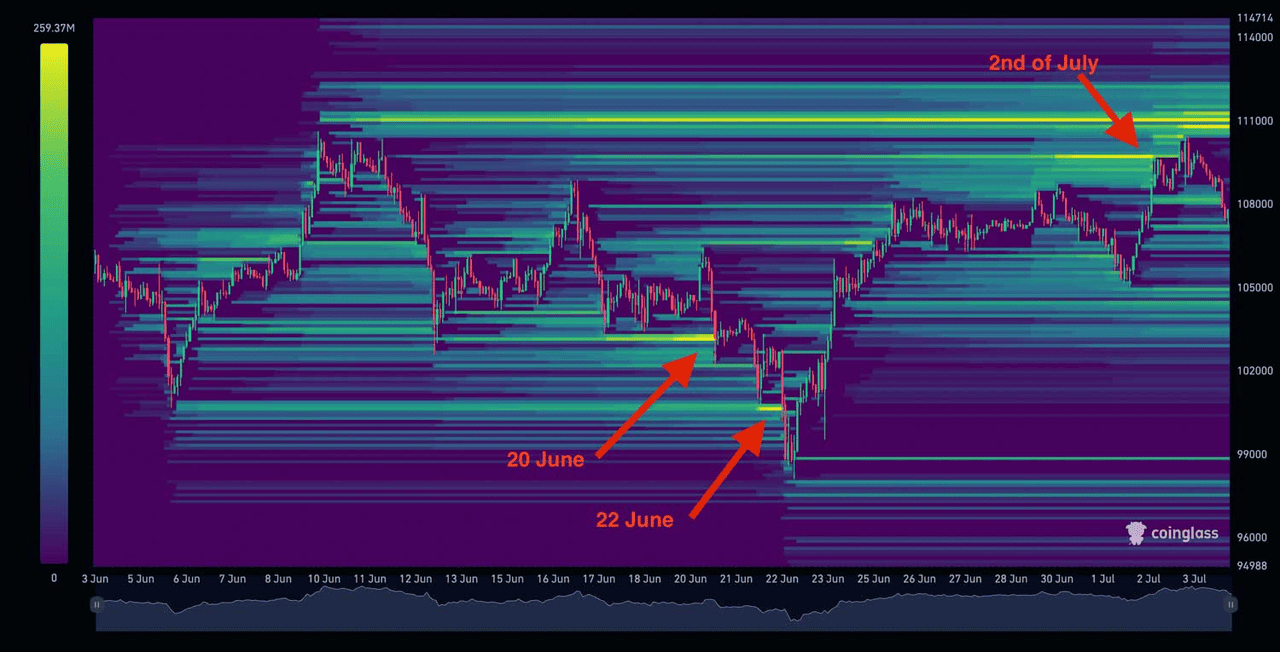
Magent zones on liquidation heatmap | Source: Whale Portal
Magnet zones refer to areas with a dense concentration of liquidation levels, acting as gravitational points for Bitcoin’s price movement. These zones often behave like vacuums, pulling the price closer as liquidations are triggered. The effect intensifies when large volumes of leveraged positions are clustered, creating a domino effect of cascading liquidations that amplifies volatility. Traders use these magnet zones to predict potential price movements and identify areas where momentum might accelerate, providing opportunities to strategically enter or exit positions.
2. Support and Resistance Levels
High liquidation zones frequently serve as pivotal support or resistance areas in the market. When Bitcoin’s price approaches these levels, the substantial liquidity often causes a temporary price halt or reversal. Traders can observe significant liquidations clearing leveraged positions, which may lead to market stabilization or the establishment of a new trend. These zones are particularly valuable for traders looking to confirm potential breakout points or secure entries and exits with reduced risk.
3. Whale Activity
Whales, or large-scale traders, gravitate toward high-liquidity zones to execute sizable trades efficiently while minimizing slippage. These zones allow them to move significant volumes without drastically impacting the price. Observing whale activity in these areas provides critical insights into market trends, as whales often act as market movers. Recognizing their strategies within these zones can give traders an edge in aligning their trades with significant market flows.
How to Use the Bitcoin Liquidation Heatmap in Trading Strategies
Here’s how you can integrate the Bitcoin Liquidation Heatmap into your trading approach:
1. Identifying Price Reversal Zones
Clusters of liquidation levels often serve as strong indicators of potential price reversals. For instance, when Bitcoin approaches a zone with a high concentration of long liquidations, it’s common to see downward momentum accelerate, triggering cascading liquidations. This provides an opportunity for traders to consider short positions. Conversely, areas with concentrated short liquidations often signal upward price movements, as liquidations force buying activity, pushing the price higher. These reversal zones are invaluable for planning trades and anticipating market shifts.
2. Timing Entry and Exit Points
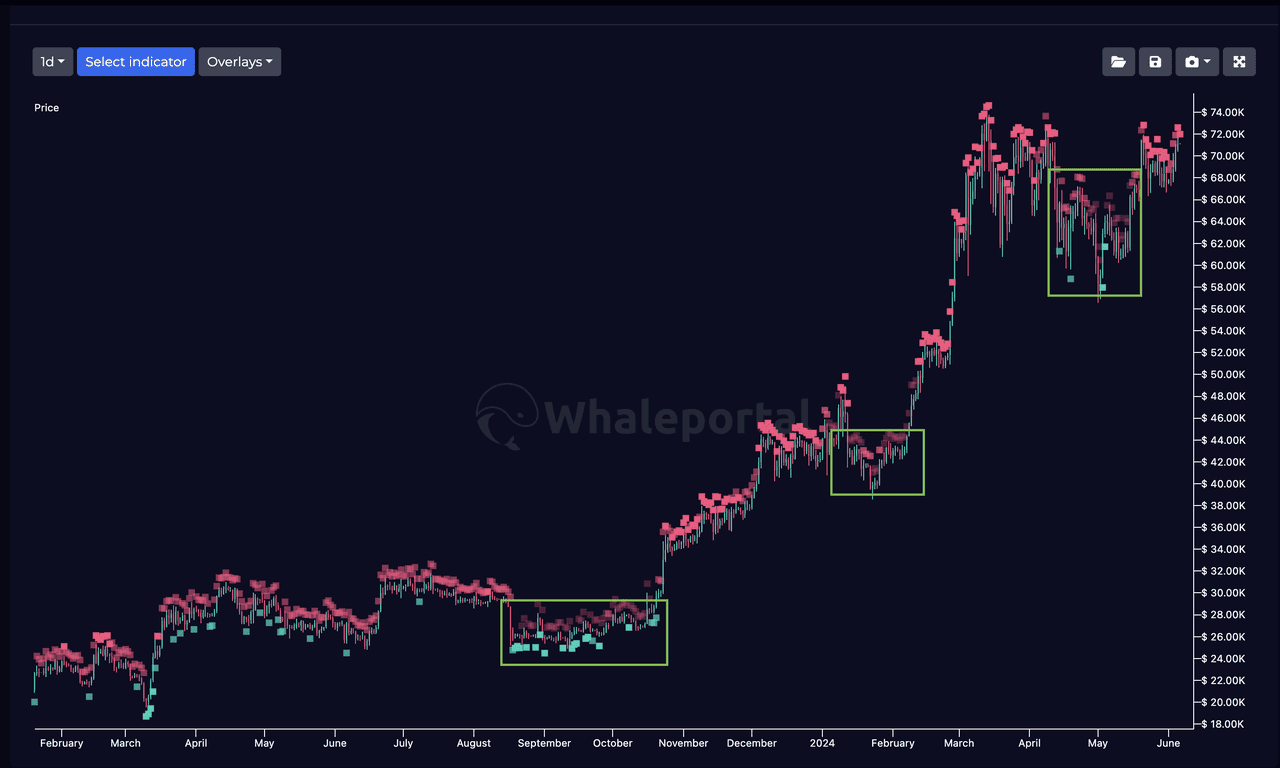
Spotting buying and selling zones on liquidation heatmaps | Source: Whale Portal
Strategically timing your entry and exit points is critical in volatile markets. The heatmap allows traders to identify magnet zones, areas of intense liquidation activity, and act before the price reaches these zones. By entering or exiting positions just ahead of these high-liquidity regions, traders can avoid the volatility storms caused by cascading liquidations, preserving capital and optimizing returns.
3. Gauging Market Sentiment
The balance between long and short liquidation levels offers a clear window into market sentiment. A higher number of liquidation levels below the current price often indicates a majority of traders holding long positions, while more liquidation levels above the price suggest an abundance of short positions. Understanding this balance helps traders predict broader market trends and position themselves effectively in anticipation of potential market moves.
4. Tracking Whale Movements
Whales, or large-scale traders, frequently execute substantial trades in high-liquidity zones to minimize slippage and maximize efficiency. Observing whale activity in these areas can provide traders with critical insights into the market’s direction. Aligning your strategy with whale movements can enhance your positioning, as their trades often create significant price impacts. By focusing on these zones, traders can gain a competitive edge and better align their actions with influential market players.
Advanced Features: Maximizing Heatmap Utility
1. Flexible Timeframes: The Bitcoin Liquidation Heatmap provides insights across timeframes from 12 hours to a year. Shorter intervals, like 12-hour views, help day traders spot trends and opportunities quickly, often visible in a Bitcoin rainbow chart. Long-term investors use weekly or yearly views to identify patterns and align strategies with Bitcoin’s value trends. This flexibility caters to diverse trading objectives.
2. Cross-Exchange Analysis: Platforms like Coinglass enable cross-exchange comparisons, letting traders filter data by exchange and pair. For instance, comparing the liquidation zones reveals sentiment differences, aiding informed decisions. This functionality offers a broader market view across platforms.
Pro Tip: Combine the heatmap with tools like open interest metrics and support/resistance analysis for robust strategies.
Practical Example: Spotting Opportunities
Imagine Bitcoin is trading at $122,000, and the heatmap highlights a prominent yellow zone at $121,000, indicating a cluster of long liquidation potential. As Bitcoin’s price edges closer to $121,000, cascading liquidations could amplify selling pressure, driving the price downward more aggressively. This insight helps traders prepare for increased volatility and potentially enter short positions to capitalize on the downward momentum. Conversely, if the heatmap shows a yellow zone at $63,000, it suggests concentrated short liquidations. As the price moves upward toward this level, forced closures of short positions can accelerate buying activity, pushing the price higher and creating opportunities for long positions.
Trade BTC Futures Using the Liquidation Heatmap on BingX
BingX is the perfect platform for turning liquidation heatmap insights into actionable Bitcoin trades. With ultra-low trading fees (starting from 0.1%), lightning-fast execution, and integrated tools like BingX AI, the exchange empowers you to react swiftly to price moves around high-volatility zones. Whether you’re preparing for cascading liquidations or anticipating a short squeeze, BingX’s infrastructure and real-time analytics give you a competitive edge.
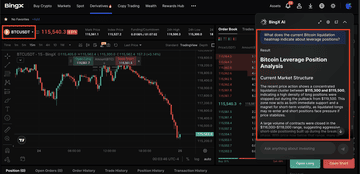
Trading BTC/USDT on BingX futures market with BingX AI's insights
1. Identify Key Zones on the Heatmap: Use platforms like Coinglass or Whale Portal to spot magnet zones, areas with clustered liquidation levels around Bitcoin’s current price.
2. Cross-Reference with BingX AI Insights: Log in to BingX and open the BingX AI assistant for real-time market sentiment, price predictions, and liquidation data. This helps confirm your analysis and reveals trends not visible on the heatmap alone.
3. Choose Your Trading Strategy
• If price is nearing a long liquidation cluster (below current price), prepare for possible downward momentum and consider short positions.
• If approaching a short liquidation cluster (above current price), expect upward momentum and look for long setups.
4. Execute Your Trade on BingX: Go to the BTC/USDT pair on BingX Spot or Futures market. Select Market or Limit order based on your strategy. Adjust leverage if using Futures and set stop-loss/take-profit around support/resistance zones tied to liquidation levels.
5. Monitor with Real-Time Tools: Use BingX’s live charts, order book, and AI-enhanced metrics powered by BingX AI to track price movement, liquidation spikes, and whale activity. Set alerts for when Bitcoin nears key heatmap zones.
6. Exit Strategically: As Bitcoin approaches the targeted liquidation zone, consider locking in profits or adjusting your stop-loss to secure gains. Use AI signals to detect weakening momentum or potential reversals.
What Are the Risks and Limitations of Using the Liquidation Heatmap?
While the Bitcoin Liquidation Heatmap is a powerful tool, it comes with certain limitations that traders must consider. One key limitation is data accuracy, as the heatmap reflects relative liquidation intensities rather than precise figures. Many traders close their positions manually before reaching liquidation levels, which can reduce the reliability of the data. Additionally, sudden shifts in market sentiment can rapidly alter liquidation zones, requiring traders to stay vigilant and adaptable to unexpected market dynamics.
Furthermore, the heatmap should not be relied upon in isolation. For a comprehensive market analysis, it is best used alongside other trading tools and indicators, such as volume analysis, open interest, and support/resistance levels. This combination helps traders develop a well-rounded strategy, mitigating risks while maximizing the utility of the heatmap's insights.
Conclusion
The Bitcoin Liquidation Heatmap provides traders with a unique perspective on market liquidity and sentiment. By identifying magnet zones, anticipating price reversals, and understanding market dynamics, traders can leverage this tool to make more informed decisions. Whether you’re a day trader or a long-term investor, integrating the heatmap into your strategy can help you navigate the high-volatility world of Bitcoin trading with greater confidence.
Key Takeaways
1. Magnet Zones: Use concentrated liquidation levels to predict price movements.
2. Support/Resistance: Leverage high-liquidation zones for entry and exit strategies.
3. Market Sentiment: Analyze long versus short liquidations to gauge market trends.
4. Timeframe Flexibility: Tailor the heatmap’s insights to your trading style.
As the crypto market grows, tools like the Bitcoin Liquidation Heatmap offer invaluable insights. By staying informed and proactive, you can turn volatility into opportunity and thrive in the dynamic world of cryptocurrency trading.