
The cryptocurrency market generates massive trading volumes every day, and anyone trading bitcoin without a high-quality charting platform is essentially making decisions in the dark. Data from CoinGecko shows that BTC daily trading volume consistently exceeds US$30 billion, with even higher spikes during periods of elevated volatility. In this environment, charting platform quality is no longer just a technical detail — it has become a direct competitive edge. For Brazilian traders, who often deal with limited trading windows due to time zone differences with Asian and U.S. markets, having fast, accurate charts with customizable indicators can make the difference between catching the right entry or exiting a trade at the worst possible moment.
Quick answer: Platforms with advanced real-time bitcoin charts combine live price feeds, multiple technical indicators, drawing tools, and market depth (order book) data. To choose the best platform: (1) verify the data feed latency, (2) evaluate the available native indicators, (3) check integration with the exchange where you trade, and (4) test the mobile usability.
What Are Advanced Bitcoin Charts and Why They Matter
A basic chart shows price and time. An advanced chart goes far beyond that: it displays volume per candle, market depth, multiple timeframes simultaneously, layered technical analysis indicators (moving averages, Bollinger Bands, RSI, MACD, among others), and drawing tools such as trend lines, Fibonacci retracements, and price channels.
Think of it this way: trading bitcoin with a basic chart is like driving at night with the headlights off. You know the road exists, but you cannot see the potholes. A strong advanced chart turns on the headlights and adds a GPS to the screen.
For active traders in Brazil, who typically engage in day trading or swing trading with pairs such as BTC/USDT and BTC/BRL, the most impactful features include:
- Real-time price feeds with tick-by-tick or millisecond updates
- Multiple indicators layered on the same chart
- Drawing tools that can be saved between sessions
- Order book access integrated directly into the chart
- Customizable price alerts configured directly within the platform
How to Measure Price Feed Latency
Before blindly trusting any platform’s chart, it is important to understand how latency works, because it directly impacts the price you see on your screen.
Basic price lag formula:
Visible latency = Tick capture time – Chart display time
In practice, high-quality platforms deliver latency below 100 milliseconds. Some top-tier exchanges achieve 10–20ms. Third-party platforms that aggregate data from multiple sources typically experience higher latency, ranging from 200ms to 1 second.
Practical example: imagine BTC is trading at US$68,400 and a 1-minute candle is about to close. If your platform has 800ms of latency, you will see the candle close almost 1 second late. In a market capable of moving 0.3% within seconds during major news events, that delay can result in entering at a price that is already outdated.
The simplest way to test this is to open two charts from different sources on the same monitor and observe which one updates first during periods of high volatility.
Top Platforms with Advanced Bitcoin Charts
BingX
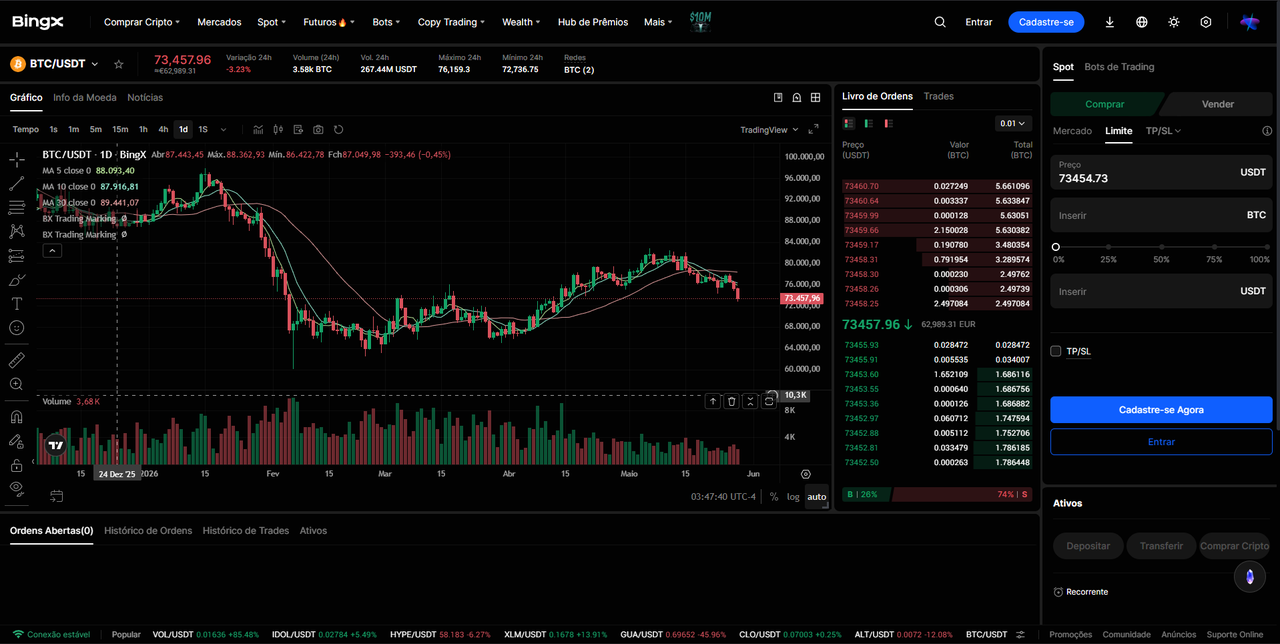
The BingX platform offers TradingView-integrated charts directly within the exchange interface, solving a classic trader problem: needing to keep two separate tabs open — one for analysis and another for order execution. On BingX, both processes happen on the same screen.
Features available on the platform include:
- Japanese candlestick charts with more than 60 native technical indicators
- Complete drawing tool suite (trend lines, Fibonacci, channels, Elliott Wave patterns)
- Multiple timeframes, ranging from 1-minute to weekly charts
- Live pricing data for BTC/USDT and other trading pairs with real-time updates
- Integrated order book within the chart panel
- Price alerts configurable via email and push notifications
- Multi-asset chart mode for comparative layouts
- Real-time market insights powered by BingX AI
For Brazilian traders, BingX offers a meaningful practical advantage: Portuguese-language support and localized customer service, making it easier to resolve technical questions about indicator configuration without relying on translations. The platform also provides a demo trading account with virtual funds for users who want to test strategies without risking real capital, making it ideal for fine-tuning chart setups before trading live.
TradingView
TradingView operates as a standalone charting tool, pulling data simultaneously from multiple exchanges.
The main limitation for traders using BingX or other exchanges is that TradingView is, in most cases, separate from trade execution. You analyze on one platform and execute orders on another tab. Some brokers offer direct integration through TradingView Broker, but not all exchanges participate in the program.
TradingView’s free plan limits the number of simultaneous indicators per chart (up to 3 indicators on the free tier) and does not allow advanced layout saving. Professional use requires a paid subscription (starting at approximately US$14.95/month).
Coinigy
Coinigy is a multi-exchange analytics platform that connects more than 45 exchanges within a single charting interface. It is useful for traders operating across multiple platforms who want to consolidate their market view. The cost is higher (plans starting at US$18.66/month), and the interface is less intuitive for beginners.
Exchanges with Native Charting (Binance, Bybit, OKX)
Most major exchanges offer native charting tools with partial TradingView integration. Binance and Bybit, for example, provide chart interfaces but with fewer customization features and drawing tools compared to dedicated charting solutions. They work well for quick analysis but can feel limiting for more advanced traders.
CEX vs. DEX: Differences in Bitcoin Charting
Traders transitioning from traditional stock markets into crypto sometimes analyze charts on DEX platforms such as Uniswap or dYdX. It is important to understand the differences:
|
Criteria |
CEX (Centralized Exchange) |
DEX (Decentralized Exchange) |
|
Chart quality |
High — real-time order book data |
Lower — dependent on external indexers |
|
Feed latency |
Low (10–200ms) |
Higher (depends on blockchain block time) |
|
Visible liquidity |
Full order book |
Liquidity pools (AMM) |
|
Technical tools |
Comprehensive |
Basic in most cases |
|
Integrated execution |
Yes |
Yes, through wallets |
For trading bitcoin using advanced technical analysis, CEXs remain the most suitable environment. DEXs are more relevant for newly launched tokens with early-stage liquidity, where a traditional order book does not exist. Explore the top DEXs in the market if you want to complement your trading activity with assets outside centralized exchanges.
Essential Technical Indicators for Bitcoin Charts
An advanced chart only fulfills its purpose if the indicators are configured correctly. The most widely used indicators by BTC traders in Brazil include:
Moving Averages (MA and EMA)
Simple and exponential moving averages form the foundation of trend analysis. The classic setup for bitcoin is the 21-period EMA combined with the 50 EMA and 200 EMA. When the EMA 21 crosses above the EMA 50, it signals short-term bullish momentum. The EMA 50 crossing above the EMA 200 (Golden Cross) is one of the most closely watched signals among institutional market participants.
RSI (Relative Strength Index)
The RSI measures the relative strength of price movement on a scale from 0 to 100. Readings below 30 indicate oversold conditions, while readings above 70 indicate overbought conditions. In bitcoin markets, RSI often remains in overbought territory for extended periods during bull markets, something traders need to account for in order to avoid missing upside momentum.
Volume
Volume is one of the most underestimated indicators among beginner traders. A bullish candle accompanied by above-average volume carries significantly more weight than an isolated candle. High-quality platforms display real-time volume at the bottom of the chart, integrated directly with price bars.
Bollinger Bands
A volatility indicator that shows when price is deviating significantly from its average. When the bands narrow (a squeeze), it signals that a strong move may be approaching. In bitcoin markets, Bollinger squeezes are particularly effective ahead of major breakouts.
MACD
The MACD combines moving averages to measure momentum. The MACD histogram is one of the most widely used tools for identifying medium-term reversals in BTC. Combine these indicators with a solid risk management strategy and proper stop-loss and take-profit orders to protect your positions.
Charts on Mobile Devices: What to Evaluate
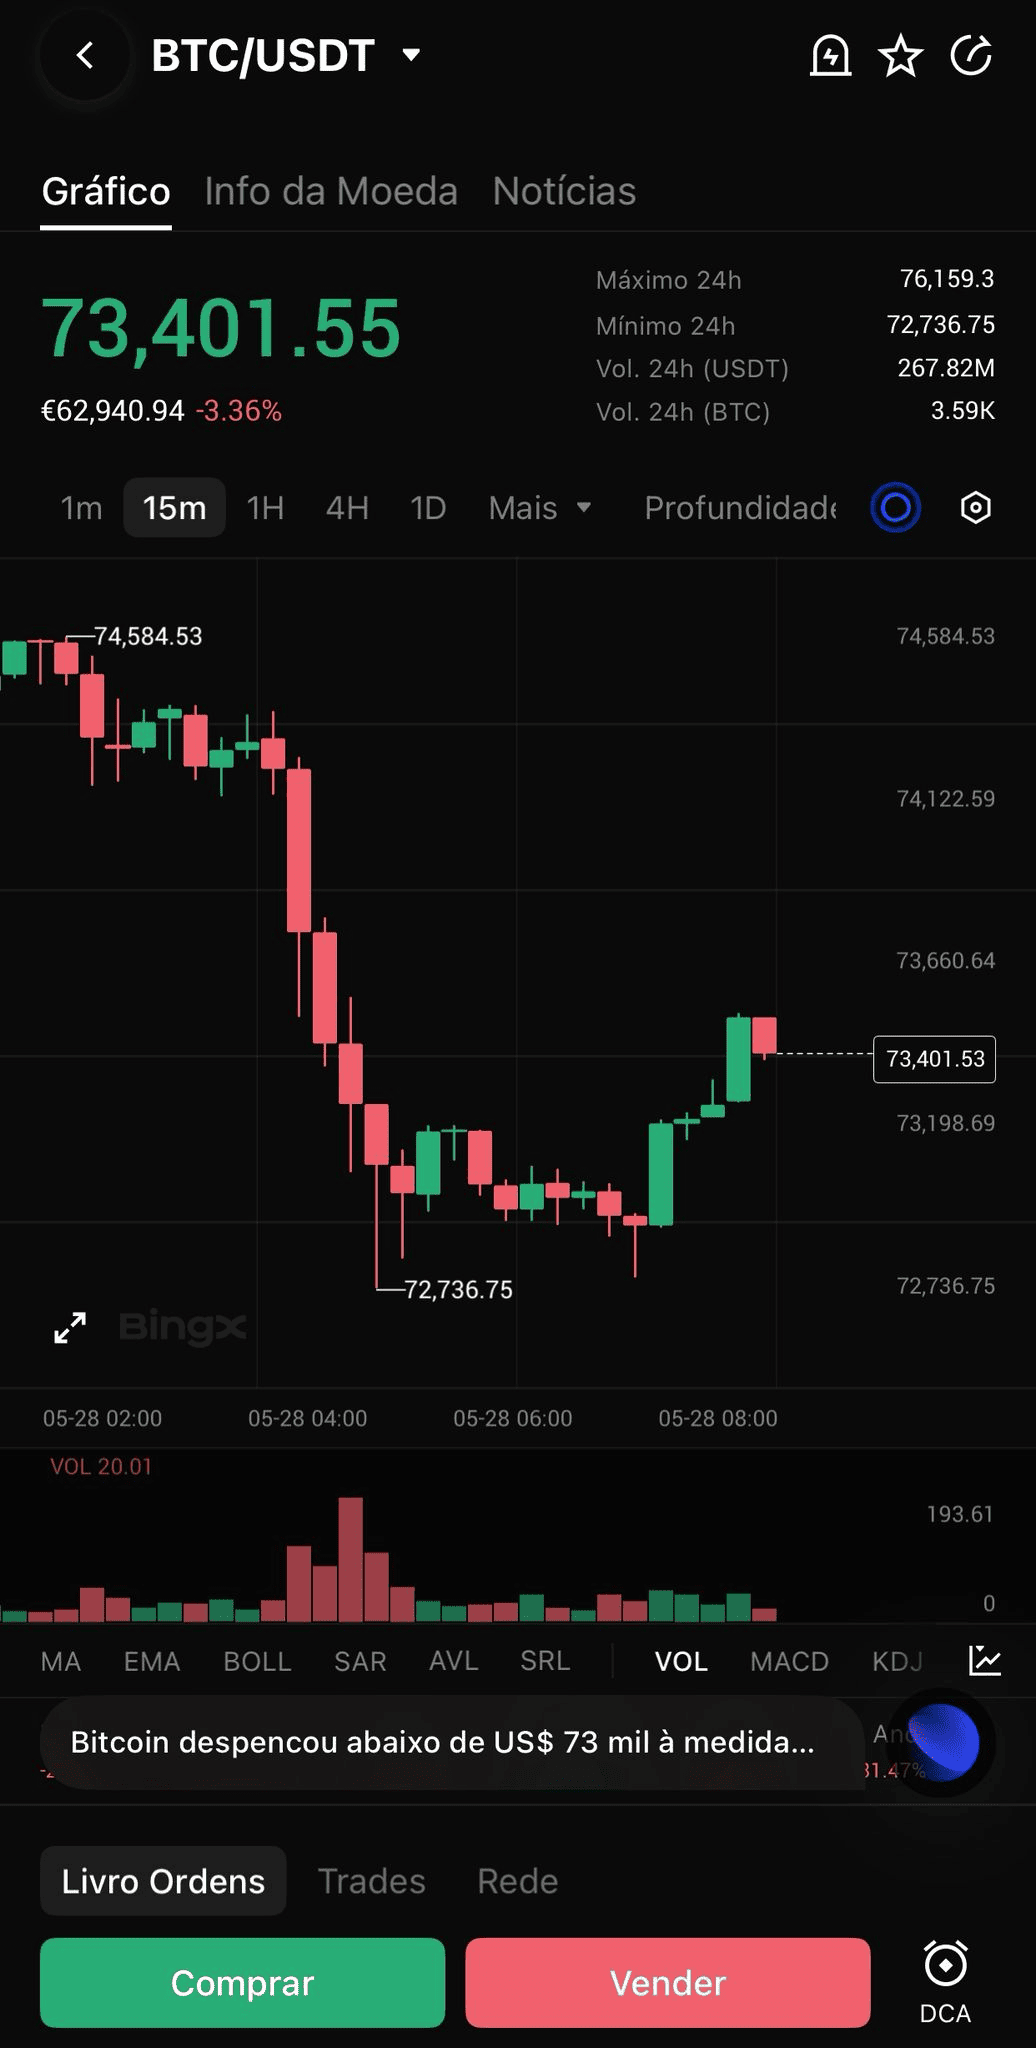
A large portion of Brazilian traders monitor the market through mobile devices throughout the day. When evaluating a platform from a mobility perspective, consider the following:
- Does the app load real-time charts smoothly without freezing?
- Can indicators be added and adjusted directly within the app?
- Do the drawing tools work effectively on touchscreen devices?
- Does the app send price alerts even when the screen is locked?
BingX offers apps for both iOS and Android with full support for charting and order execution, enabling users to perform analysis and open positions without needing desktop access. This is especially relevant for traders who operate while working and require true mobility rather than a simplified version of the platform. The app also provides direct access to copy trading and grid trading bots directly from mobile devices.
Chart Features That Separate Average Platforms from Professional Ones
Some features may go unnoticed during an initial evaluation, but they make a significant difference in day-to-day trading:
Automatic layout saving: platforms that fail to save your chart settings between sessions force traders to reconfigure indicators and trend lines every time they log in. This wastes time and creates unnecessary room for mistakes.
Multi-chart view on a single screen: the ability to open BTC/USDT across four timeframes simultaneously (1H, 4H, daily, and weekly) within one window is a favorite feature among swing traders who need to confirm trends across multiple horizons before entering a position.
Visual market depth: some platforms integrate liquidity heatmaps (order book heatmaps) directly into the chart, showing where buy and sell orders are concentrated. This feature is particularly valuable for BTC scalpers.
Deep historical data: for visual backtesting strategies, the more historical data available, the better. Platforms that limit historical data to only six months severely restrict medium- and long-term pattern analysis.
FAQ: Real-Time Bitcoin Charts
1. What is the best free platform for bitcoin charts?
For traders using BingX, the platform’s integrated charts deliver an advanced experience at no additional cost, including unlimited indicators and comprehensive drawing tools. Access them directly through the BingX spot market.
2. What is the difference between line charts and candlestick charts for bitcoin?
A line chart only displays closing prices over time, making it useful for a macro-level overview. Japanese candlestick charts display the opening, closing, high, and low of each period, revealing much more about the internal dynamics of price action. For professional technical analysis, candlestick charts are the market standard.
3. How does the live bitcoin price feed work?
Exchanges collect data from every executed transaction (trade) and transmit this stream via WebSocket to charting platforms. The speed of this transmission determines feed latency. Platforms directly connected to the exchange where you trade are generally faster than third-party aggregators.
4. Is it possible to perform bitcoin technical analysis on mobile?
Yes, but with limitations. Leading exchange apps and TradingView mobile versions allow analysis using indicators and drawing tools. However, the experience is more restricted on smaller screens, especially for traders using multiple timeframes or extensive chart annotations. For detailed analysis, desktop platforms remain superior.
5. What is an order book integrated into the chart?
It is the visualization of pending buy (bids) and sell (asks) orders directly within the chart panel. This allows traders to identify support and resistance zones based on real liquidity rather than technical analysis alone. The closer the order book is integrated with the chart, the less time traders waste switching between windows.
6. Is it worth paying for a premium charting platform?
It depends on trading frequency. For traders who operate daily, features such as layout saving, multiple indicators, advanced alerts, and deep historical data often justify the subscription cost. For occasional traders, free platform versions are usually sufficient. It is also worth considering that BingX already provides advanced integrated charts at no additional cost, potentially eliminating the need for an external subscription. Check the BingX fee guide to better understand the total cost of trading on the platform.
7. How do you set price alerts on a bitcoin chart?
Most advanced platforms allow users to create alerts directly on the chart by clicking on a price level or indicator condition (for example, RSI below 30). On BingX, alerts can be configured for both push notifications and email alerts without requiring the platform to remain open.
8. What is a liquidity heatmap and how is it used on charts?
A liquidity heatmap is a visual layer overlaid on the chart that shows the concentration of orders within the order book over time. Warm colors (red/orange) indicate large concentrations of orders at specific price levels. Short-term traders use this feature to identify where price may seek liquidity before reversing.
Key Takeaways
- Advanced bitcoin charts integrate live price feeds, technical indicators, drawing tools, and market depth data within a single interface
- Feed latency is the most important technical criterion, and platforms integrated directly with the exchange where you trade tend to be faster
- BingX offers TradingView-integrated charts directly within the trading interface, eliminating the need to switch between platforms to analyze and execute trades in both the spot market and perpetual futures market
- Essential indicators for BTC include moving averages (EMA 21/50/200), RSI, volume, Bollinger Bands, and MACD
- CEXs provide superior chart quality compared to DEXs for advanced technical analysis due to real-time order book data
- Features such as layout saving, multi-chart views, and customizable alerts separate average platforms from truly professional solutions
- For traders operating on mobile, evaluating app quality is just as important as assessing the desktop version. Keep your account protected with 2FA enabled and use Proof of Reserves as a key security criterion when choosing a platform
Related Reading
- 10 Common Technical Analysis Mistakes in Crypto Trading (And How to Avoid Them)
- How to Master the BingX Spot Trading Dashboard: Candlesticks, Order Books, and Market Sentiment
- How to Use Order Book Depth and Market Data for Bitcoin Trading
- Top 5 BTC Alerts for 2026: Strategies for Traders vs. Holders
- Top Gold Trading Strategies for 2026: Day Trading, Swing Trading, and Hedging
